Healthcare Systems: Australia and United States - A Comparison Report
VerifiedAdded on 2023/04/25
|14
|4296
|90
Report
AI Summary
This report provides a comprehensive comparative analysis of the healthcare systems in Australia and the United States. It begins with an introduction to the healthcare leadership and the importance of healthcare delivery. The report then delves into the funding mechanisms, including public and private insurance models, and the GDP spent on health in both countries. It examines system governance arrangements, highlighting the roles of government agencies and stakeholders. Population health indicators such as maternal mortality rate, infant mortality rate, and life expectancy at birth are compared, revealing significant differences in health outcomes. Furthermore, health system performance indicators, including low birth weight infants, obesity, diabetes, asthma, hypertension, and cancer rates, are assessed. The report concludes with a discussion on the management of quality and safety within each health system, drawing on various sources and statistical data to support the comparison.

RUNNING HEAD: Healthcare 0
Healthcare
Healthcare
Paraphrase This Document
Need a fresh take? Get an instant paraphrase of this document with our AI Paraphraser
Healthcare 1
Contents
Introduction...........................................................................................................................................2
Funding.................................................................................................................................................2
Funding system / health insurance.....................................................................................................2
GDP spent on health..........................................................................................................................3
System governance arrangements in the country.................................................................................5
Population health indicators.................................................................................................................6
Maternal mortality rate.....................................................................................................................6
Infant mortality rate..........................................................................................................................6
Life expectancy at birth.....................................................................................................................8
Health system performance indicators..................................................................................................9
Low birth weight infants....................................................................................................................9
Obesity..............................................................................................................................................9
Diabetes.............................................................................................................................................9
Asthma............................................................................................................................................10
Hypertension (High Blood Pressure)................................................................................................10
Cancer..............................................................................................................................................10
Management of quality and safety in the health system....................................................................11
References...........................................................................................................................................12
Healthcare 2
Introduction
The health leaders direct the accomplishments of a group towards a common goal. The
features of the leadership role comprise persuading group activities and managing with the
change. The healthcare systems are serene of several professional groups, departments and
spheres. The healthcare leaders internationally identify the people’s experience of healthcare
delivery are significant and invest resources to monitor. The aspects of the healthcare
delivery are relative to each other. The healthcare leaders are intricate in all the aspects of the
healthcare comprising budgeting, patientcare, job skills, national and local healthcare laws,
policies, quality measures and outcomes. These are required to be knowledgeable along with
adaptable. Several parts of the healthcare are ever varying so the leaders have ability to make
and lead required challenges. It necessitates healthcare leaders to communicate effectively
and evidently.
The health care is highly demanded. The universal health care lacks due to the high charges.
The healthcare performance data is analysed between Australia and U.S. Both the countries
are broke down on the basis of the areas given below:
Funding
Funding system / health insurance
The health system of Australia is considered as one of the best worldwide. It offers quality,
safe and affordable health care for individuals and family. The healthcare in Australia is
conveyed as a mixed system comprising universal healthcare (public) and private providers
(insurance). Mostly healthcare is offered publically whereas remaining are offered by the
private sector. The Australian, state and territory governments are accountable for running
health system in the country (Duckett & Willcox, 2015). The public sector insurance in Australia
is generally known as Medicare. It offers healthcare advantage to the citizens, expatriates and
permanent residents. Such people have communal healthcare coverage contract with the
country. The Medicare is sponsored from tax dollars and by imposing 1.5% of each person’s
income who have not acquired private insurance (Bennett, 2013). The Medicare comprises of
two constituents, disbursements to public hospitals by states and territories. The other one is
direct payments to the doctors and other health specialists. The Medicare is subsidised
through the taxation and levy (Hesson, et al. 2018). The budget of the Australian government
⊘ This is a preview!⊘
Do you want full access?
Subscribe today to unlock all pages.
Trusted by 1+ million students worldwide
Healthcare 3
for the 2013-2014 to 2015-2016, the Medicare levy was correspondingly 2.94%, 3.85% and
4% of total tax revenue.
The common wealth and state and territories have come into the national health reform
agreement (NHRA) concerning arrangement of funding of hospitals in Australia. The NHRA
is responsible for funding and administration of the public hospitals in the country (Donato &
Segal, 2013).
The costs of the healthcare are higher in U.S than other countries. Such higher costs are
sometimes regarded as unsustainable. The health care in U.S is remunerated by the
government programs such as Medicare and Medicaid, private health insurance plans and
through individual’s own funds. The health care is advanced in U.S but equally expensive.
The percentage of GDP spent on the healthcare is suggestively advanced than other nations.
The system in U.S is a mix of public and private insurance. The government offers insurance
coverage via Medicare and Medicaid (Betancourt, 2016).
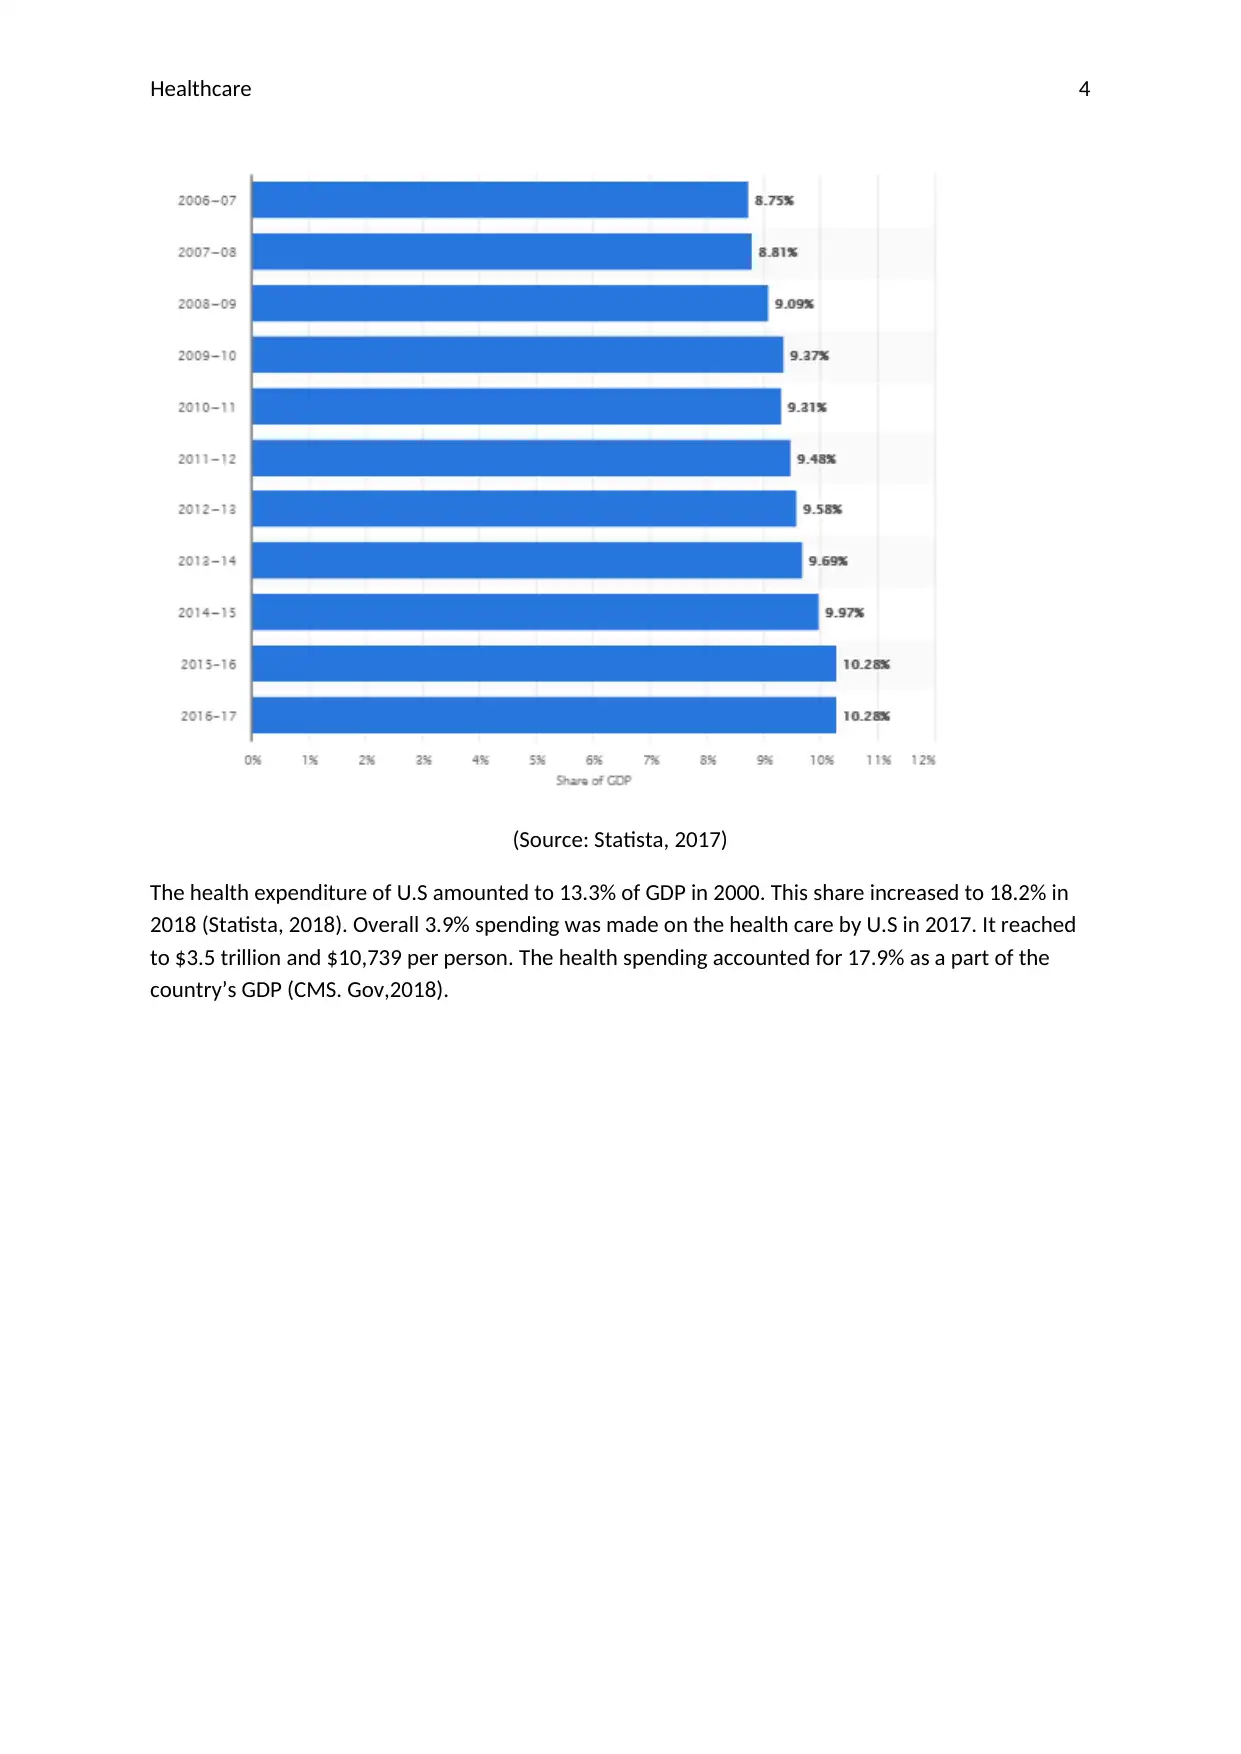
GDP spent on health
The total spending of $170.4 billion was made on the health by Australia in 2015-2016. It was 3.6%
higher than the spending made in 2014-15. It was the 4th constant year that progress was less than
the average of 4.7%. In spite of the low growth, the GDP was signified by health 10.3%. It sustained
to grow due to the slow GDP growth that is 2.7%. It represented that health expenditure in Australia
remain to be lower in 2015-16 when it is compared to the ten year average (The Guardian, 2017).
for the 2013-2014 to 2015-2016, the Medicare levy was correspondingly 2.94%, 3.85% and
4% of total tax revenue.
The common wealth and state and territories have come into the national health reform
agreement (NHRA) concerning arrangement of funding of hospitals in Australia. The NHRA
is responsible for funding and administration of the public hospitals in the country (Donato &
Segal, 2013).
The costs of the healthcare are higher in U.S than other countries. Such higher costs are
sometimes regarded as unsustainable. The health care in U.S is remunerated by the
government programs such as Medicare and Medicaid, private health insurance plans and
through individual’s own funds. The health care is advanced in U.S but equally expensive.
The percentage of GDP spent on the healthcare is suggestively advanced than other nations.
The system in U.S is a mix of public and private insurance. The government offers insurance
coverage via Medicare and Medicaid (Betancourt, 2016).
GDP spent on health
The total spending of $170.4 billion was made on the health by Australia in 2015-2016. It was 3.6%
higher than the spending made in 2014-15. It was the 4th constant year that progress was less than
the average of 4.7%. In spite of the low growth, the GDP was signified by health 10.3%. It sustained
to grow due to the slow GDP growth that is 2.7%. It represented that health expenditure in Australia
remain to be lower in 2015-16 when it is compared to the ten year average (The Guardian, 2017).
Paraphrase This Document
Need a fresh take? Get an instant paraphrase of this document with our AI Paraphraser
Healthcare 4
(Source: Statista, 2017)
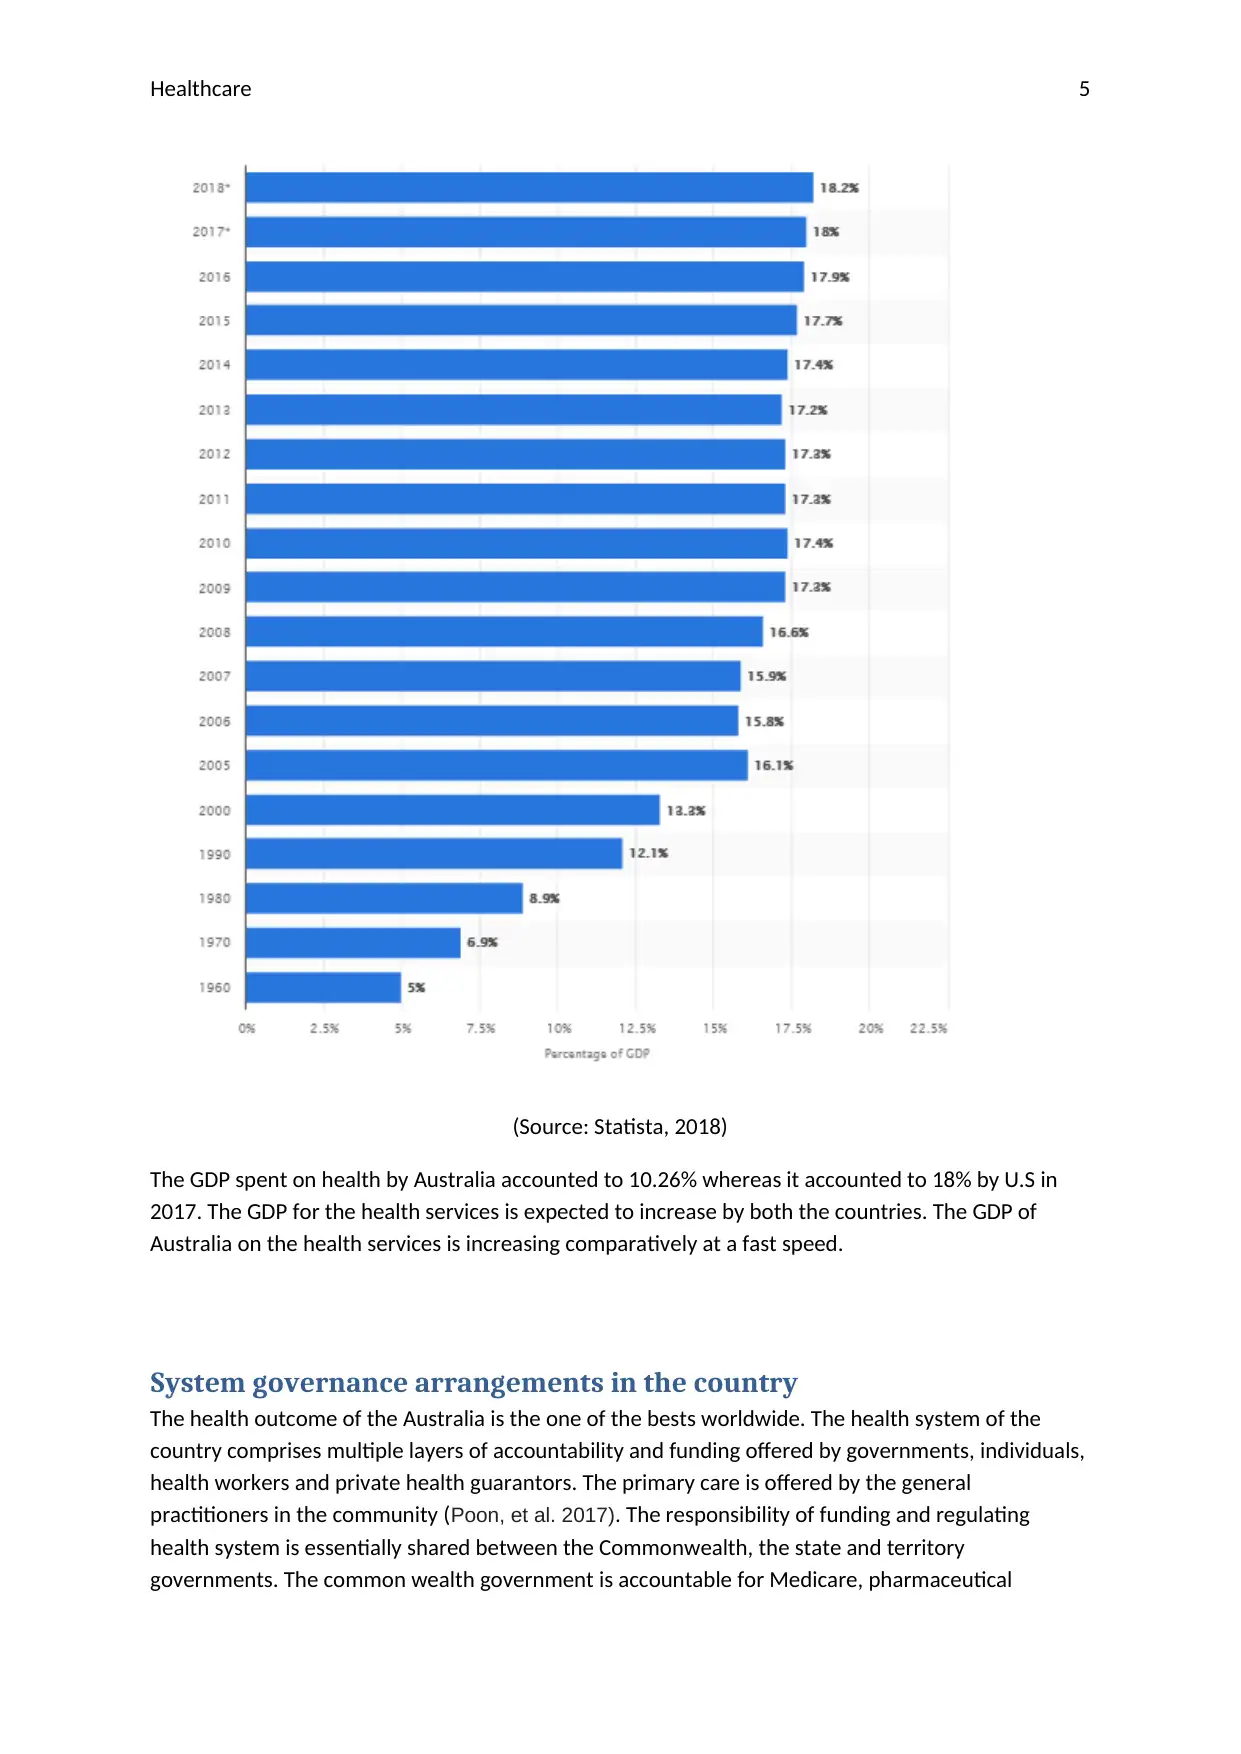
The health expenditure of U.S amounted to 13.3% of GDP in 2000. This share increased to 18.2% in
2018 (Statista, 2018). Overall 3.9% spending was made on the health care by U.S in 2017. It reached
to $3.5 trillion and $10,739 per person. The health spending accounted for 17.9% as a part of the
country’s GDP (CMS. Gov,2018).
(Source: Statista, 2017)
The health expenditure of U.S amounted to 13.3% of GDP in 2000. This share increased to 18.2% in
2018 (Statista, 2018). Overall 3.9% spending was made on the health care by U.S in 2017. It reached
to $3.5 trillion and $10,739 per person. The health spending accounted for 17.9% as a part of the
country’s GDP (CMS. Gov,2018).
Healthcare 5
(Source: Statista, 2018)
The GDP spent on health by Australia accounted to 10.26% whereas it accounted to 18% by U.S in
2017. The GDP for the health services is expected to increase by both the countries. The GDP of
Australia on the health services is increasing comparatively at a fast speed.
System governance arrangements in the country
The health outcome of the Australia is the one of the bests worldwide. The health system of the
country comprises multiple layers of accountability and funding offered by governments, individuals,
health workers and private health guarantors. The primary care is offered by the general
practitioners in the community (Poon, et al. 2017). The responsibility of funding and regulating
health system is essentially shared between the Commonwealth, the state and territory
governments. The common wealth government is accountable for Medicare, pharmaceutical
⊘ This is a preview!⊘
Do you want full access?
Subscribe today to unlock all pages.
Trusted by 1+ million students worldwide
Healthcare 6
benefits scheme (PBS), purchase of vaccines, medical research grants, subsidies for old care services,
education of health professionals and subsidised hearing services. On the other side, the states and
territories are majorly accountable for the management and supervision of the public hospitals,
conveyance of the preventive services and subsidy and management of the community services. The
state government is equally responsible for the food safety, health regulation, patient transport,
public dental clinics, regulation and inspection of the health services. The commonwealth, state and
territories collectively share responsibilities like preventive services, responding to national health
services, registration and accreditation of the health professionals (Hesson, et al. 2018).
In United States, the department of the health and human services (HHS) is the federal government
agency. This agency has role in the health care services of U.S. The health care in the United States is
not only the state’s responsibility but it is the responsibility of the Nation as whole. The
organizations comprised by the HHS are centres for the Medicare and Medicaid services. The centers
for controlling and preventing diseases conduct the research and programs in order to protect
health and safety in the country (Finer and Zolna, 2016). The national institutes of health is
accountable for biomedical and health concerning research. On the other side, health resources and
services administration assists health care health care access for the people who are isolated and
medically vulnerable (Corso et al. 2015).
Population health indicators
Maternal mortality rate
The maternal mortality rate (MMR) is the yearly number of the women deaths per 100,000 live
births from any reason concerning pregnancy. The MMR in Australia in 2016 was 8.5 deaths per
100,000 women giving birth. In the period of 2006-2016, 281 women stated to have died during
pregnancy and within the 42 days of the completion of pregnancy. The women more than the age of
35 and under 20 are more anticipated to die in link with the childbirth (Australian Government,
2017).
The U.S is worst in preventing pregnancy related deaths. The MMR in U.S increased from 17 deaths
in 1990 to 26 deaths in 2015 (Maternal health task force, 2018). The country has not been successful
in meeting national goals concerning maternal mortality reduction. The common bases of maternal
death found were bleeding in the brain and in abdomen.
Comments: The MMR in both the countries Australia and United States is threatening. But the
condition in United States is worst in averting pregnancy related deaths.
Infant mortality rate
The infant mortality rate (IMR) is the measure of human infant deaths more than one year of age. It
is a significant indicator of the inclusive physical health of the community. 991 infant deaths were
registered in Australia in 2015. It was a 2.1% decrease as compared to 2014. The number of infants
has comparatively reduced in the last ten years. The infant mortality rate has decreased by 41%
between 2001-2016. In 2015, the IMR was lowest with the record of 3.2 infant demises per 1,000
live births in Australia. It represented improved condition as IMR in 2005 was 4.9 deaths per 1,000
live births (Australian Bureau of Statistic, 2015).
Paraphrase This Document
Need a fresh take? Get an instant paraphrase of this document with our AI Paraphraser
Healthcare 7
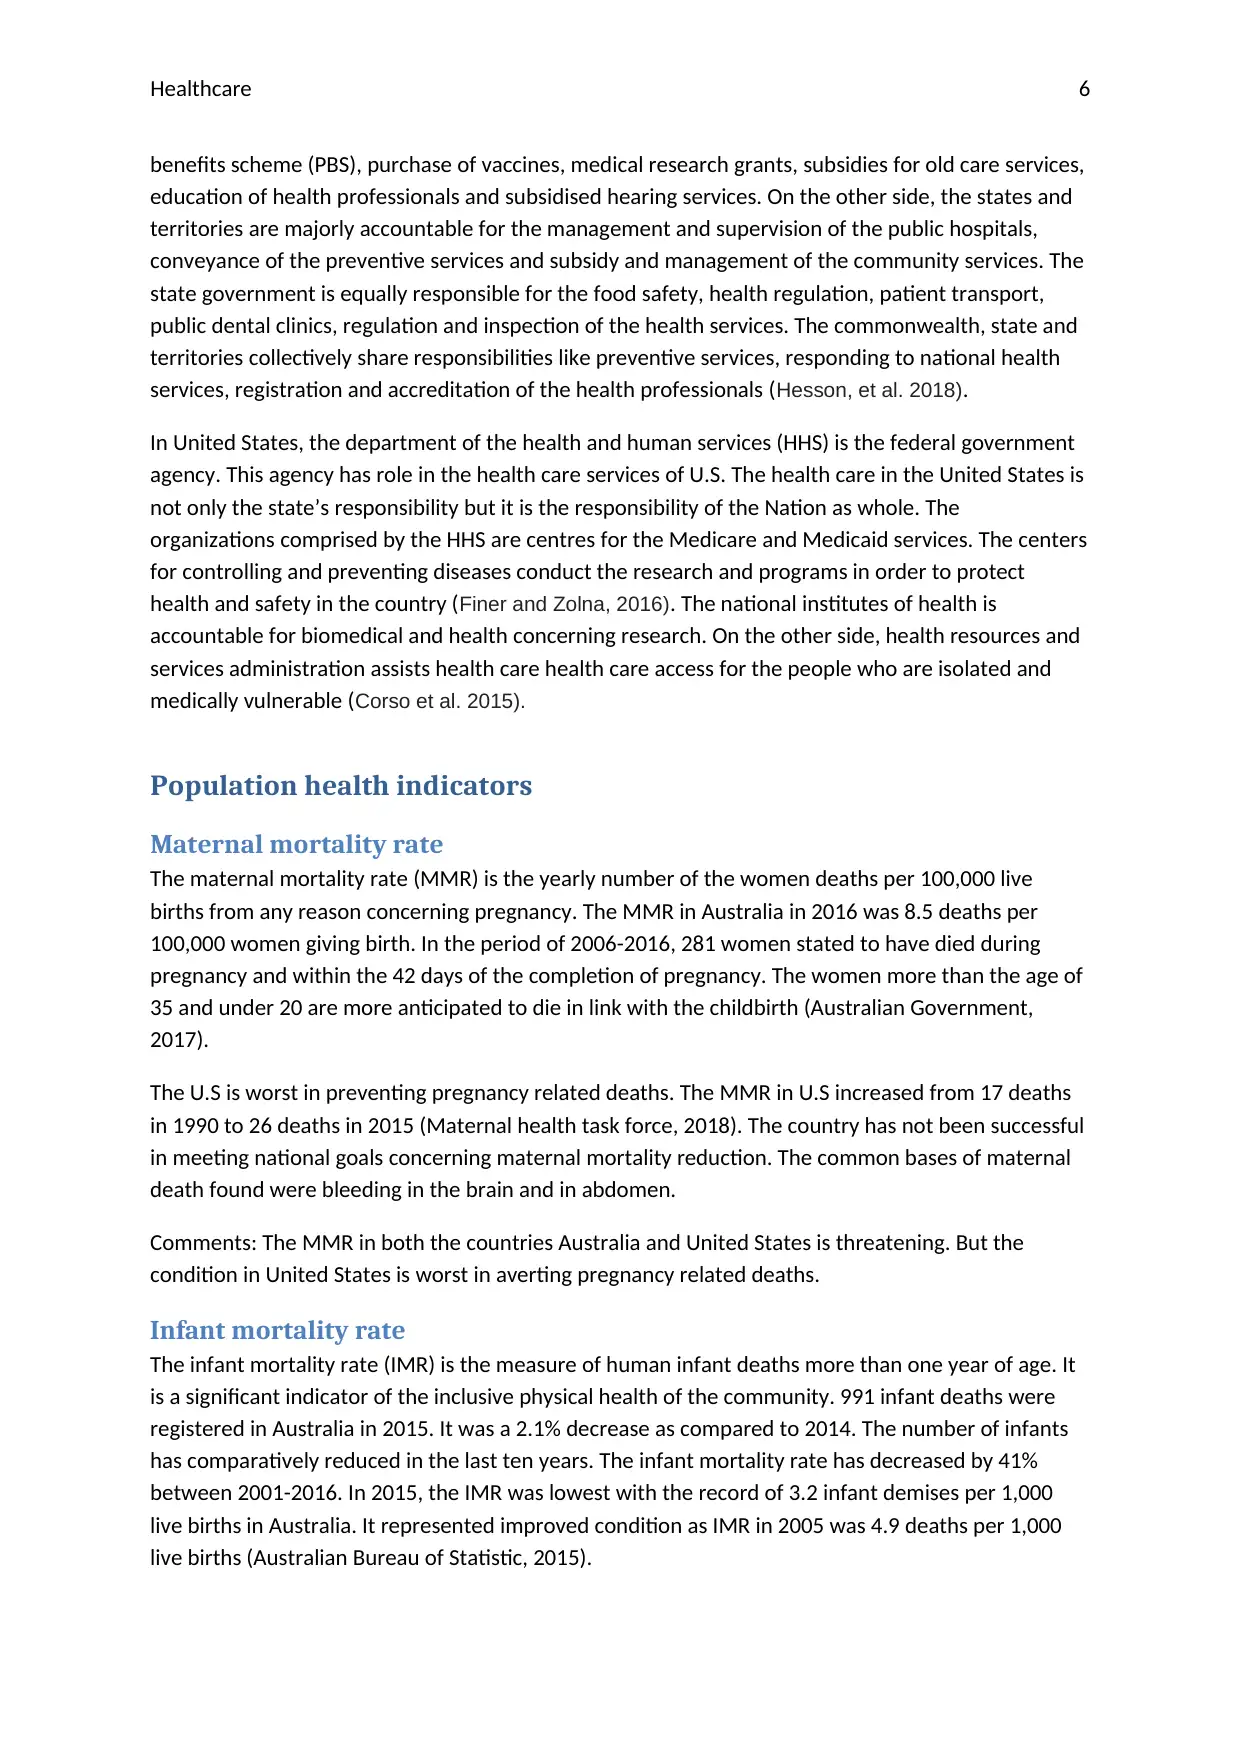
(Source: Statista, 2019)
The infant mortality rate in U.S has been a source of concern. The babies in U.S are three times more
anticipated to die from several immaturity. The IMS in U.S is measured in deaths per 1,000 births.
Although, the IMR has been declined in the recent years. The infant mortality rate in U.S has
declined to 14% from 2005-15. It resulted in falling 6.86 deaths per 1000 births in 2005 to 5.9 deaths
in 2015 (Becker’s hospital review, 2018).
Healthcare 8
(Source: Statista, 2019)
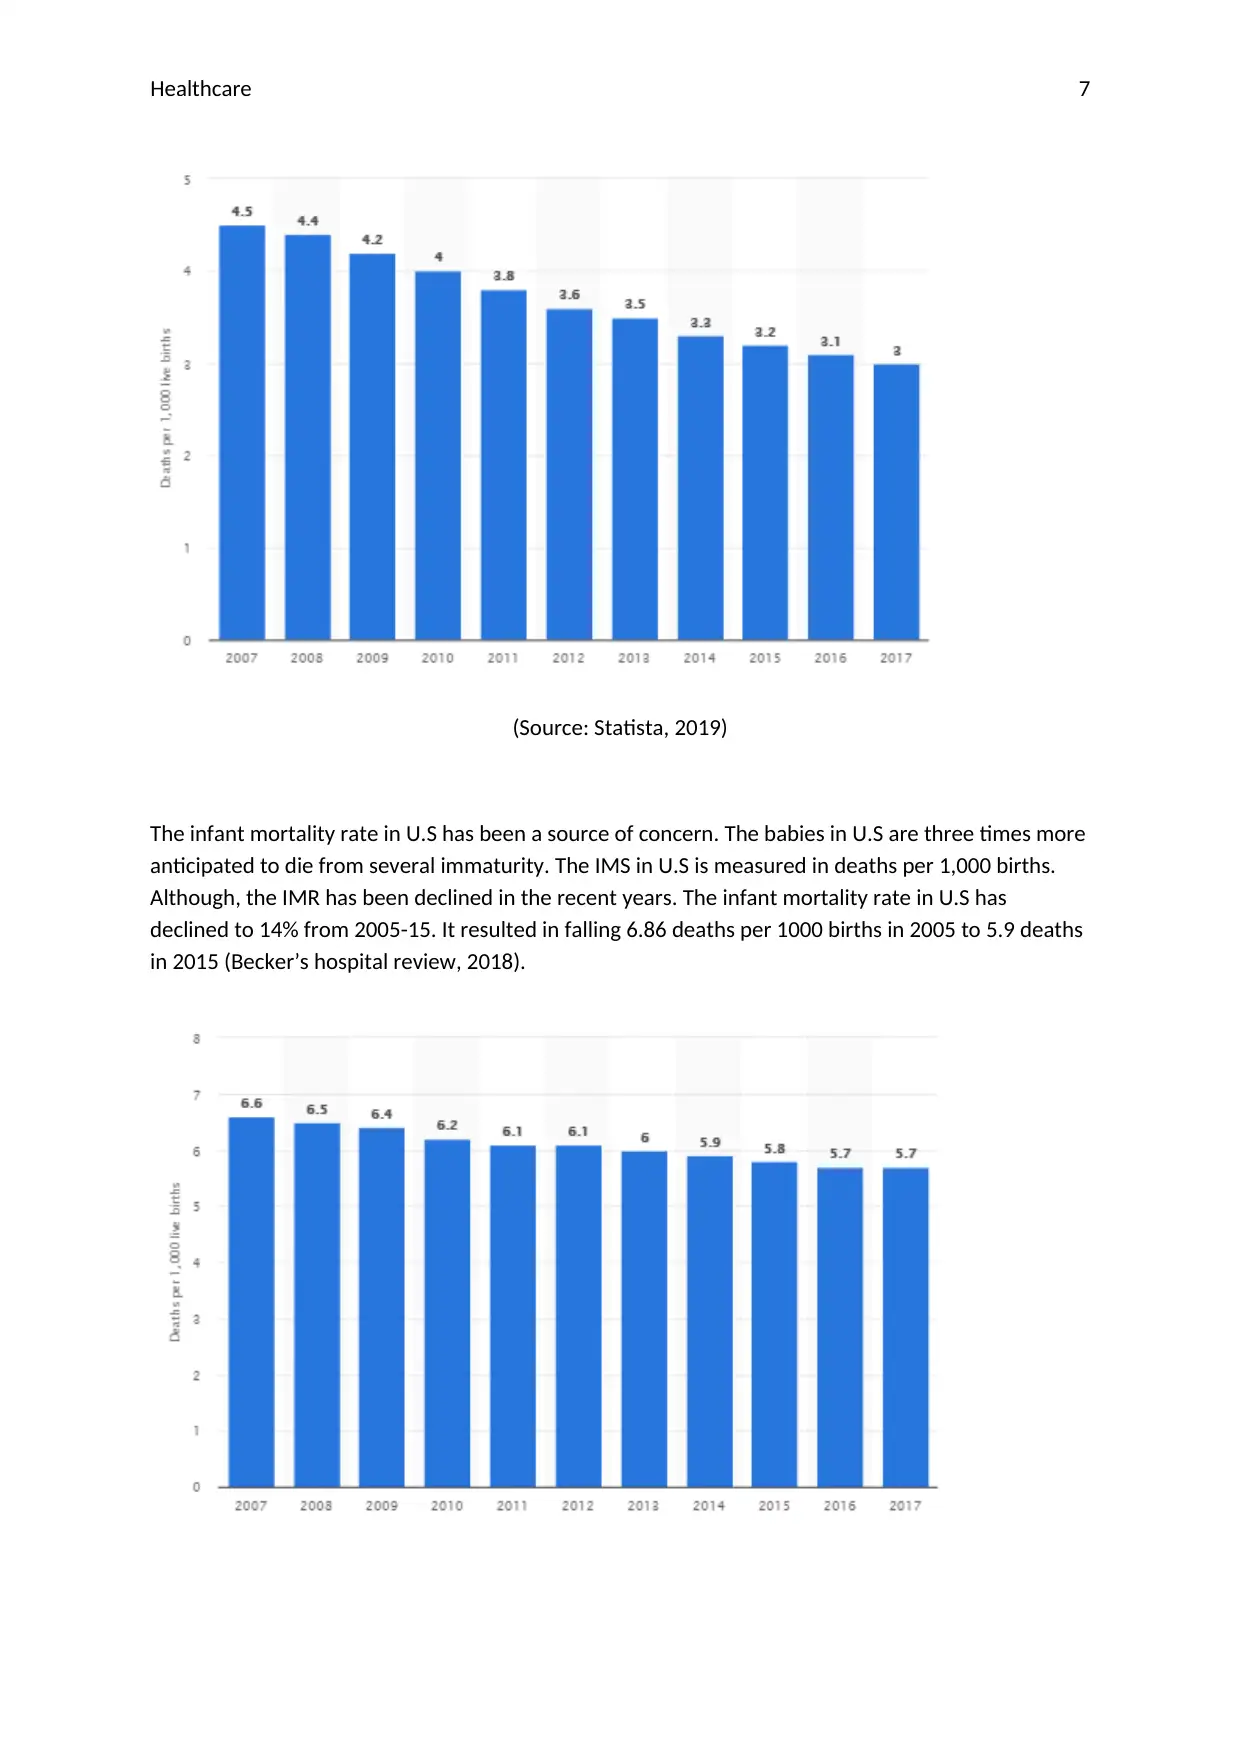
Comments: The IMR in Australia from 2007 to 2017 was about 3 demises per 1,000 live births
whereas in U.S the IMR was 5.7 demises per 1,000 lives in the same period. It clearly represents the
concerning condition in the U.S. Australia has made some remarkable improvement in reducing IMR.
Life expectancy at birth
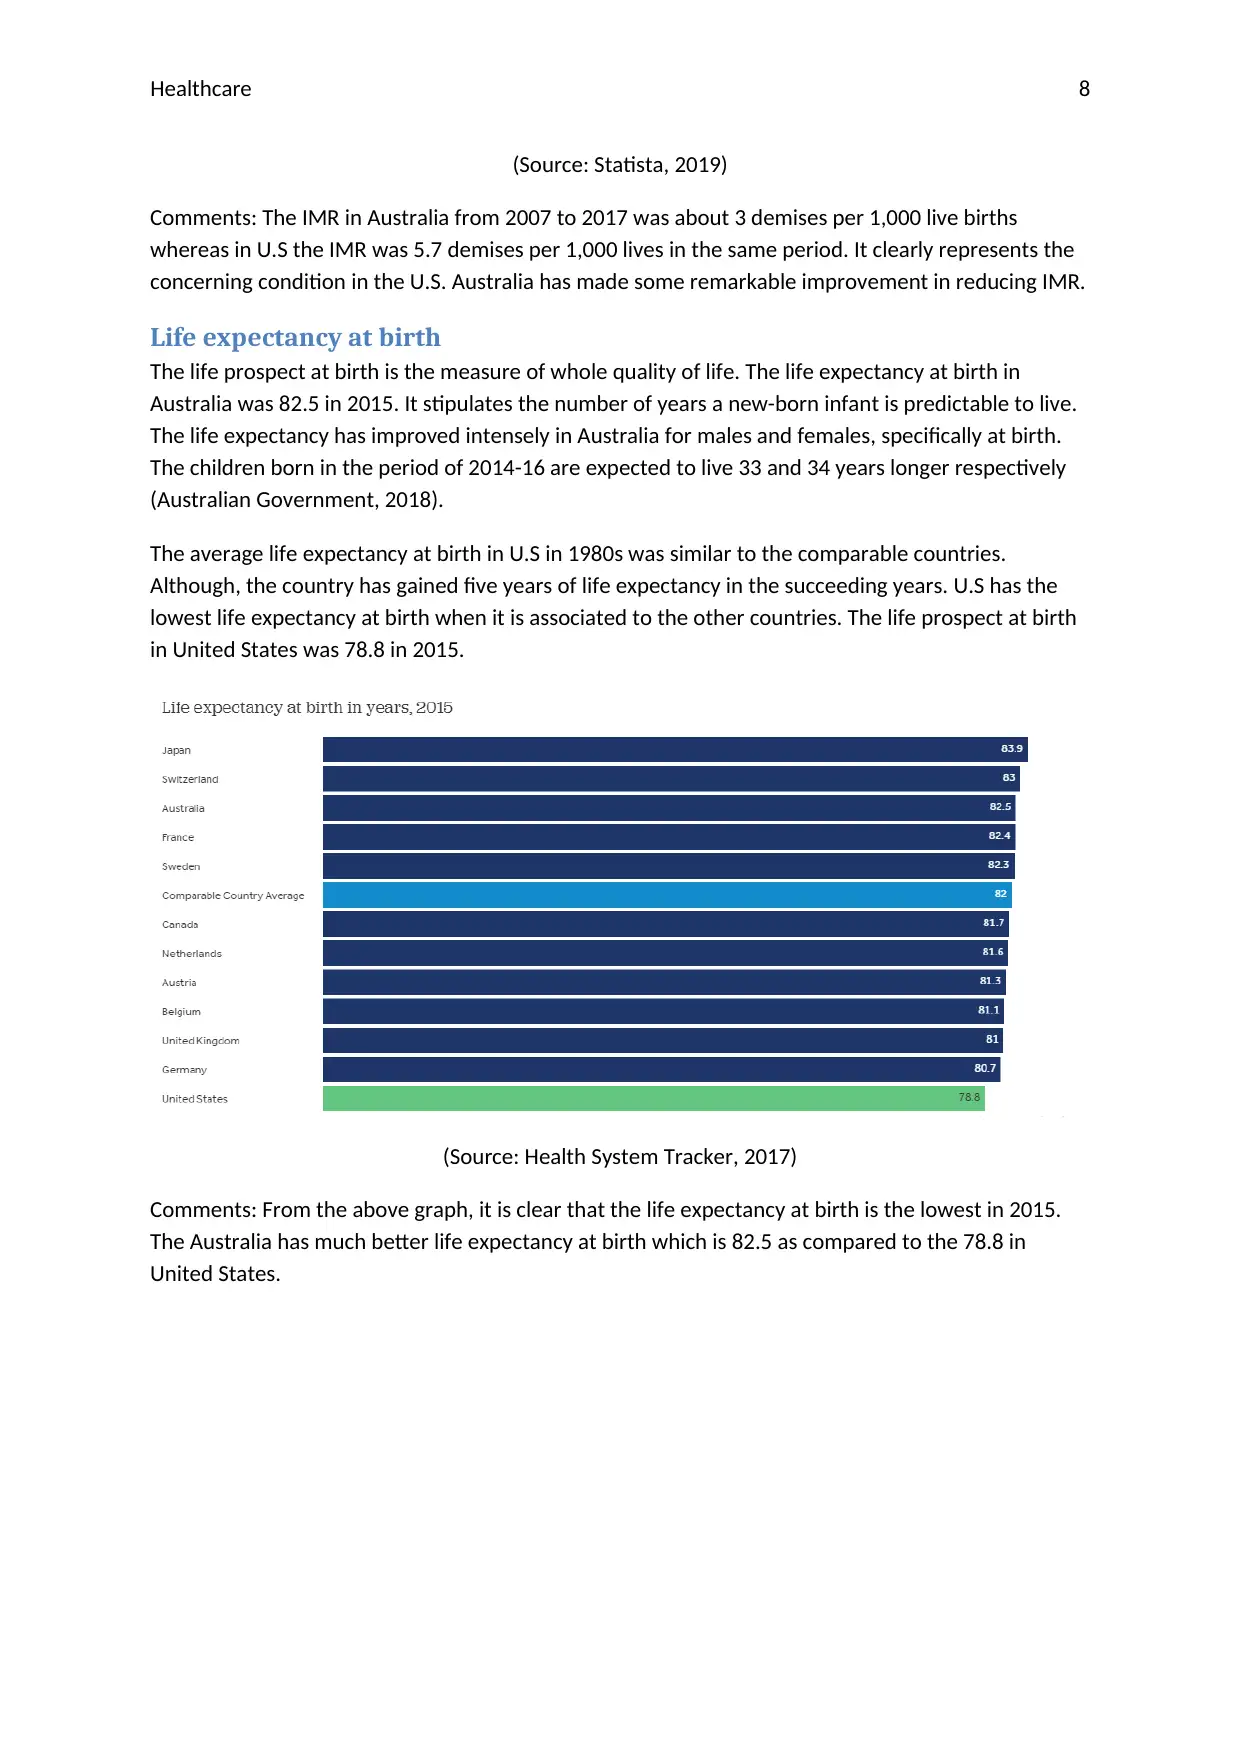
The life prospect at birth is the measure of whole quality of life. The life expectancy at birth in
Australia was 82.5 in 2015. It stipulates the number of years a new-born infant is predictable to live.
The life expectancy has improved intensely in Australia for males and females, specifically at birth.
The children born in the period of 2014-16 are expected to live 33 and 34 years longer respectively
(Australian Government, 2018).
The average life expectancy at birth in U.S in 1980s was similar to the comparable countries.
Although, the country has gained five years of life expectancy in the succeeding years. U.S has the
lowest life expectancy at birth when it is associated to the other countries. The life prospect at birth
in United States was 78.8 in 2015.
(Source: Health System Tracker, 2017)
Comments: From the above graph, it is clear that the life expectancy at birth is the lowest in 2015.
The Australia has much better life expectancy at birth which is 82.5 as compared to the 78.8 in
United States.
(Source: Statista, 2019)
Comments: The IMR in Australia from 2007 to 2017 was about 3 demises per 1,000 live births
whereas in U.S the IMR was 5.7 demises per 1,000 lives in the same period. It clearly represents the
concerning condition in the U.S. Australia has made some remarkable improvement in reducing IMR.
Life expectancy at birth
The life prospect at birth is the measure of whole quality of life. The life expectancy at birth in
Australia was 82.5 in 2015. It stipulates the number of years a new-born infant is predictable to live.
The life expectancy has improved intensely in Australia for males and females, specifically at birth.
The children born in the period of 2014-16 are expected to live 33 and 34 years longer respectively
(Australian Government, 2018).
The average life expectancy at birth in U.S in 1980s was similar to the comparable countries.
Although, the country has gained five years of life expectancy in the succeeding years. U.S has the
lowest life expectancy at birth when it is associated to the other countries. The life prospect at birth
in United States was 78.8 in 2015.
(Source: Health System Tracker, 2017)
Comments: From the above graph, it is clear that the life expectancy at birth is the lowest in 2015.
The Australia has much better life expectancy at birth which is 82.5 as compared to the 78.8 in
United States.
⊘ This is a preview!⊘
Do you want full access?
Subscribe today to unlock all pages.
Trusted by 1+ million students worldwide
Healthcare 9
Health system performance indicators
Low birth weight infants
The babies are deliberated of low birth weight when they ponder fewer than 2500 g at birth. The
low birth weight is linked with the augmented risk of corporal and mental disabilities. Such risk
becomes substantial for the babies who weigh less than the 1500 g. As per the report of 2015, 6.5%
of the new born babies in Australia were of low weight. The baby girls are more likely to be of low
weight at birth as compared to the baby boys. A little change has been experienced in the proportion
of low weight babies over the last ten years. It remained in the range of 6.1% to 6.5% (Australian
Government, 2018).
More than 8% of the new born babies weigh around 8 pounds on an average. One out of twelve
children in U.S is underweight. There has been increase in the low birth weight toddlers from 1.2%
to 1.5% in the period of 1983 to 2005. The ratio of low birth weight decreased from 42.9% to 54.8%.
7.8% of births registered to be low births in the period of 2005-2009.
Comments: When both the countries are compared on the basis of low birth rates. The condition of
Australia is better than the United States.
Obesity
Obesity is a robust risk factor for the diabetes, cardiac disease, cancers and more. In 2014-15 one
out of five children aged 2-4 were obese or overweight in Australia. Almost one out of four aged 5-
17 were overweight or obese. For both 5-14 and 5-17 years of age, there were similar proportions of
obese. The occurrence of fatness rose from 21% in 1995 to 25% in 2008 and endured constant to
2015. The prevalence of obesity increased and lead to 63% obesity in the Australia in 2015. A great
proportion of obesity was found in men as compared to the women (Australian Government, 2017).
The obesity affected 93.3 million of U.S.adults in 2015-2016 and led to the prevalence of 39.8%. The
men and women having college degrees had lower obesity than the persons with less education. On
the other side, 32.5% of the American adults are overweight. It reflects that over two third of the
adults in US are either overweight or obese.
Comments: There is more prevalence of fast food in United States. As a result, there are more cases
found of obesity in the country.
Diabetes
The adults in Australia aged 18 or over had diabetes in 2014-15. It comprises persons with type one
diabetes, type two diabetes and eliminates gestational diabetes. The occurrence of the diabetes has
tripled between 1989-90 and 2014-15. The ratio of the people with diabetes has augmented from
1.5% to 4.7%. The prevalence of diabetes among the adults in 2014-15 was found higher in men (7%)
than women (5%). It increases rapidly up to the age of 75. The prevalence of diabetes is high in the
lowest socio economic group then in the uppermost socioeconomic group (Australian Government,
2018).
Over 100 million U.S. adults are suffering from diabetes. As per the report of 2015, 9.4% of the U.S.
population have diabetes. It comprised 30.3 million Americans. Around 1.25 million American
Paraphrase This Document
Need a fresh take? Get an instant paraphrase of this document with our AI Paraphraser
Healthcare 10
children and adults have type one diabetes. The diabetes was considered seventh foremost cause of
death in U.S. in 2015.
Commentary: The occurrence of diabetes has suddenly come in the lime light of Australia. The
number of the diabetic patients is increasing on the constant basis.
Asthma
It has been revealed that 11% of the Australians have Asthma which is about 2.5 million people are
suffering from Asthma. The suffering of Asthma is found more in the women than men. On the other
side, it is more prevalent in boys than girls aged 01-14. Whereas Asthma is more prevalent in the
females aged 15 and more. The women existing in the rural areas of Australia have more Asthma
than women living in the urban areas. It is more common among the disadvantaged communities.
Asthma costs almost $1.2 billion a year as a healthcare costs (Health Direct, 2018).
Asthma is a major disease in United States. Almost 25.7 million people have Asthma which
comprises 7 million children. In United States children more than the age of 15 are more likely to
have Asthma especially boys. Asthma is more common in women among the older teens and adults.
Commentary: The number of people having Asthma is subsequently reducing in Australia. It
percentage of people having Asthma in Australia in 2011 was 8.6% which reduced to 8.5% in 2012.
The percentage of people having Asthma also reduced from 4.4% to 3.8% between 2012 and 201
Hypertension (High Blood Pressure)
In 2014-15, around 6 million Australians aged 18 years and more had high blood pressure. It
represents that 33.7% Australians are suffering from hyper tension. More than 68% had
uncontrolled high blood pressure which signified 4 million adults. As per the report of 2014-15, men
are more anticipated to have uncontrolled blood pressure than the women. On the other hand,
number of Australians having unrestrained blood pressure has increased with the age. The people
suffering from hyper tension are more likely to consider complete cardiovascular disease risk.
High blood pressure puts at the risk for heart disease and is also one of the causes of death in U.S.
Around 75 million American adults are having high blood pressure which represents to one person
out of three. Only 50% of people are having control on their blood pressure. The high blood pressure
was one of subsidizing causes of death for over 410,000 Americans in 2014 (Centers for Disease
Control and Prevention, 2018).
Commentary: The people suffer more from high blood pressure are more in United States than
Australia. There are only 50% of people who are healthy and not affected by the high blood pressure
in United States.
Cancer
1 out of 2 Australians are detected with the cancer by the age of 85. It is a foremost reason of death
in Australia. Almost 134,174 Australians are diagnosed with the cancer in 2017. Cancer is more
common in the older Australians. The cancer incidents have increased in the recent years and the
cancer mortality rates have fallen. The most common diagnosed cancer in Australia is breast cancer.
Cancer costs over $4.5 billion in direct health system outlays (Cancer Council, 2018).
Healthcare 11
In 2018, almost 1,735,350 individuals were diagnosed with the cancer. In 2016, almost 15.5 million
individuals were detected with cancer. Cancer costed $147.3 billion in 2017 in United States. Such
costs are expected to increase along with the treatments and standards of care. In 2012, 14.2 million
new cases were rose and 8.2 million cancer related deaths. 57% new cases were faced in 2012 in the
less developed regions of the country. The number of new cases per year is anticipated to upsurge
23.6 million by 2030.
Commentary: From the data discussed above, it can be concluded that there is more proportion of
cancer share in Australia.
Management of quality and safety in the health system
The quality and safety expansion initiatives pervade health care. The management of the health care
is stated as the degree to which health facilities for people upsurge the probability of preferred
health consequences. It is even consistent with the existing professional knowledge. The
management of the quality and safety in the health system comprises health insurance, changing
mix of patients and important factors contributing complexity of health care. The management of
quality and safety in the health system concludes the effects of health care on the preferred
outcomes. It also evaluates the degree to which health care obeys to processes based on the precise
degree. The management of the quality and safety in the health system is agreed by the professional
consent and is often stable with the patient preferences. It is significant to adopt several process
improvement techniques in order to identify inefficiencies, safety, ineffectual care and preventable
errors linked with the health system. The health system and quality is managed in such a way that it
assesses performance and uses finding to inform change. It is the degree of excellence to which the
client needs are meet and their expectations are exceeded.
⊘ This is a preview!⊘
Do you want full access?
Subscribe today to unlock all pages.
Trusted by 1+ million students worldwide
1 out of 14
Related Documents


Your All-in-One AI-Powered Toolkit for Academic Success.
+13062052269
info@desklib.com
Available 24*7 on WhatsApp / Email
![[object Object]](/_next/static/media/star-bottom.7253800d.svg)
Unlock your academic potential
Copyright © 2020–2026 A2Z Services. All Rights Reserved. Developed and managed by ZUCOL.