Australian Agricultural Company Limited: Integrated Reporting Report
VerifiedAdded on 2020/09/03
|15
|2674
|34
Report
AI Summary
This report provides a comprehensive analysis of the financial statements of Australian Agricultural Company Limited (AAC Limited), focusing on integrated reporting practices. The analysis delves into various financial statement adjustments, including cattle fair value adjustments, property valuations, and the comparison of net profits and comprehensive income. The report examines the classification of livestock under current and non-current assets, the treatment of property, plant, and equipment, and the recording of borrowings under non-current liabilities. It also explores future minimum lease payments, the impact of Australian Accounting Standard AASB 16, other commitments, and contingencies. The report highlights the company's financial performance, discussing increases in cattle fair value, property values, and net profits. The analysis also addresses the impact of market movements, biological transformation, and natural rise on cattle fair value, along with the depreciation, amortization, and revaluation of properties. Furthermore, the report examines the company's borrowings, lease payments, and other commitments, offering insights into its financial position and strategic planning.
INTEGRATED
REPORTING: PROBLEM
SOLVING
REPORTING: PROBLEM
SOLVING
Paraphrase This Document
Need a fresh take? Get an instant paraphrase of this document with our AI Paraphraser
Table of Contents
INTRODUCTION...........................................................................................................................1
PART A...........................................................................................................................................1
(i) Cattle fair value adjustments..................................................................................................1
(ii) Adjustments in fair value of property...................................................................................2
(iii) Comparison of net profits and comprehensive income........................................................4
PART B............................................................................................................................................6
(i) Live stock under current and non current assets....................................................................6
(ii) Property, plant and equipment under non current assets.......................................................7
(iii) Borrowings recorded under non current liabilities...............................................................8
PART C............................................................................................................................................9
(i) Future minimum lease payment.............................................................................................9
(ii) Impact of Australian Accounting Standard AASB 16 on the company..............................10
(iii) Other commitments............................................................................................................10
(iv) Contingencies.....................................................................................................................10
CONCLUSION..............................................................................................................................11
REFERENCES..............................................................................................................................12
Illustration Index
Illustration 1: Comparison of cattle fair value.................................................................................2
Illustration 2: Comparison of values of property, plants and equipments.......................................3
Illustration 3: Comparison of fair value of property........................................................................4
Illustration 4: Comparison of profits................................................................................................5
Illustration 5: Comparison of comprehensive income.....................................................................5
Illustration 6: Fair value of cattle.....................................................................................................7
Illustration 7: Property, plant and equipments.................................................................................8
Illustration 8: Comparison of borrowings........................................................................................9
Illustration 9: Comparison of leased land and building.................................................................10
Index of Tables
Table 1: Increase or decrease in cattle fair value.............................................................................1
Table 2: Fair value of the property..................................................................................................3
Table 3: Profits for 2016 and 2017..................................................................................................4
Table 4: Increase or decrease in comprehensive income.................................................................5
Table 5: Fair value of different type of cattle..................................................................................6
Table 6: Increase or decrease in borrowings....................................................................................8
Table 7: Increase or decrease in operating lease of land and building............................................9
⊘ This is a preview!⊘
Do you want full access?
Subscribe today to unlock all pages.
Trusted by 1+ million students worldwide
INTRODUCTION
Integrated reporting helps to develop strategical plan considering the risk of investors and
stakeholders. Periodic results are considered to investigate the financial performance of the
company by analysing sustainability of the reports (Healy and Palepu, 2012). Australian
Agricultural Company Limited is involved in improvement of beef cattle production with the
help of resources and land. The report discusses the financial statement adjustments of the
company. It focuses on treatment of various adjustments such as, cattle fair value adjustments,
fair value of property, borrowings, livestock etc.
PART A
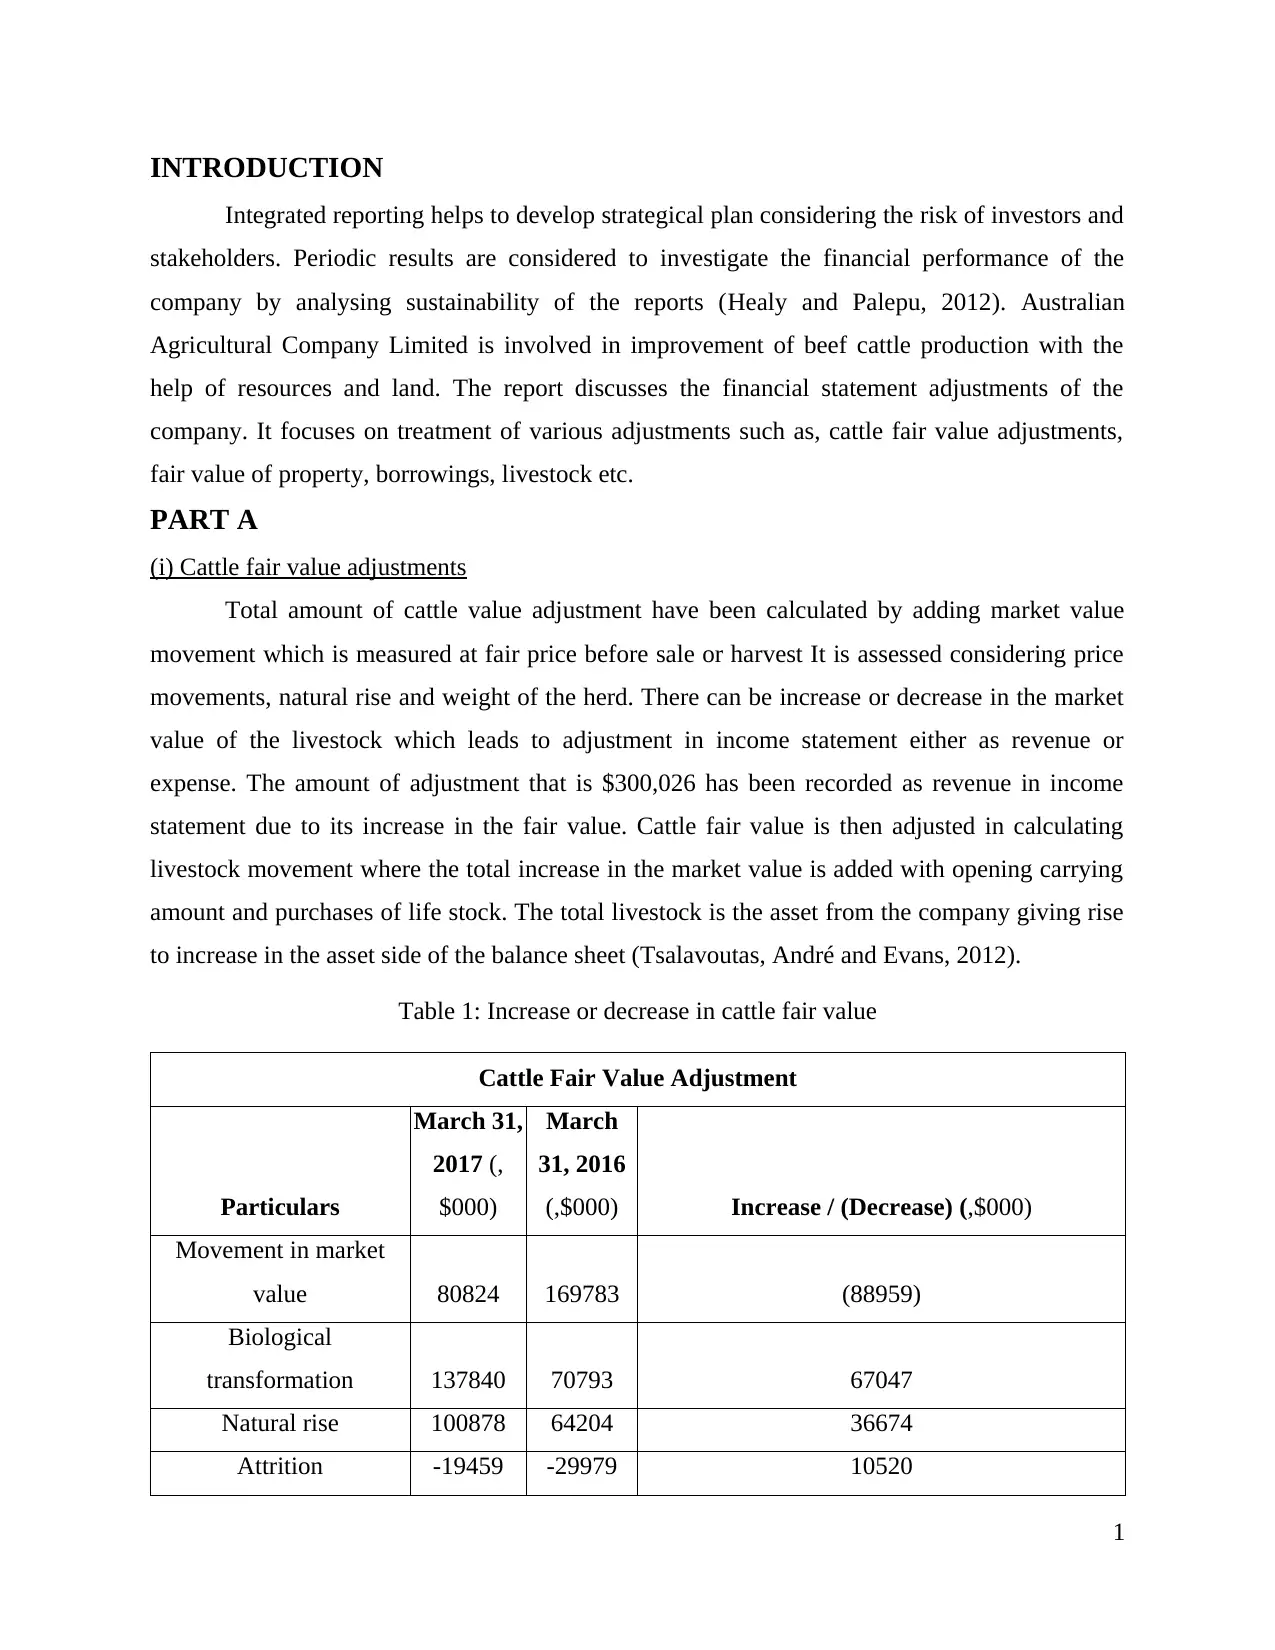
(i) Cattle fair value adjustments
Total amount of cattle value adjustment have been calculated by adding market value
movement which is measured at fair price before sale or harvest It is assessed considering price
movements, natural rise and weight of the herd. There can be increase or decrease in the market
value of the livestock which leads to adjustment in income statement either as revenue or
expense. The amount of adjustment that is $300,026 has been recorded as revenue in income
statement due to its increase in the fair value. Cattle fair value is then adjusted in calculating
livestock movement where the total increase in the market value is added with opening carrying
amount and purchases of life stock. The total livestock is the asset from the company giving rise
to increase in the asset side of the balance sheet (Tsalavoutas, André and Evans, 2012).
Table 1: Increase or decrease in cattle fair value
Cattle Fair Value Adjustment
Particulars
March 31,
2017 (,
$000)
March
31, 2016
(,$000) Increase / (Decrease) (,$000)
Movement in market
value 80824 169783 (88959)
Biological
transformation 137840 70793 67047
Natural rise 100878 64204 36674
Attrition -19459 -29979 10520
1
Integrated reporting helps to develop strategical plan considering the risk of investors and
stakeholders. Periodic results are considered to investigate the financial performance of the
company by analysing sustainability of the reports (Healy and Palepu, 2012). Australian
Agricultural Company Limited is involved in improvement of beef cattle production with the
help of resources and land. The report discusses the financial statement adjustments of the
company. It focuses on treatment of various adjustments such as, cattle fair value adjustments,
fair value of property, borrowings, livestock etc.
PART A
(i) Cattle fair value adjustments
Total amount of cattle value adjustment have been calculated by adding market value
movement which is measured at fair price before sale or harvest It is assessed considering price
movements, natural rise and weight of the herd. There can be increase or decrease in the market
value of the livestock which leads to adjustment in income statement either as revenue or
expense. The amount of adjustment that is $300,026 has been recorded as revenue in income
statement due to its increase in the fair value. Cattle fair value is then adjusted in calculating
livestock movement where the total increase in the market value is added with opening carrying
amount and purchases of life stock. The total livestock is the asset from the company giving rise
to increase in the asset side of the balance sheet (Tsalavoutas, André and Evans, 2012).
Table 1: Increase or decrease in cattle fair value
Cattle Fair Value Adjustment
Particulars
March 31,
2017 (,
$000)
March
31, 2016
(,$000) Increase / (Decrease) (,$000)
Movement in market
value 80824 169783 (88959)
Biological
transformation 137840 70793 67047
Natural rise 100878 64204 36674
Attrition -19459 -29979 10520
1
Paraphrase This Document
Need a fresh take? Get an instant paraphrase of this document with our AI Paraphraser
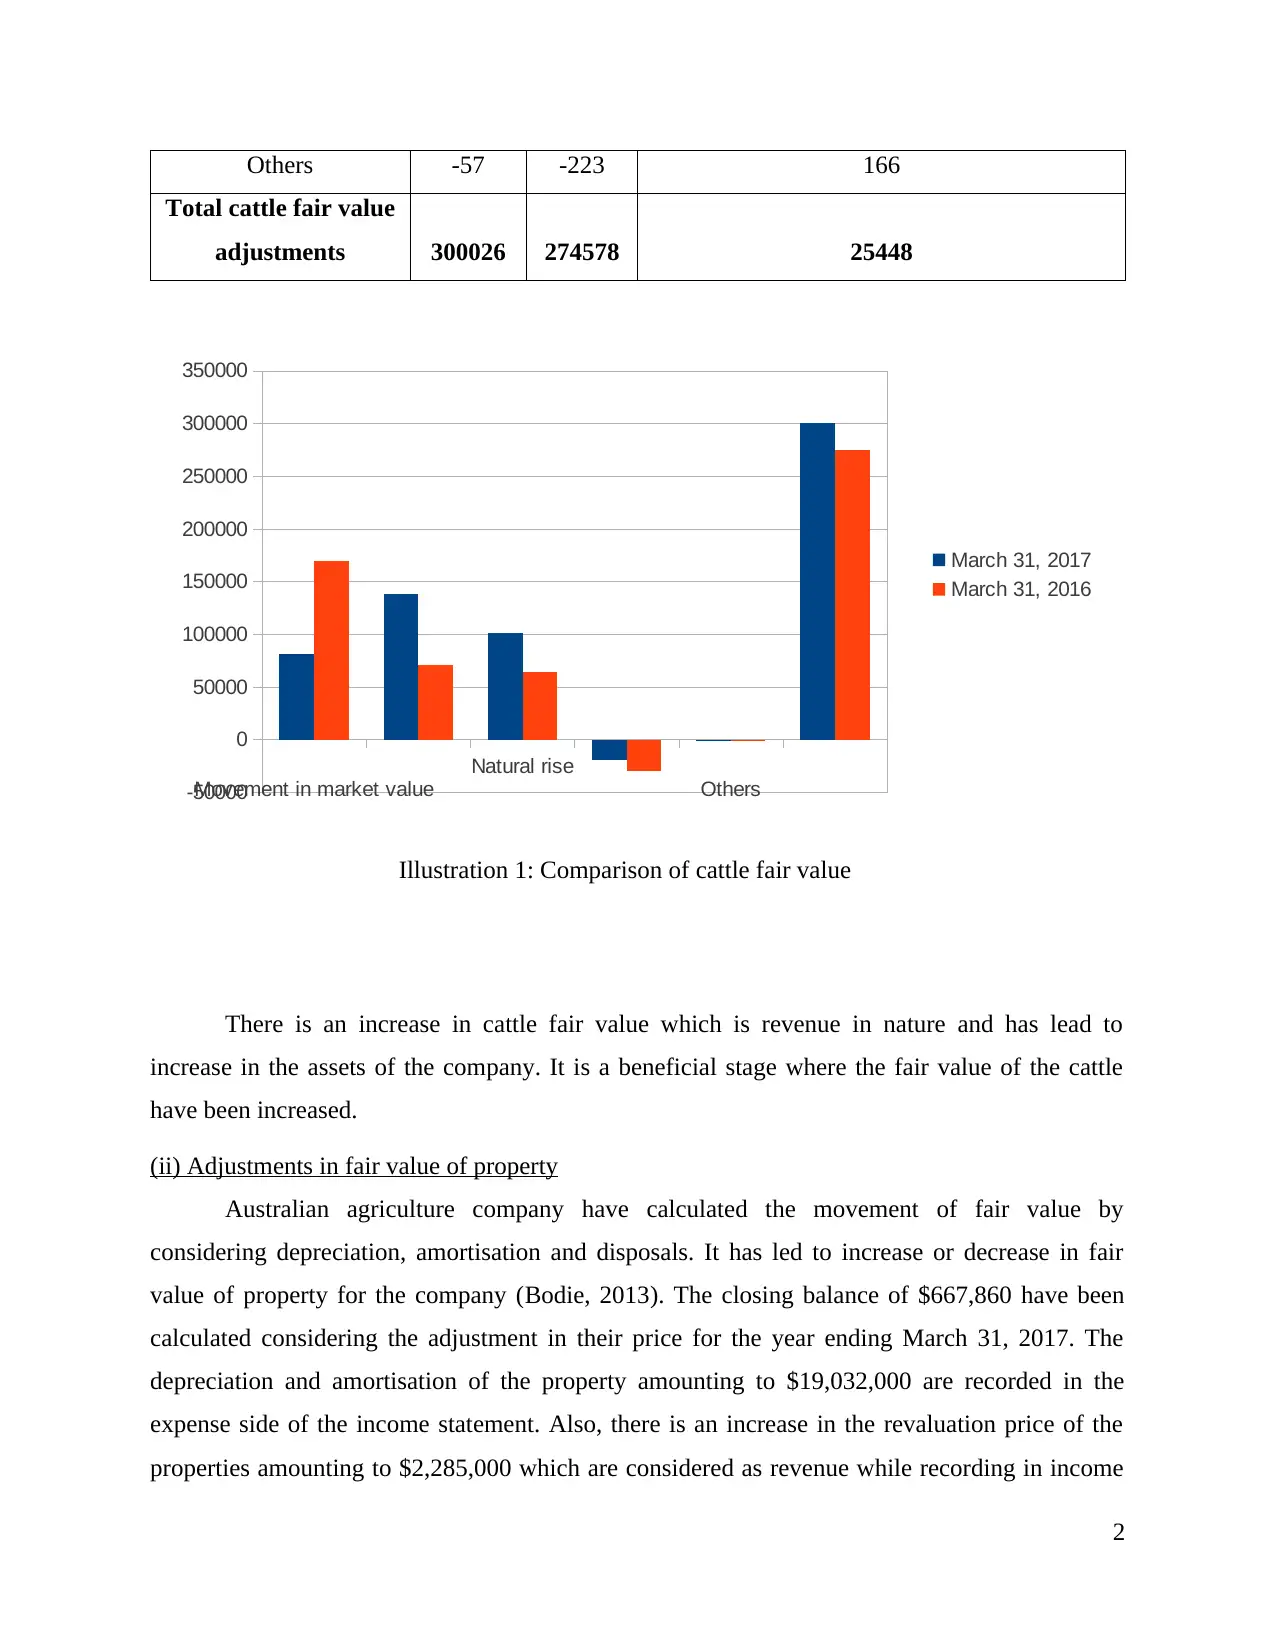
Others -57 -223 166
Total cattle fair value
adjustments 300026 274578 25448
There is an increase in cattle fair value which is revenue in nature and has lead to
increase in the assets of the company. It is a beneficial stage where the fair value of the cattle
have been increased.
(ii) Adjustments in fair value of property
Australian agriculture company have calculated the movement of fair value by
considering depreciation, amortisation and disposals. It has led to increase or decrease in fair
value of property for the company (Bodie, 2013). The closing balance of $667,860 have been
calculated considering the adjustment in their price for the year ending March 31, 2017. The
depreciation and amortisation of the property amounting to $19,032,000 are recorded in the
expense side of the income statement. Also, there is an increase in the revaluation price of the
properties amounting to $2,285,000 which are considered as revenue while recording in income
2
Movement in market value
Natural rise
Others-50000
0
50000
100000
150000
200000
250000
300000
350000
March 31, 2017
March 31, 2016
Illustration 1: Comparison of cattle fair value
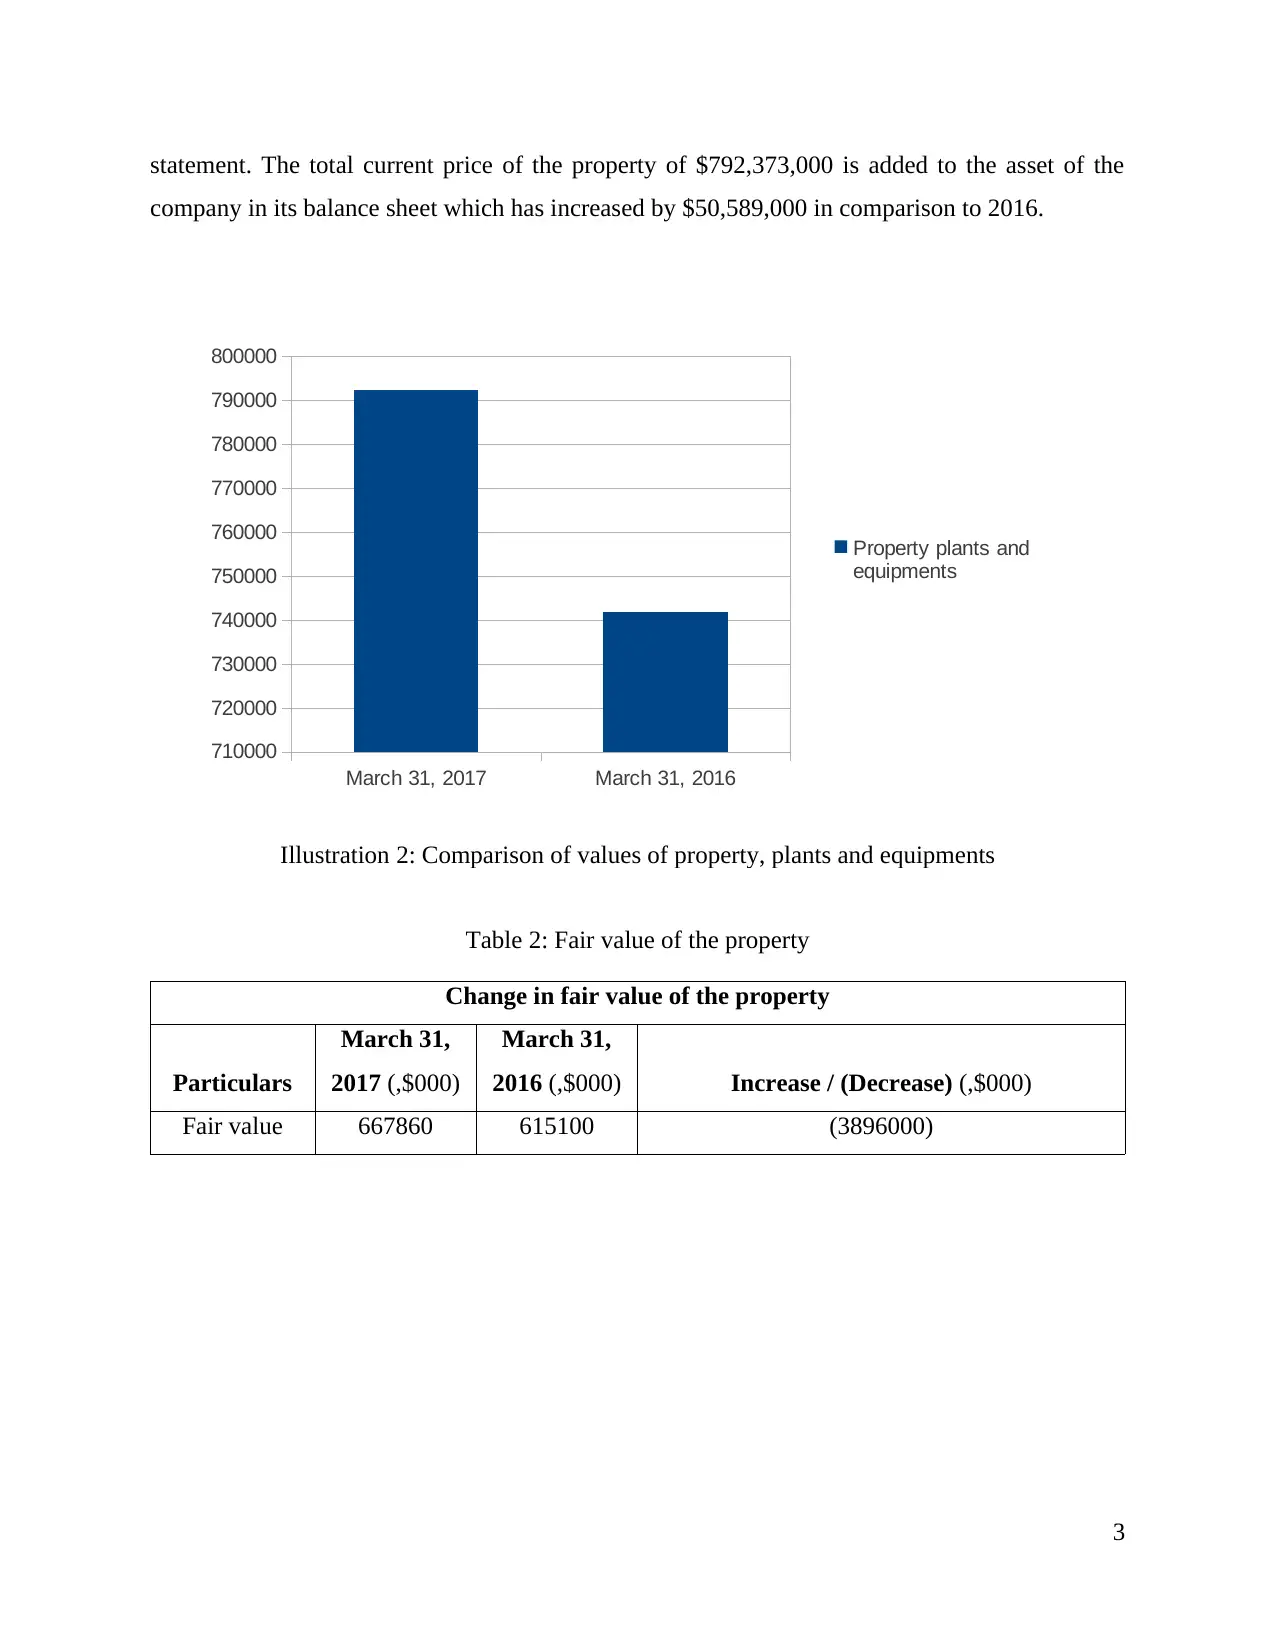
statement. The total current price of the property of $792,373,000 is added to the asset of the
company in its balance sheet which has increased by $50,589,000 in comparison to 2016.
Table 2: Fair value of the property
Change in fair value of the property
Particulars
March 31,
2017 (,$000)
March 31,
2016 (,$000) Increase / (Decrease) (,$000)
Fair value 667860 615100 (3896000)
3
March 31, 2017 March 31, 2016
710000
720000
730000
740000
750000
760000
770000
780000
790000
800000
Property plants and
equipments
Illustration 2: Comparison of values of property, plants and equipments
⊘ This is a preview!⊘
Do you want full access?
Subscribe today to unlock all pages.
Trusted by 1+ million students worldwide
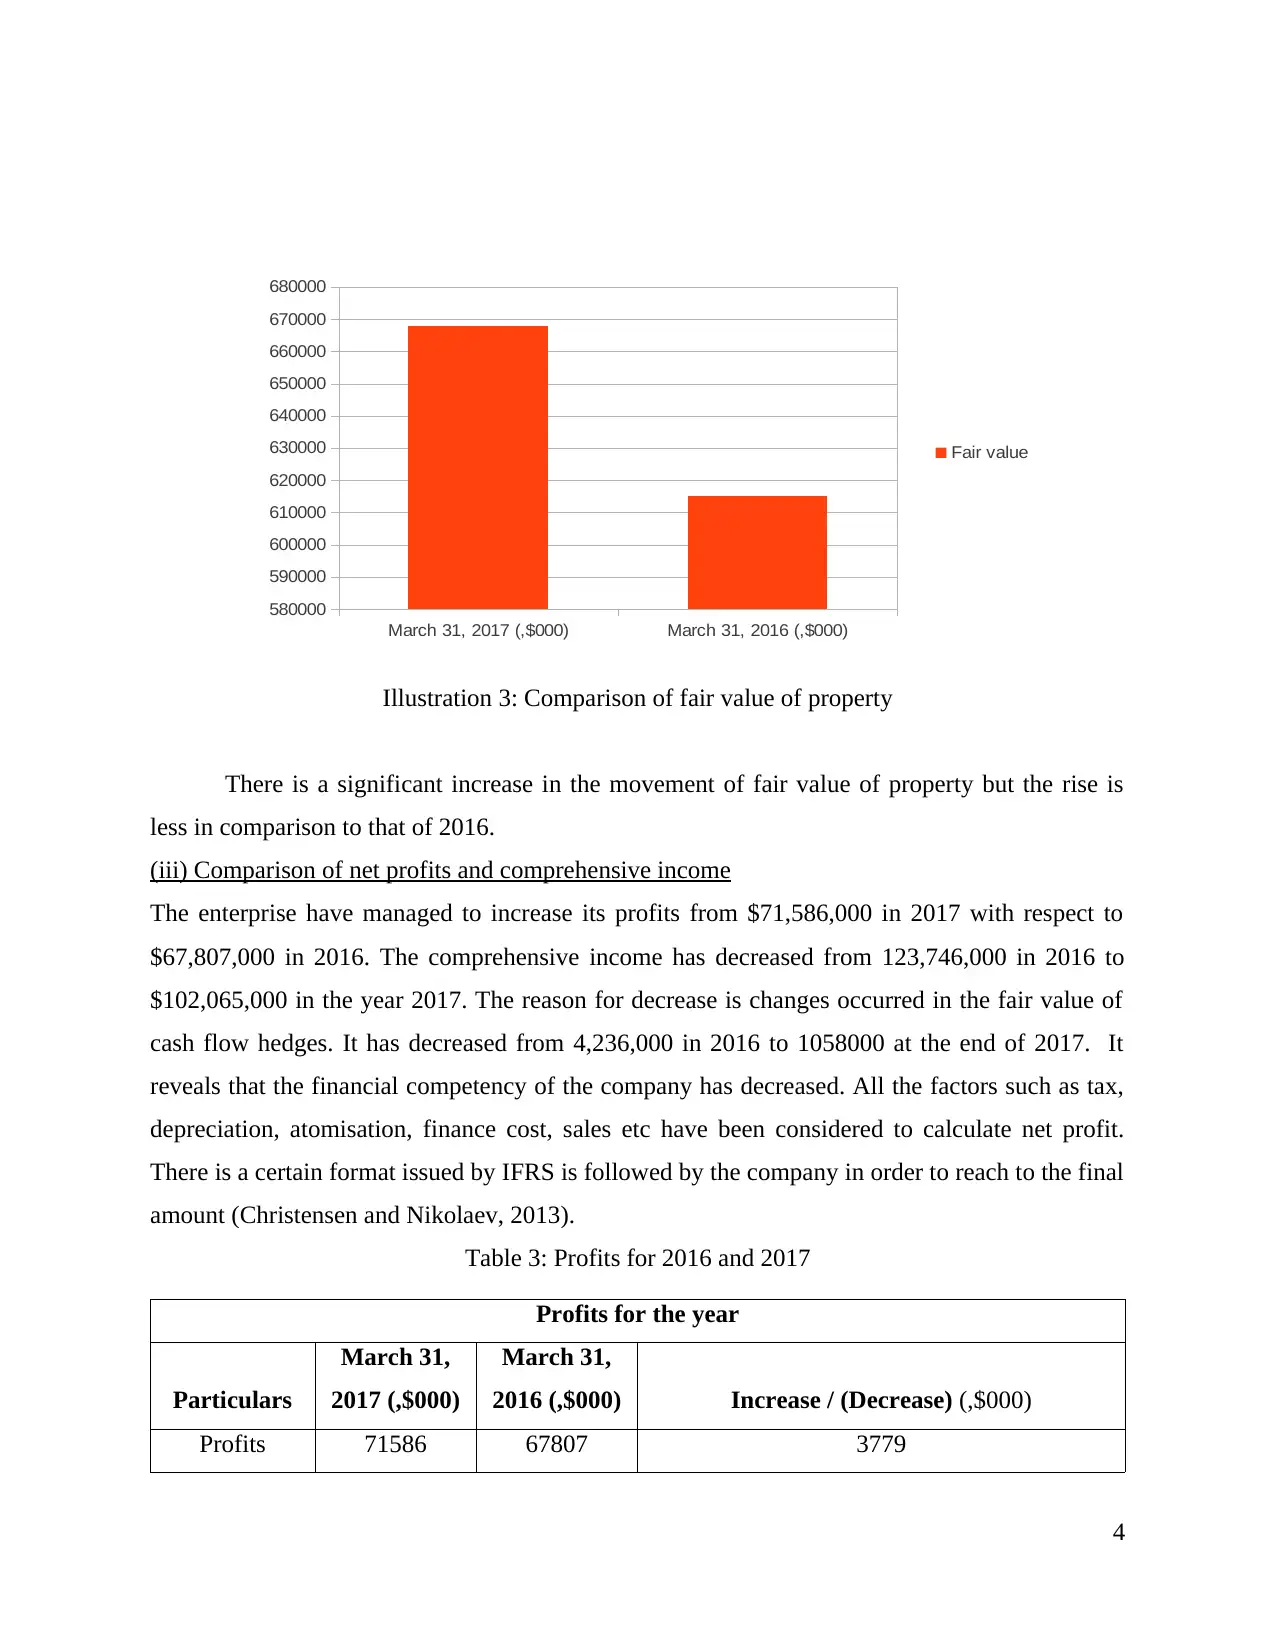
There is a significant increase in the movement of fair value of property but the rise is
less in comparison to that of 2016.
(iii) Comparison of net profits and comprehensive income
The enterprise have managed to increase its profits from $71,586,000 in 2017 with respect to
$67,807,000 in 2016. The comprehensive income has decreased from 123,746,000 in 2016 to
$102,065,000 in the year 2017. The reason for decrease is changes occurred in the fair value of
cash flow hedges. It has decreased from 4,236,000 in 2016 to 1058000 at the end of 2017. It
reveals that the financial competency of the company has decreased. All the factors such as tax,
depreciation, atomisation, finance cost, sales etc have been considered to calculate net profit.
There is a certain format issued by IFRS is followed by the company in order to reach to the final
amount (Christensen and Nikolaev, 2013).
Table 3: Profits for 2016 and 2017
Profits for the year
Particulars
March 31,
2017 (,$000)
March 31,
2016 (,$000) Increase / (Decrease) (,$000)
Profits 71586 67807 3779
4
March 31, 2017 (,$000) March 31, 2016 (,$000)
580000
590000
600000
610000
620000
630000
640000
650000
660000
670000
680000
Fair value
Illustration 3: Comparison of fair value of property
Paraphrase This Document
Need a fresh take? Get an instant paraphrase of this document with our AI Paraphraser
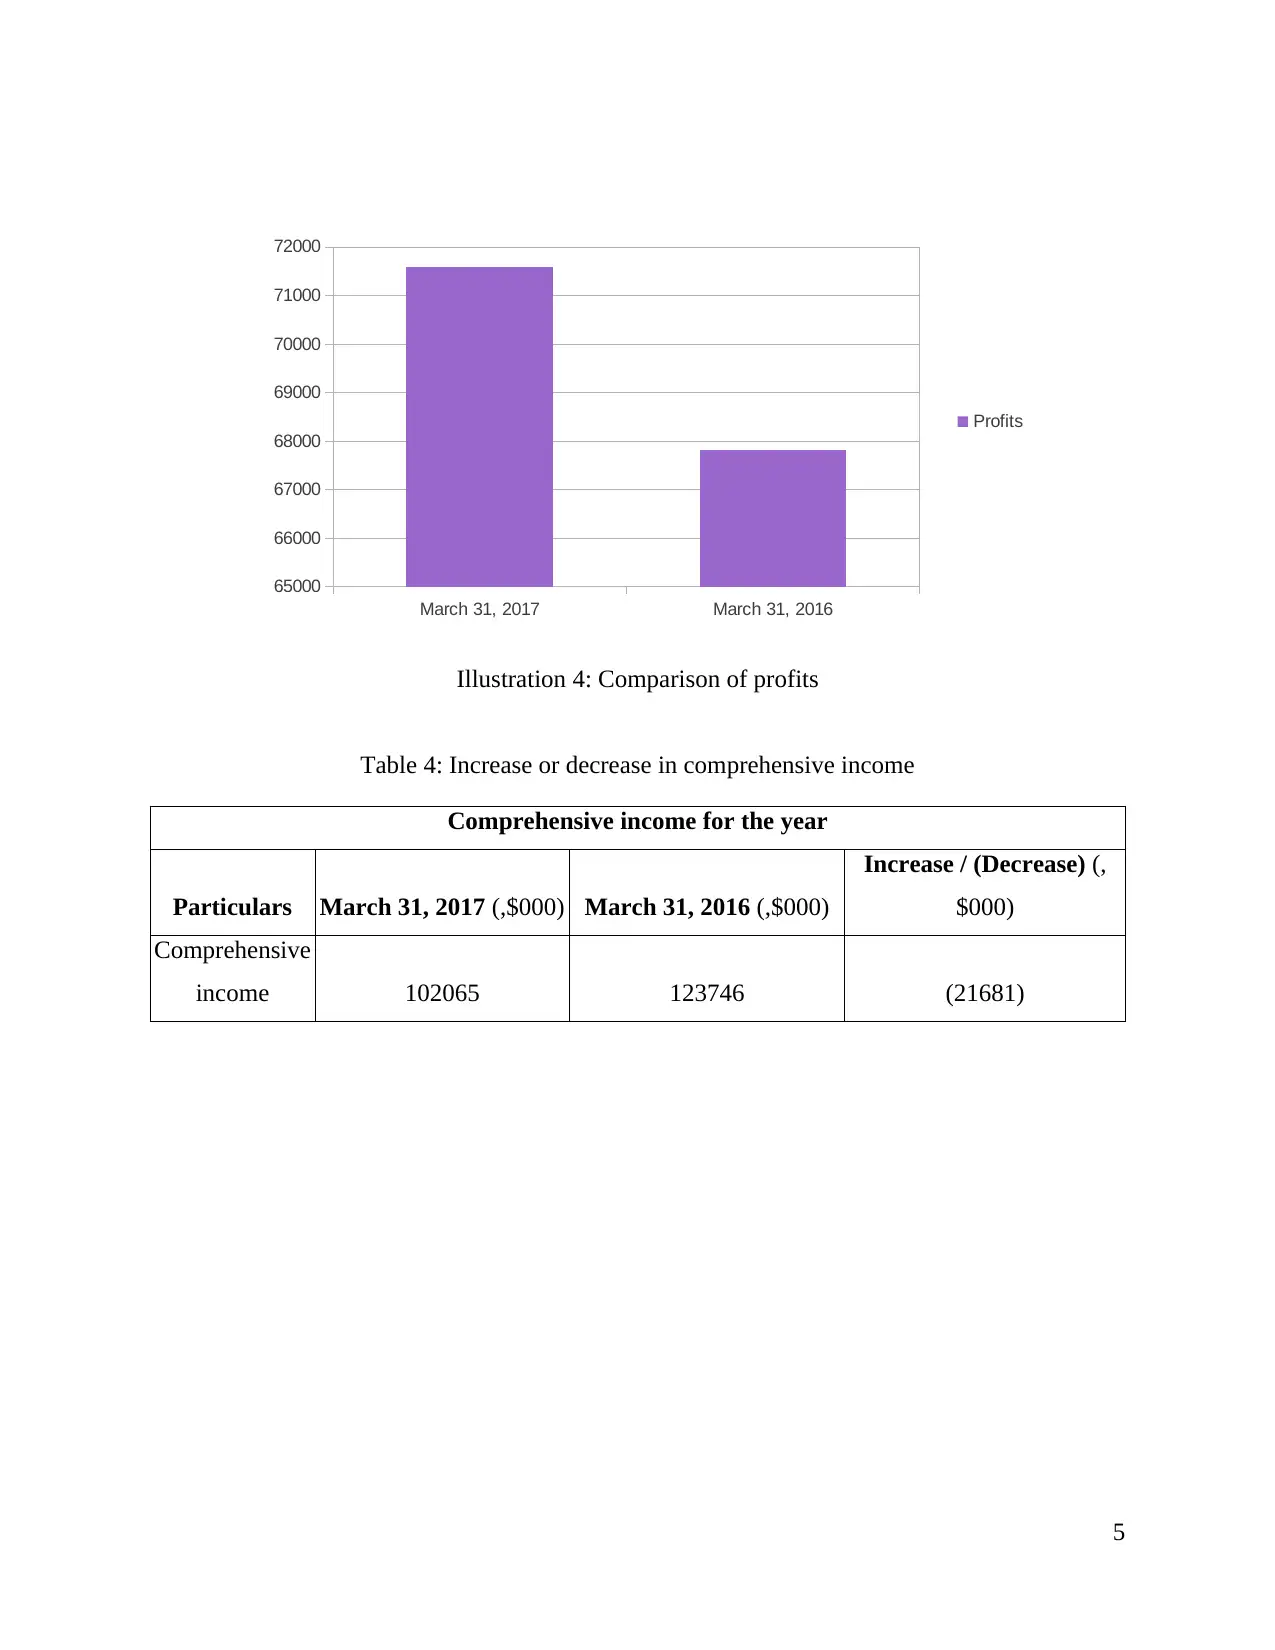
Table 4: Increase or decrease in comprehensive income
Comprehensive income for the year
Particulars March 31, 2017 (,$000) March 31, 2016 (,$000)
Increase / (Decrease) (,
$000)
Comprehensive
income 102065 123746 (21681)
5
March 31, 2017 March 31, 2016
65000
66000
67000
68000
69000
70000
71000
72000
Profits
Illustration 4: Comparison of profits
Comprehensive income for the year
Particulars March 31, 2017 (,$000) March 31, 2016 (,$000)
Increase / (Decrease) (,
$000)
Comprehensive
income 102065 123746 (21681)
5
March 31, 2017 March 31, 2016
65000
66000
67000
68000
69000
70000
71000
72000
Profits
Illustration 4: Comparison of profits
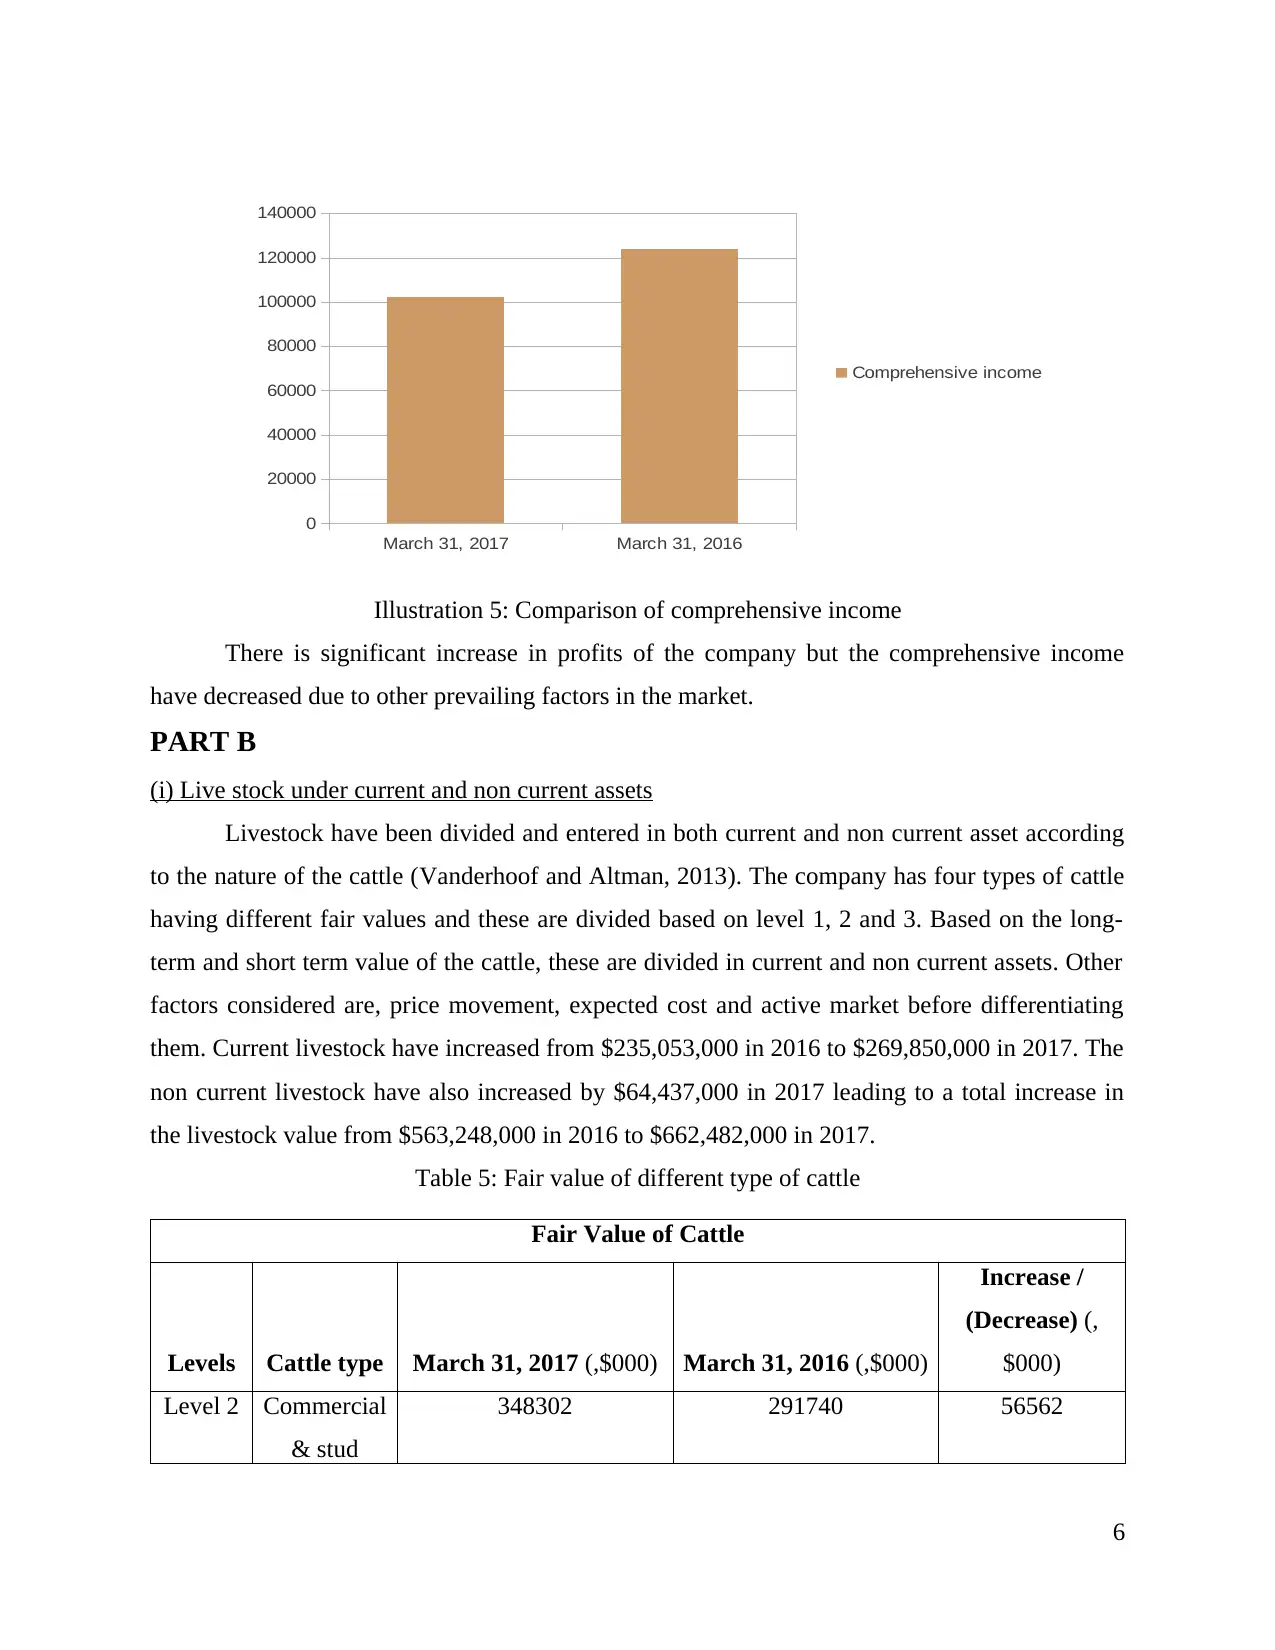
There is significant increase in profits of the company but the comprehensive income
have decreased due to other prevailing factors in the market.
PART B
(i) Live stock under current and non current assets
Livestock have been divided and entered in both current and non current asset according
to the nature of the cattle (Vanderhoof and Altman, 2013). The company has four types of cattle
having different fair values and these are divided based on level 1, 2 and 3. Based on the long-
term and short term value of the cattle, these are divided in current and non current assets. Other
factors considered are, price movement, expected cost and active market before differentiating
them. Current livestock have increased from $235,053,000 in 2016 to $269,850,000 in 2017. The
non current livestock have also increased by $64,437,000 in 2017 leading to a total increase in
the livestock value from $563,248,000 in 2016 to $662,482,000 in 2017.
Table 5: Fair value of different type of cattle
Fair Value of Cattle
Levels Cattle type March 31, 2017 (,$000) March 31, 2016 (,$000)
Increase /
(Decrease) (,
$000)
Level 2 Commercial
& stud
348302 291740 56562
6
March 31, 2017 March 31, 2016
0
20000
40000
60000
80000
100000
120000
140000
Comprehensive income
Illustration 5: Comparison of comprehensive income
⊘ This is a preview!⊘
Do you want full access?
Subscribe today to unlock all pages.
Trusted by 1+ million students worldwide
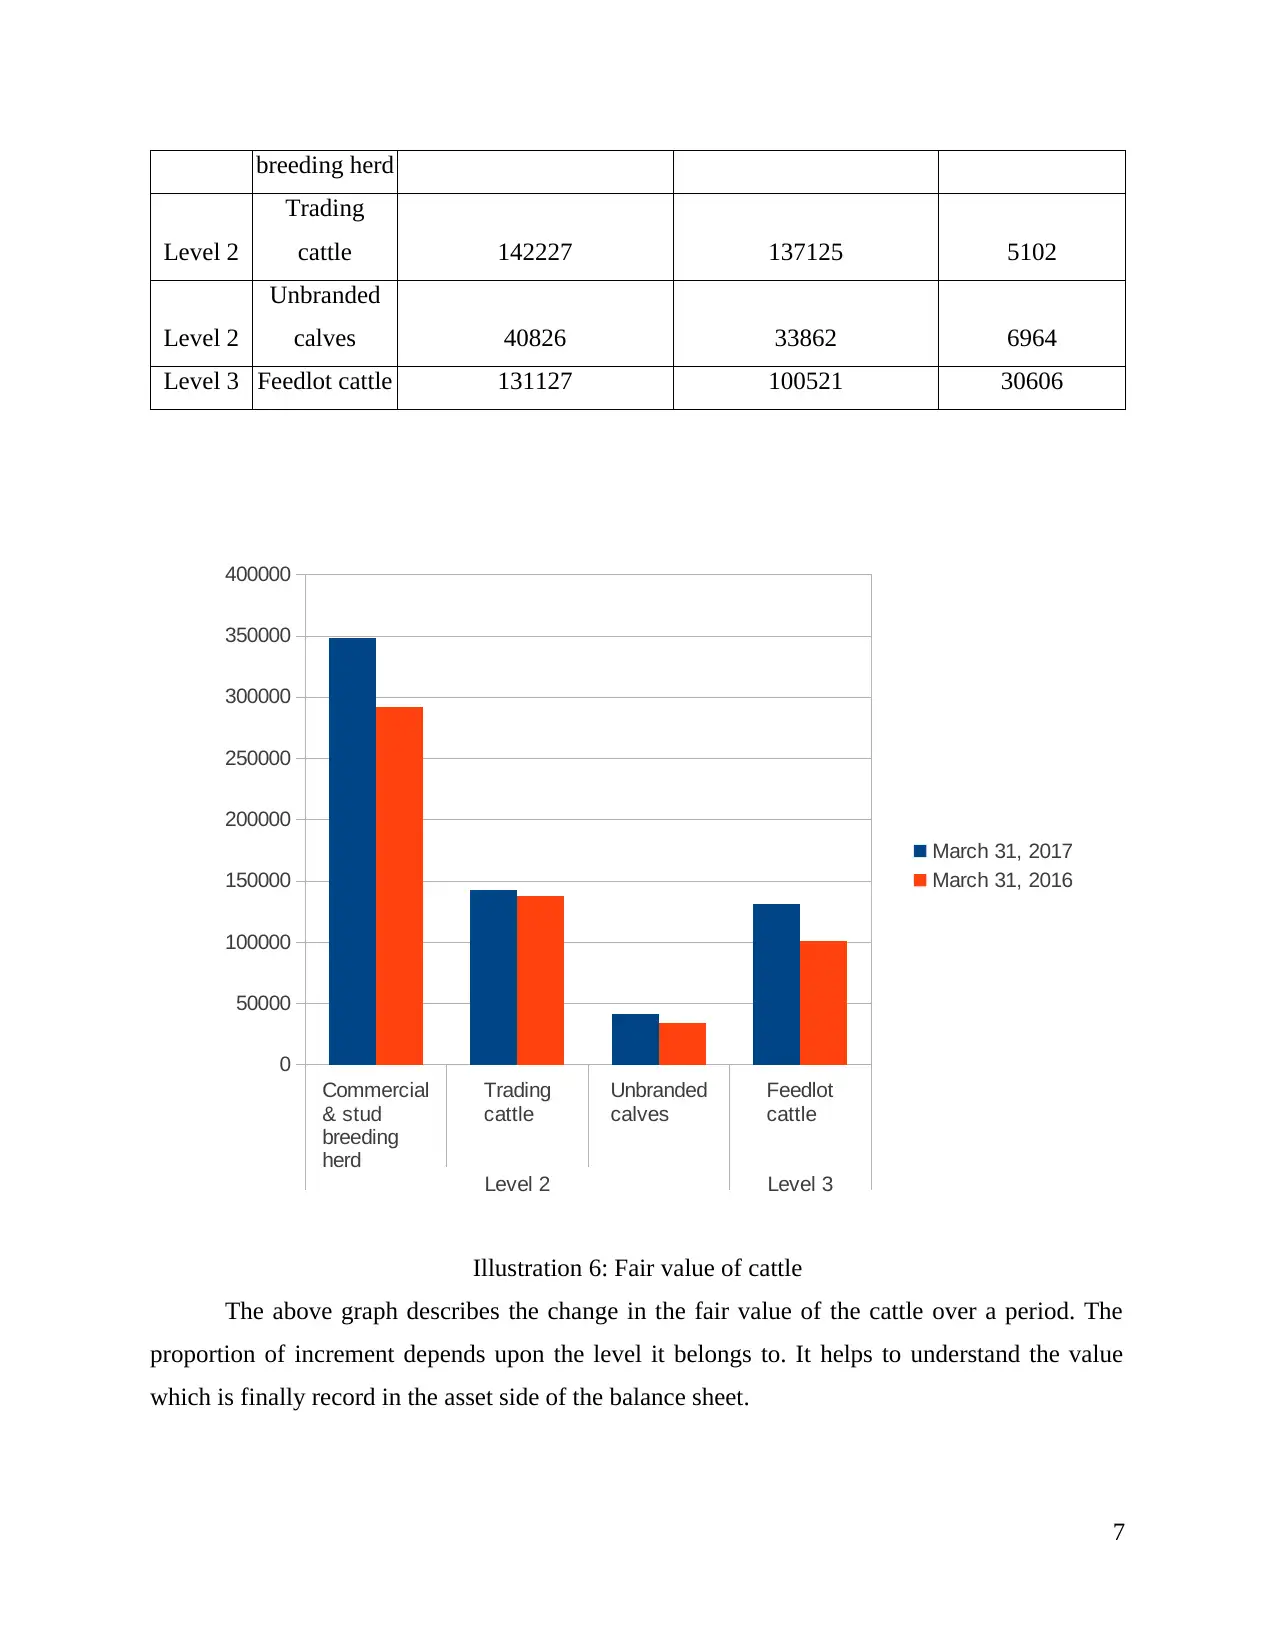
breeding herd
Level 2
Trading
cattle 142227 137125 5102
Level 2
Unbranded
calves 40826 33862 6964
Level 3 Feedlot cattle 131127 100521 30606
The above graph describes the change in the fair value of the cattle over a period. The
proportion of increment depends upon the level it belongs to. It helps to understand the value
which is finally record in the asset side of the balance sheet.
7
Commercial
& stud
breeding
herd
Trading
cattle
Unbranded
calves
Feedlot
cattle
Level 2 Level 3
0
50000
100000
150000
200000
250000
300000
350000
400000
March 31, 2017
March 31, 2016
Illustration 6: Fair value of cattle
Level 2
Trading
cattle 142227 137125 5102
Level 2
Unbranded
calves 40826 33862 6964
Level 3 Feedlot cattle 131127 100521 30606
The above graph describes the change in the fair value of the cattle over a period. The
proportion of increment depends upon the level it belongs to. It helps to understand the value
which is finally record in the asset side of the balance sheet.
7
Commercial
& stud
breeding
herd
Trading
cattle
Unbranded
calves
Feedlot
cattle
Level 2 Level 3
0
50000
100000
150000
200000
250000
300000
350000
400000
March 31, 2017
March 31, 2016
Illustration 6: Fair value of cattle
Paraphrase This Document
Need a fresh take? Get an instant paraphrase of this document with our AI Paraphraser
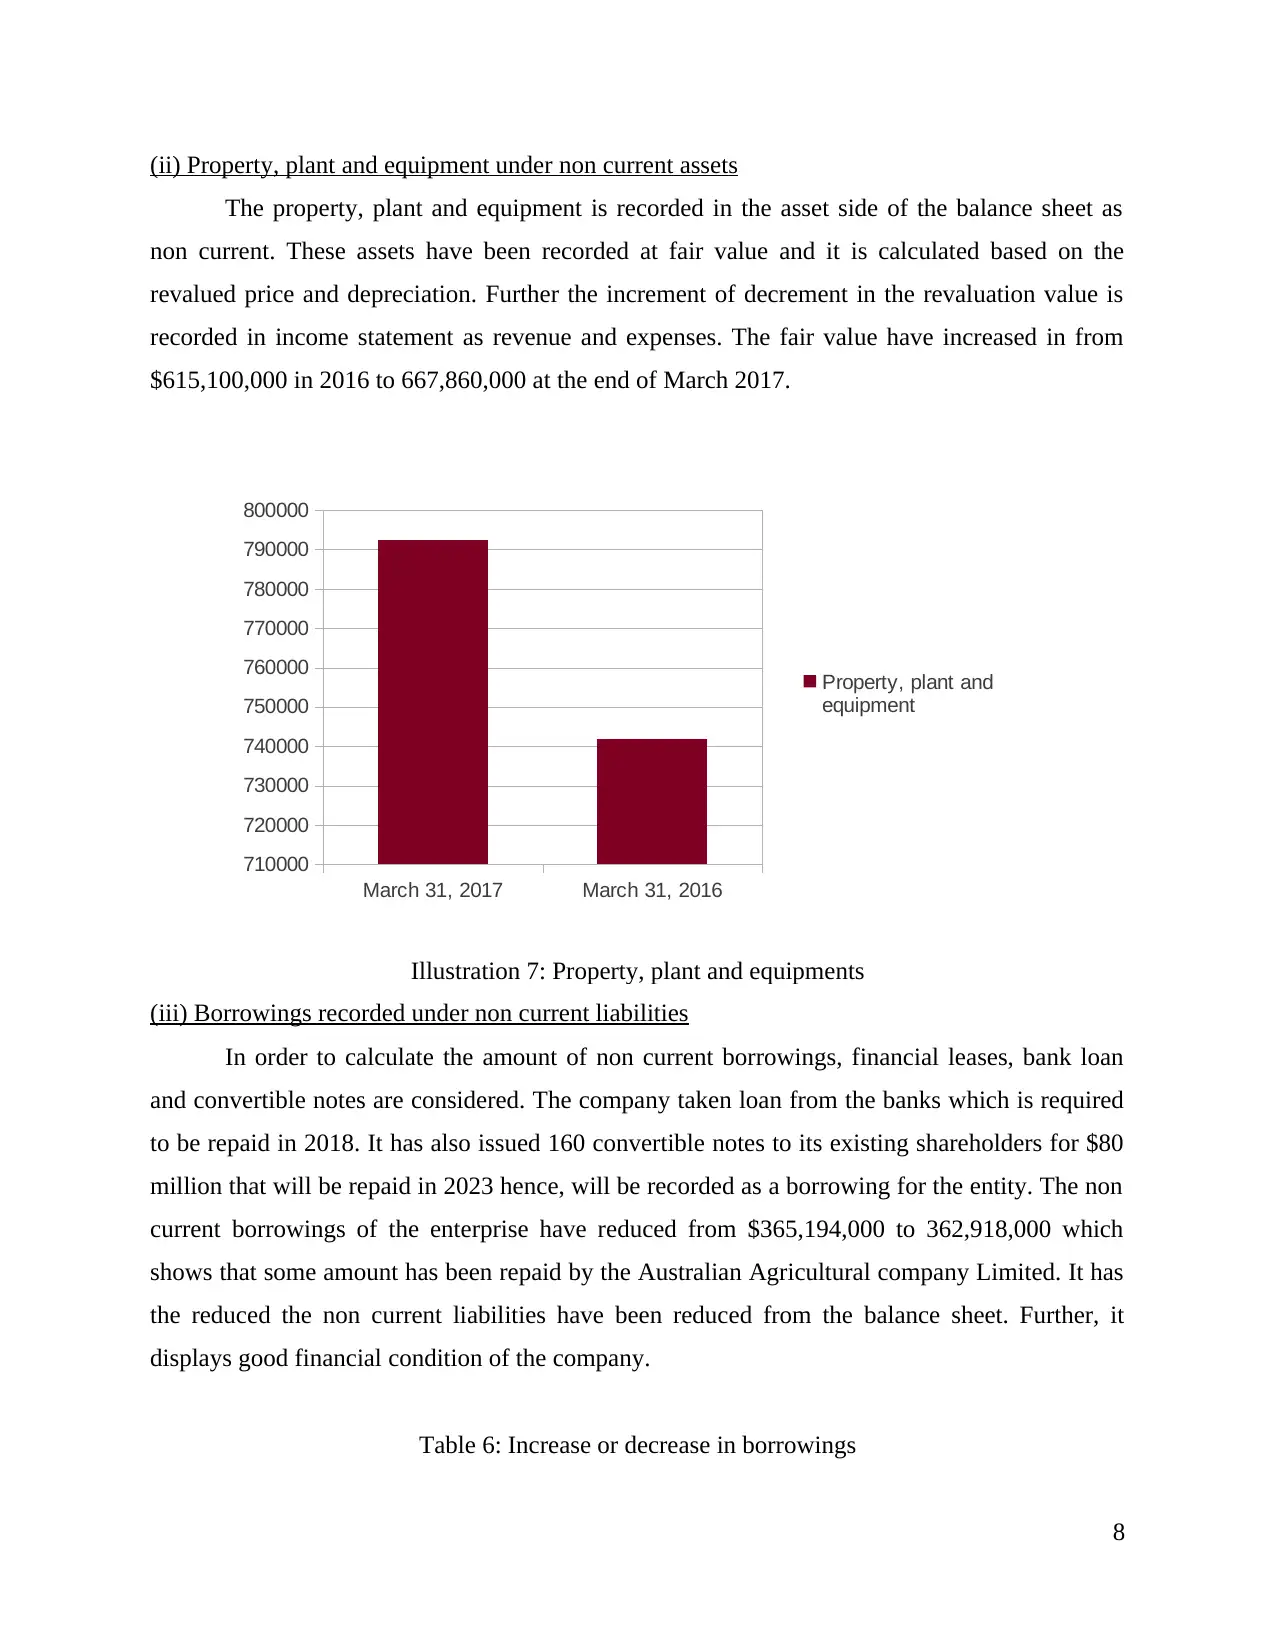
(ii) Property, plant and equipment under non current assets
The property, plant and equipment is recorded in the asset side of the balance sheet as
non current. These assets have been recorded at fair value and it is calculated based on the
revalued price and depreciation. Further the increment of decrement in the revaluation value is
recorded in income statement as revenue and expenses. The fair value have increased in from
$615,100,000 in 2016 to 667,860,000 at the end of March 2017.
(iii) Borrowings recorded under non current liabilities
In order to calculate the amount of non current borrowings, financial leases, bank loan
and convertible notes are considered. The company taken loan from the banks which is required
to be repaid in 2018. It has also issued 160 convertible notes to its existing shareholders for $80
million that will be repaid in 2023 hence, will be recorded as a borrowing for the entity. The non
current borrowings of the enterprise have reduced from $365,194,000 to 362,918,000 which
shows that some amount has been repaid by the Australian Agricultural company Limited. It has
the reduced the non current liabilities have been reduced from the balance sheet. Further, it
displays good financial condition of the company.
Table 6: Increase or decrease in borrowings
8
March 31, 2017 March 31, 2016
710000
720000
730000
740000
750000
760000
770000
780000
790000
800000
Property, plant and
equipment
Illustration 7: Property, plant and equipments
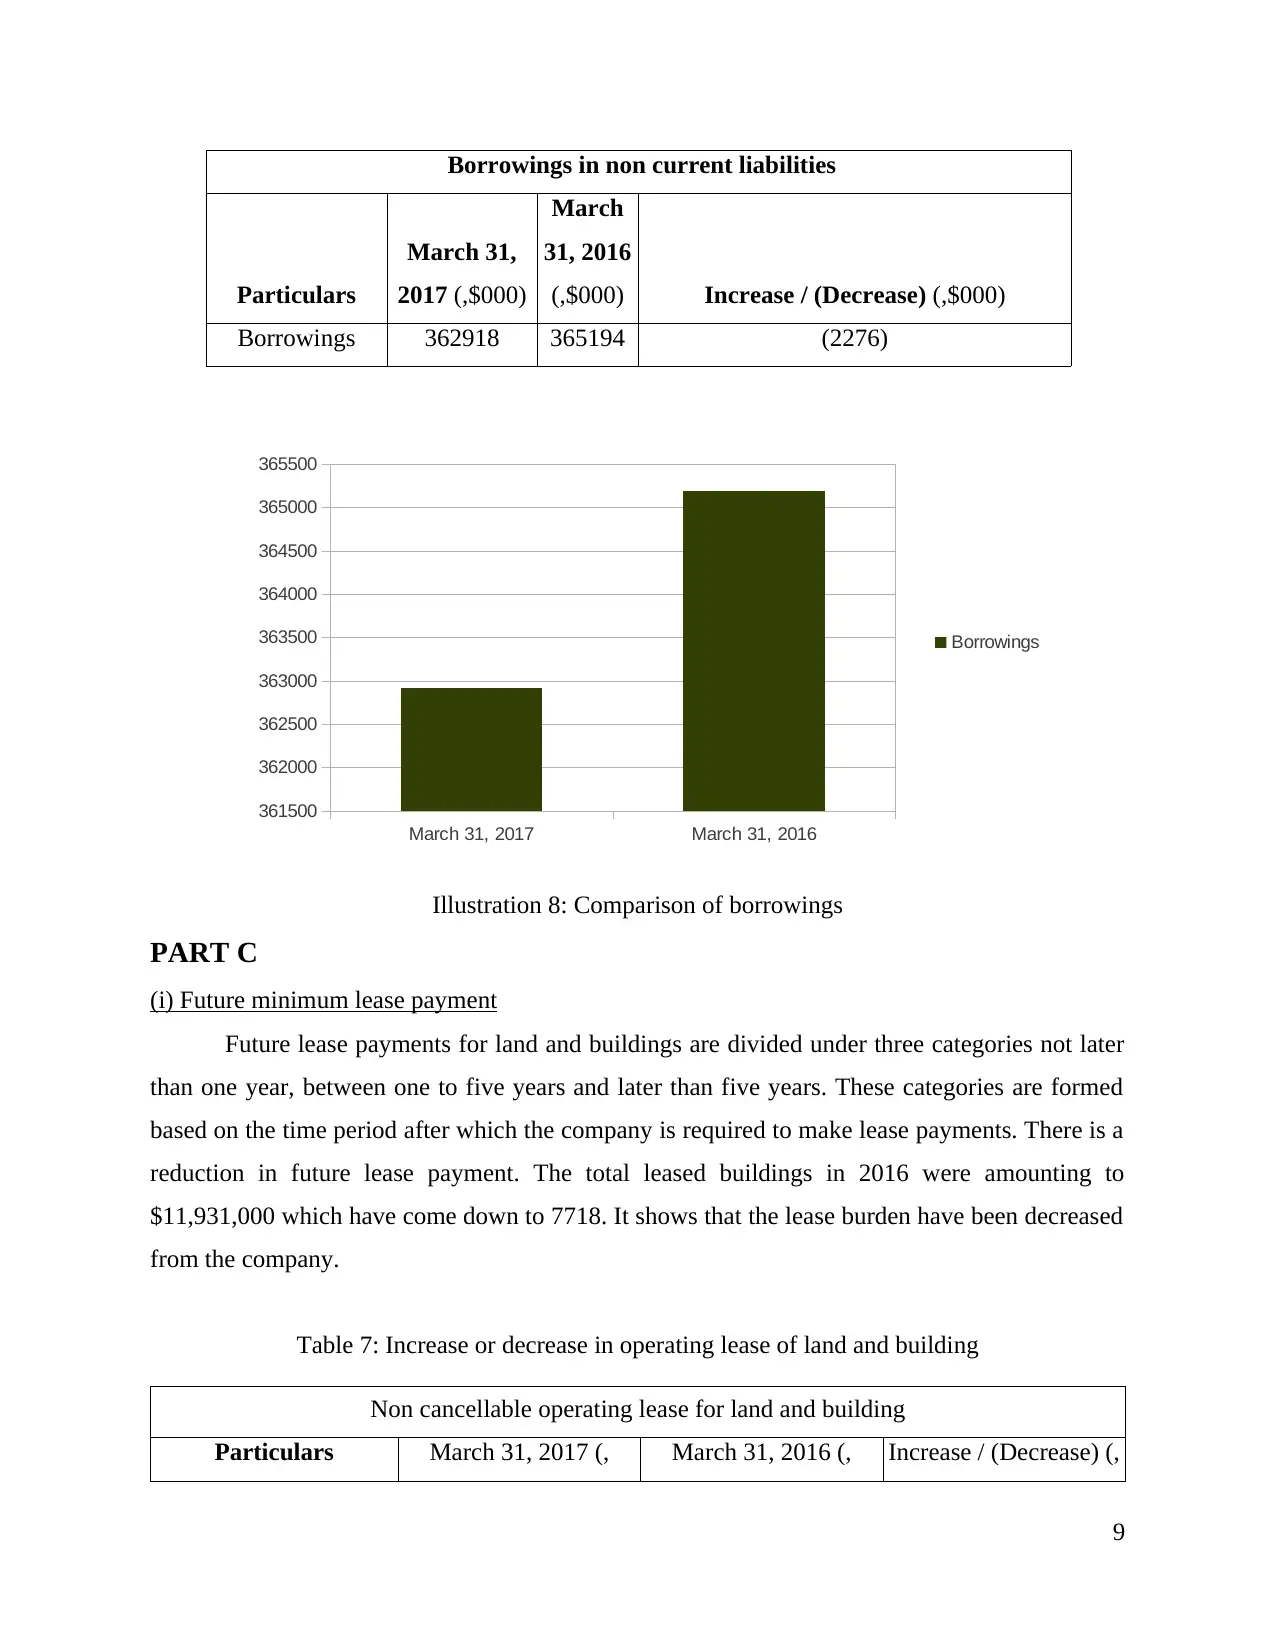
Borrowings in non current liabilities
Particulars
March 31,
2017 (,$000)
March
31, 2016
(,$000) Increase / (Decrease) (,$000)
Borrowings 362918 365194 (2276)
PART C
(i) Future minimum lease payment
Future lease payments for land and buildings are divided under three categories not later
than one year, between one to five years and later than five years. These categories are formed
based on the time period after which the company is required to make lease payments. There is a
reduction in future lease payment. The total leased buildings in 2016 were amounting to
$11,931,000 which have come down to 7718. It shows that the lease burden have been decreased
from the company.
Table 7: Increase or decrease in operating lease of land and building
Non cancellable operating lease for land and building
Particulars March 31, 2017 (, March 31, 2016 (, Increase / (Decrease) (,
9
March 31, 2017 March 31, 2016
361500
362000
362500
363000
363500
364000
364500
365000
365500
Borrowings
Illustration 8: Comparison of borrowings
⊘ This is a preview!⊘
Do you want full access?
Subscribe today to unlock all pages.
Trusted by 1+ million students worldwide
1 out of 15
Related Documents


Your All-in-One AI-Powered Toolkit for Academic Success.
+13062052269
info@desklib.com
Available 24*7 on WhatsApp / Email
![[object Object]](/_next/static/media/star-bottom.7253800d.svg)
Unlock your academic potential
Copyright © 2020–2026 A2Z Services. All Rights Reserved. Developed and managed by ZUCOL.