Aviation Industry Data Analysis: Statistical Modeling Assignment
VerifiedAdded on 2023/04/24
|15
|2790
|62
Report
AI Summary
This report analyzes Australian aviation industry data, focusing on flight patterns in and out of Australian cities. Dataset 1, a subset of international airlines data, is analyzed using descriptive statistics and hypothesis testing to determine flight volume trends. The analysis reveals a positive skew in flight numbers and a significant difference from a hypothesized average. Further analysis compares flight data across three Australian cities (Sydney, Brisbane, Melbourne) and three airlines (Singapore Airlines, Air New Zealand, Cathay Pacific Airways). Dataset 2, collected from KOI students, examines the relationship between gender, year of study, and preferred airport, using chi-square tests to assess associations. The report concludes with a discussion of the findings, offering insights into the aviation industry and student preferences.

Statistics
Student Name:
Student Number:
Course Instructor:
Date: 22nd January 2019
1 | P a g e
Student Name:
Student Number:
Course Instructor:
Date: 22nd January 2019
1 | P a g e
Paraphrase This Document
Need a fresh take? Get an instant paraphrase of this document with our AI Paraphraser

Table of Contents
1. Section 1: Introduction................................................................................................................3
2. Section 2: Analysis of single variable in Dataset 1.....................................................................4
Descriptive Statistics....................................................................................................................4
3. Section 3: Analysis of two variables in Dataset 1.......................................................................6
4. Section 4: Collect and analyze Dataset2......................................................................................8
Is there association between gender and preferred city of flight?................................................9
Is there association between year of study and preferred city of flight?....................................11
5. Section 5: Discussion & Conclusion.........................................................................................13
References......................................................................................................................................14
2 | P a g e

1. Section 1: Introduction
The Aviation industry supports Australian business and the travel industry and has an expected
yearly income of about $45 billion, adding close to $16 billion to the Australian economy in
2017 (Thomas, 2010). The business utilizes in excess of 88,000 individuals over its five primary
subsectors: International flights, Domestic business flights, general flying, airship cargo transport
and aeronautics support infrastructure (Thomas, 2010).
Dataset 1 is a primary data that has 1000 observations with a total of 14 variables. The variables
are either numerical or nominal. Some of the nominal variables in the dataset include In or Out,
Australian City, International City, Airline, Route, Port Country, Port Region, Service Country
and Service Region. Numerical variables include All Flights and Maximum Seats.
Dataset 2 is also a primary dataset that was collected among the KOI students. The data was
randomly selected in order to avoid bias that might arise. A total of 100 cases was used with
three variables. All the three variables were nominal variables (Hunter & Leahey, 2009). The
three variables include the gender of the student, the student’s year of study and the airport that
the student prefers to fly in and out of. The limitation of this data is the fact that the data was
collected from one institution and the sample size was to large enough to allow for generalization
(Fugard & Potts , 2015).
Table 1 below presents the description of variables in dataset 2;
Table 1: Description of the variables
Variable Description Values
In-Out Airlines comes in or goes out I for in and O for out
Australian City Which Australian city airline lands or Flies
out. Australian city names
International City Which international city airline lands or
flies out International city names
3 | P a g e
⊘ This is a preview!⊘
Do you want full access?
Subscribe today to unlock all pages.
Trusted by 1+ million students worldwide

Airlines Name of the airline Name of the airline
Route Via which airport airlines flies Short forms of various
airports
Port country Which country airlines belongs to Name of the country
Port Region Which region airline belongs to Region name
Service country Which country do the service Country name
Stops Number of stops airlines have 0,1,2
All Flights Number flight in or out in the month Number in integer
Max seat Number of maximum seats Number in integer
Year Which year Number in the year
Month Number Which month Number of the month
2. Section 2: Analysis of single variable in Dataset 1
Descriptive Statistics
As can be seen in table 2 below, the average number of all flights was found to be 24.53 with the
median number of all flights being 22 and the mode being 31 flights. The skewness value is 2.27
(a value greater than 1), this shows that the data is positively skewed (Skewed to the right) with a
longer tail to the right.
Table 2: Descriptive statistics for All Flights
Mean 24.53
Standard Error 0.63
Median 22.00
Mode 31.00
Standard Deviation 19.97
Sample Variance 398.94
Kurtosis 8.54
Skewness 2.27
Range 150
Minimum 1
Maximum 151
Sum 24526
Count 1000
4 | P a g e
Paraphrase This Document
Need a fresh take? Get an instant paraphrase of this document with our AI Paraphraser

The histogram presented below further shows that the distribution of the data is not normal but is
rather skewed to the right (positively skewed). This is based on the fact that it has a longer tail to
the right.
Figure 1: Histogram for the all flights (In and Out)
Next we sought to test whether the average number of flights came in and flew out to Australia
in a month between September 2003 and September 2018 was more than 30. The hypothesis that
was tested is as follows;
H0 : μ=30
H A : μ>30
To test the hypothesis, a one-sample t-test was performed at 5% level of significance. Results are
given below;
5 | P a g e

Table 2: t-Test: Two-Sample Assuming Equal Variances
All Flights Test
Mean 24.526 30
Variance 398.9443 0
Observations 1000 1000
Pooled Variance 199.4721
Hypothesized Mean Difference 0
df 1998
t Stat -8.6666
P(T<=t) one-tail 4.51E-18
t Critical one-tail 1.645617
P(T<=t) two-tail 9.03E-18
t Critical two-tail 1.961152
From the above results, we can see that the average number of flights in and out of Australia
were 24.53 (SD = 19.97). The p-value is 0.000 (a value less than 5% level of significance), we
therefore reject the null hypothesis that the average number of flights in and out of Australia
were equivalent to 30 (Fay & Proschan, 2010). However since the number are also less than 30
we can conclude that the average number of flights in and out of Australia are significantly less
than 30.
3. Section 3: Analysis of two variables in Dataset 1
Numerical summary of all flights in three Australian cities
Table 3: Numerical summary for all flights in three cities
City Average all flights
(M)
Standard deviation of
all flights (SD)
Brisbane 23.06 19.50
Melbourne 24.12 18.07
Sydney 26.94 22.47
As can be seen in the above table, Sydney still has highest number of flights (M = 26.94, SD =
22.47). However, it is clear that the competition is quite tight since the difference between the
average number of all flights does not significantly differ across the three cities. The average for
6 | P a g e
⊘ This is a preview!⊘
Do you want full access?
Subscribe today to unlock all pages.
Trusted by 1+ million students worldwide

the Brisbane was 23.06 (SD = 19.50) while that of Melbourne was 24.12 (SD = 18.07). The same
results are presented in figure below;
Figure 2: Bar chart of mean all flights for three cities
Numerical summary of all flights in three Australian cities
Table 4: Numerical summary for all flights in three airlines
Airline Average all flights
(M)
Standard deviation of
all flights (SD)
Singapore Airlines 79.44 38.58
Air New Zealand 30.70 30.22
Cathay Pacific Airways 26.93 26.33
As can be seen in the above table, Singapore has highest number of flights (M = 79.44, SD =
38.58). The average number of flights for the Singapore airlines is so high that it is more than
twice the average number of Air New Zealand (M = 30.70, SD = 30.22) and more than three
times the average for the Cathy Pacifica Airways (M = 26.93, SD = 26.33).
7 | P a g e
Paraphrase This Document
Need a fresh take? Get an instant paraphrase of this document with our AI Paraphraser

Figure 3: Bar chart of mean all flights for three airlines
4. Section 4: Collect and analyze Dataset2
In this section, we sought to analyze the data on dataset2 which was also a primary data collected
among the KOI students (Tofallis, 2009).
Figure 4: Pie chart of student’s gender
As can be seen, majority of the participants were the male students (54%, n = 54) while the
female participants were represented by 46% (n = 46).
In terms of year of study, majority of the respondents were either in their first year of study or
their final (fourth) year of study (27%, n = 27). Second year students were represented by 26% (n
= 26) while third year students were represented by 20% (n = 20).
8 | P a g e
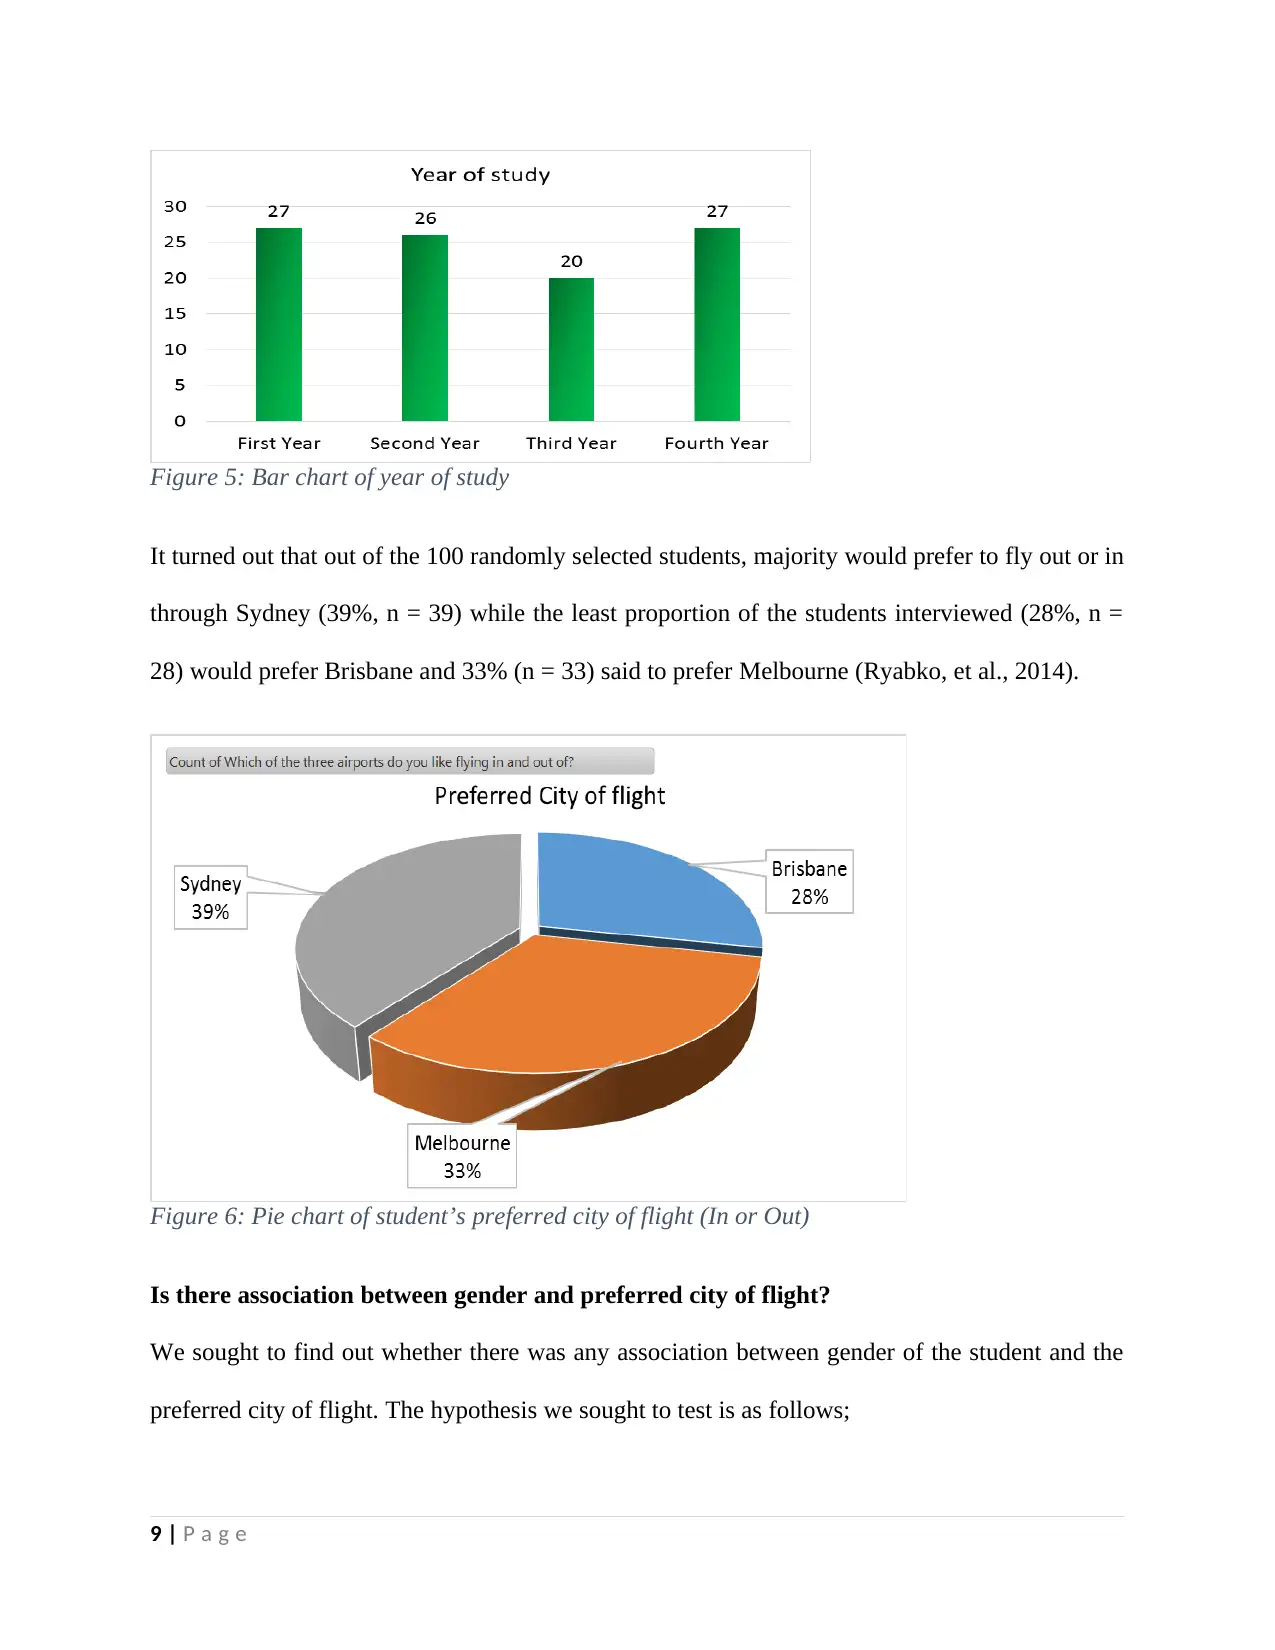
Figure 5: Bar chart of year of study
It turned out that out of the 100 randomly selected students, majority would prefer to fly out or in
through Sydney (39%, n = 39) while the least proportion of the students interviewed (28%, n =
28) would prefer Brisbane and 33% (n = 33) said to prefer Melbourne (Ryabko, et al., 2014).
Figure 6: Pie chart of student’s preferred city of flight (In or Out)
Is there association between gender and preferred city of flight?
We sought to find out whether there was any association between gender of the student and the
preferred city of flight. The hypothesis we sought to test is as follows;
9 | P a g e
⊘ This is a preview!⊘
Do you want full access?
Subscribe today to unlock all pages.
Trusted by 1+ million students worldwide

H0: There is no significant association between gender of the student and the preferred city of
flight
HA: There is significant association between gender of the student and the preferred city of flight
To test this, we used Chi-Square test of association at 5% level and the results are presented
below;
Table 5: Which of the three airports do you like flying in and out of? * Gender Cross tabulation
Gender Total
Female Male
Which of the three airports
do you like flying in and out
of?
Brisbane Count 18 10 28
% within Gender 39.1% 18.5% 28.0%
Melbourne Count 14 19 33
% within Gender 30.4% 35.2% 33.0%
Sydney Count 14 25 39
% within Gender 30.4% 46.3% 39.0%
Total Count 46 54 100
% within Gender 100.0% 100.0% 100.0%
Table 6: Chi-Square Tests
Value df Asymp. Sig. (2-
sided)
Pearson Chi-Square 5.541a 2 .063
Likelihood Ratio 5.583 2 .061
N of Valid Cases 100
a. 0 cells (0.0%) have expected count less than 5. The minimum
expected count is 12.88.
Results of the Chi-Square test showed that there is no significant association between gender of
the student and the preferred city of flight ( χ2 ( 2 , N =100 )=5.541 , p=.063). However, a large
10 | P a g e
Paraphrase This Document
Need a fresh take? Get an instant paraphrase of this document with our AI Paraphraser

proportion of the male students interviewed preferred Melbourne and Sydney while majority of
the female students said to prefer Brisbane (Fugard & Potts , 2015).
Figure 7: Comparative bar chart of preferred airport of flight and gender
Is there association between year of study and preferred city of flight?
Next, we sought to find out whether there was any association between the student’s year of
study and their preferred city of flight. The hypothesis we sought to test is as follows;
H0: There is no significant association between the student’s year of study and their preferred
city of flight.
HA: There is significant association between the student’s year of study and their preferred city of
flight.
To test this, we used Chi-Square test of association at 5% level and the results are presented
below;
11 | P a g e

Table 7: Year Of study * Which of the three airports do you like flying in and out of? Cross tabulation
Which of the three airports do you like flying
in and out of?
Total
Brisbane Melbourne Sydney
Year Of
study
First Year
Count 11 9 7 27
% within Preferred Airport 39.3% 27.3% 17.9% 27.0%
Fourth Year
Count 7 7 13 27
% within Preferred Airport 25.0% 21.2% 33.3% 27.0%
Second Year
Count 7 8 11 26
% within Preferred Airport 25.0% 24.2% 28.2% 26.0%
Third Year
Count 3 9 8 20
% within Preferred Airport 10.7% 27.3% 20.5% 20.0%
Total
Count 28 33 39 100
% within Preferred Airport 100.0% 100.0% 100.0% 100.0%
Table 8: Chi-Square Tests
Value df Asymp. Sig. (2-
sided)
Pearson Chi-Square 5.988a 6 .425
Likelihood Ratio 6.104 6 .412
N of Valid Cases 100
a. 0 cells (0.0%) have expected count less than 5. The minimum
expected count is 5.60.
Just like the case of gender and preferred city, the results of this test (the Chi-Square test)
showed that there is no significant association between the student’s year of study and their
preferred city of flight ( χ2 ( 6 , N =100 ) =5.988 , p=.425). However, a large proportion of those
who preferred Brisbane were in their first year of study while majority of those who preferred
12 | P a g e
⊘ This is a preview!⊘
Do you want full access?
Subscribe today to unlock all pages.
Trusted by 1+ million students worldwide
1 out of 15
Related Documents


Your All-in-One AI-Powered Toolkit for Academic Success.
+13062052269
info@desklib.com
Available 24*7 on WhatsApp / Email
![[object Object]](/_next/static/media/star-bottom.7253800d.svg)
Unlock your academic potential
Copyright © 2020–2026 A2Z Services. All Rights Reserved. Developed and managed by ZUCOL.