Climate Change Impacts and Adaptation: Australian Cities Report
VerifiedAdded on 2020/02/18
|19
|2904
|67
Report
AI Summary
This report provides a comparative analysis of climate change in three major Australian cities: Melbourne, Sydney, and Brisbane. It begins with an introduction outlining the report's purpose: to develop a climate change risk assessment and adaptation plan by examining the climate changes and their projected impacts. The report compares the climate conditions of the three cities, including temperature, rainfall, humidity, and other relevant factors. It then delves into the impacts of climate change on Melbourne, focusing on rising sea levels, changes in temperature and rainfall, and the effects on water and food supplies, human health, and the ecosystem. The report concludes by summarizing the key findings and emphasizing the diverse climate conditions and the broad range of impacts. This report is an example of the type of academic work available on Desklib, a platform offering past papers and solved assignments for students.
Sustainability and Climate Change 1
Principles of Sustainability and Climate Change
Principles of Sustainability and Climate Change
Paraphrase This Document
Need a fresh take? Get an instant paraphrase of this document with our AI Paraphraser
Sustainability and Climate Change 2
Contents
Introduction.................................................................................................................................................3
Sustainability and Climate Changes in the Australian cities (Melbourne, Sydney, and Brisbane)...............3
Table for Comparison of Climate Changes in Melbourne, Brisbane, and Sydney cities..........................6
Impacts of Climate Changes on Home City, Melbourne.........................................................................9
Conclusion.................................................................................................................................................13
References.................................................................................................................................................14
Appendices-...............................................................................................................................................16
Appendix 1- Melbourne Climate Conditions..........................................................................................16
Appendix 2- Climate Changes in Brisbane.............................................................................................17
Appendix 3- Climate Changes in Sydney................................................................................................18
Sustainability and Climate Change 3
Introduction
The purpose of this report is to develop the Climate Change Risk Assessment or Adaptation Plan
by analyzing the climate changes in the capital cities in the Australian country that will assist in
the climate change projections in the further or referencing years (Year 2030, 2050, and 2100).
This will also analyze the impact of the climate changes, such as socio-cultural risks, change in
sea level, temperature, rainfall, atmosphere, humidity, wind, and precipitation on the food
supplies, water supply, public utilities, refugee movements, mitigate activities, human lives and
sustainability for the further consideration in the development pan. For this report, the climate
conditions in three Australian cities, Melbourne, Sydney, and Brisbane will be compared with
each other (Brown and Siri, 2012).
Sustainability and Climate Changes in the Australian cities (Melbourne, Sydney, and
Brisbane)
Melbourne is the second largest Australian city and capital state of Victoria with 4.4 million
population base. Melbourne city has a temperate oceanic climate with changeable weather
conditions due to the distant geographic location in Melbourne City. The differential climate
conditions is pronounced in the spring, summer months and may cause for the cold fronts
responsible different weather conditions, such as heavy rain, minor temperature drops, gales,
thunderstorms, and hails. Melbourne experiences warm hot summers with little humidity in the
summer season, spring and autumn seasons are mild and balmy, and winter cools as well as
thunderstorms and rainfalls at the end of hot summer falls (Introgovernmental Panel on Climate
Change, 2007).
⊘ This is a preview!⊘
Do you want full access?
Subscribe today to unlock all pages.
Trusted by 1+ million students worldwide
Sustainability and Climate Change 4
Melbourne accounts for the average temperature between 14.0°C - 25.3°C (30°C may be top or
the highest temperature), dry days and occasional hot spells in summer season (December-
February). In the Autumn season (March-May), the average temperature ranges from 10.9°C –
20.3°C, fine sunny days and possibility of the extended periods of light winds. In the Winter
season (June-August) the average temperature is ranged from 6.5°C - 14.2°C with some snow
falls in the North-East region of Victoria and cold and cloudy weather with cold fronts in nights,
and low possibility of heavy rain in this time period. The Spring season (September- November)
accounts for average temperature 9.6°C - 19.6°C, as this may be the most variable season of the
year with calm and sunny days to rain fall, cold and winds. Melbourne accounts for only 50% or
less of the average rainfall of either Sydney or Brisbane (Miller and Spoolman, 2011). The
average annual rainfall in Melbourne is around 864 mm that is less from Sydney (1220mm) and
Brisbane cities (1018mm). In Melbourne, January and February are the hottest months, June and
July the coldest months, and October the wettest month year with heavy rain falls this month.
While, in contrary to this, Sydney is the largest Australian capital city located in New South
Wales State with 4.8 million population base. Sydney is one of the greatest tourism destinations
in the world due to its moderate climate, average rainfall, and bright blue and sunny skies.
Sydney enjoys a temperate, abundant sunshine, humid climate and pleasant weather conditions
as the sunshine is well spread throughout the year. The climate of Sydney includes hot summers
with humidity, mild winters, and driest spring days. In Sydney, the average annual temperature
ranges from 18.6°C -25.8°C during the summer season (December to February) with 65%
average humidity, in Autumn season (March-May) 14.6-22.2°C, in winter (June-August), 8.8-
Paraphrase This Document
Need a fresh take? Get an instant paraphrase of this document with our AI Paraphraser
Sustainability and Climate Change 5
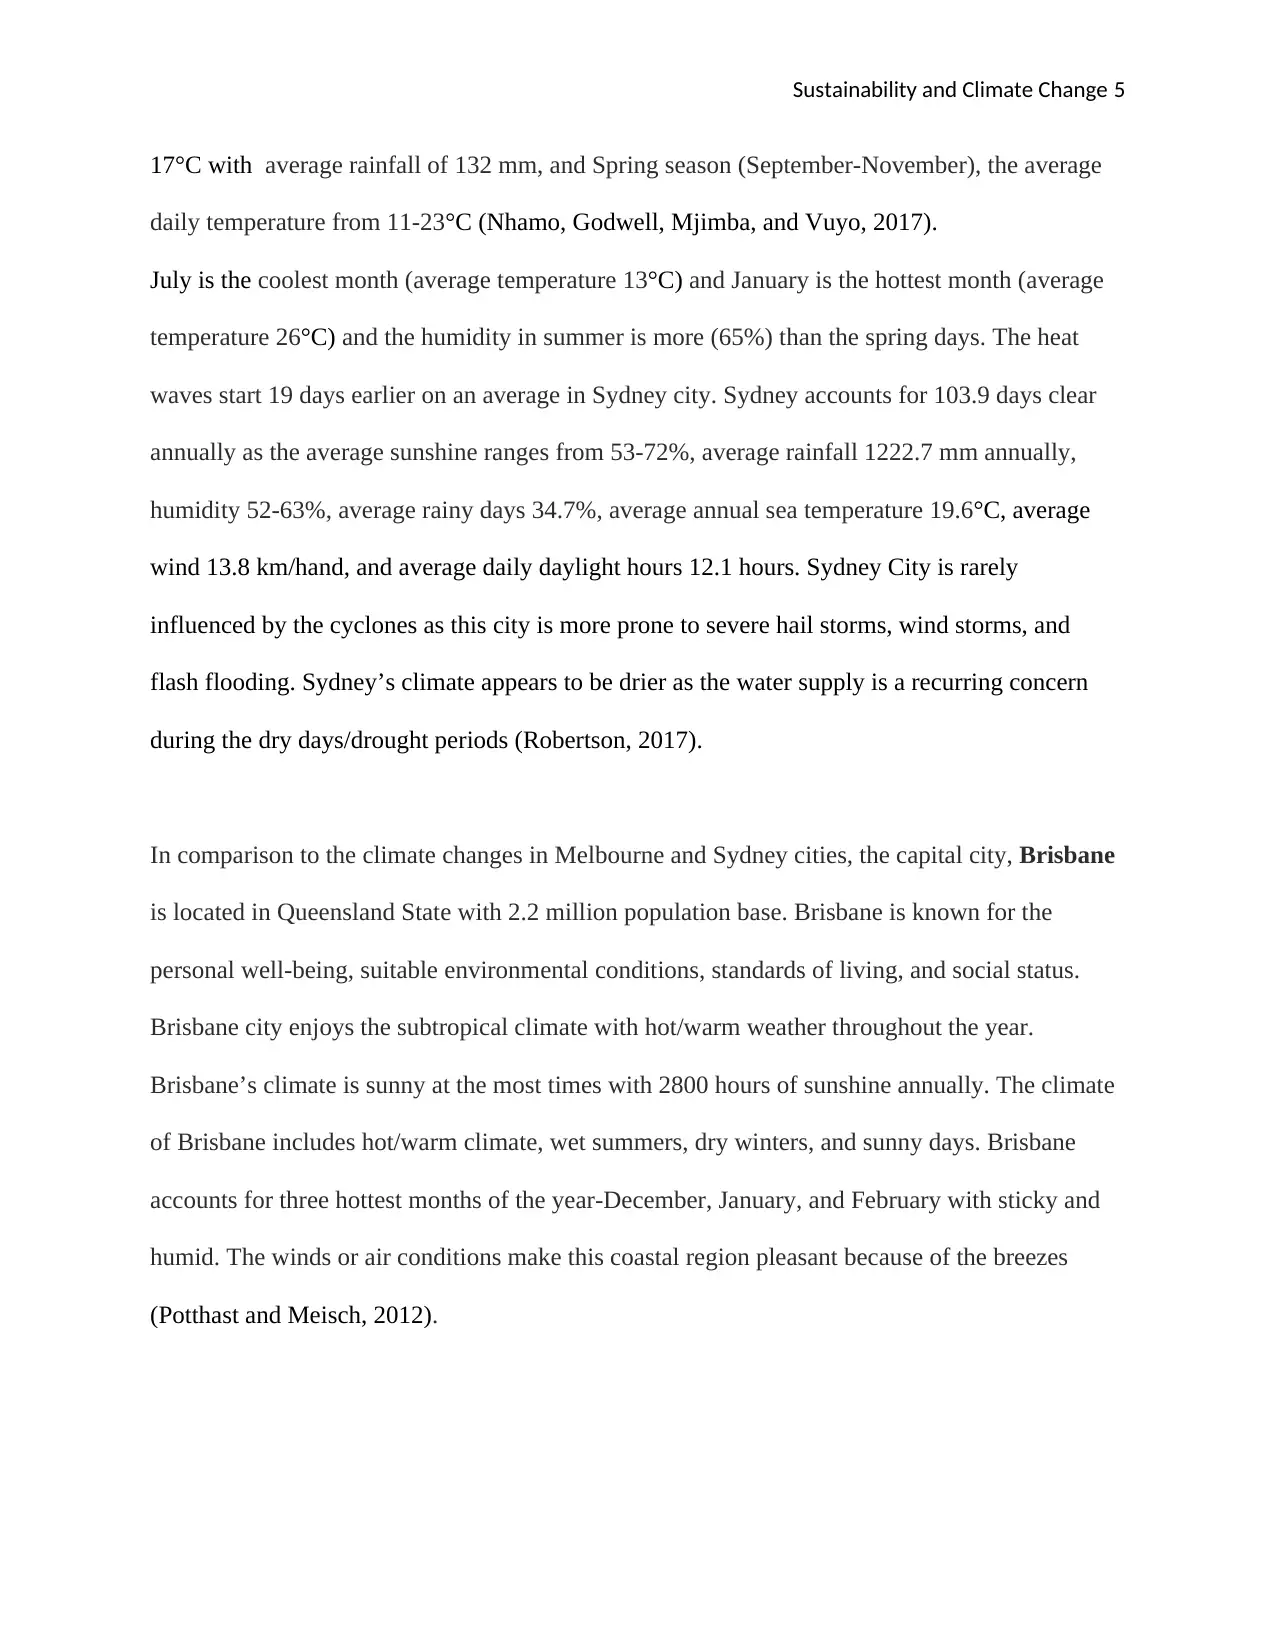
17°C with average rainfall of 132 mm, and Spring season (September-November), the average
daily temperature from 11-23°C (Nhamo, Godwell, Mjimba, and Vuyo, 2017).
July is the coolest month (average temperature 13°C) and January is the hottest month (average
temperature 26°C) and the humidity in summer is more (65%) than the spring days. The heat
waves start 19 days earlier on an average in Sydney city. Sydney accounts for 103.9 days clear
annually as the average sunshine ranges from 53-72%, average rainfall 1222.7 mm annually,
humidity 52-63%, average rainy days 34.7%, average annual sea temperature 19.6°C, average
wind 13.8 km/hand, and average daily daylight hours 12.1 hours. Sydney City is rarely
influenced by the cyclones as this city is more prone to severe hail storms, wind storms, and
flash flooding. Sydney’s climate appears to be drier as the water supply is a recurring concern
during the dry days/drought periods (Robertson, 2017).
In comparison to the climate changes in Melbourne and Sydney cities, the capital city, Brisbane
is located in Queensland State with 2.2 million population base. Brisbane is known for the
personal well-being, suitable environmental conditions, standards of living, and social status.
Brisbane city enjoys the subtropical climate with hot/warm weather throughout the year.
Brisbane’s climate is sunny at the most times with 2800 hours of sunshine annually. The climate
of Brisbane includes hot/warm climate, wet summers, dry winters, and sunny days. Brisbane
accounts for three hottest months of the year-December, January, and February with sticky and
humid. The winds or air conditions make this coastal region pleasant because of the breezes
(Potthast and Meisch, 2012).
Sustainability and Climate Change 6
In Brisbane, the average temperature in summer season (December-February) ranges from 21-
29.8 °C with the highest rainfalls in summer (average 426.6 mm) that can also cause for the
occasion floods and thunderstorms. The average temperature in Autumn (March-May) 15-25°C
with low humidity and less rain, in Winter (June-August) and 11-21°C with crispy nights and
early morning , and 15-25°C in summer with cool sea breezes. Brisbane city accounts for the
average rainfall 1020 mm, average sunny days 122 d, average annual humidity 58%, and average
daily sunshine 13 hours (Owley and Herokawa, 2015). The humidity ranges from 50% to 65%
with the most humidity in summer (65% in February) and less humidity in summer (the least
humid in September 50%). Brisbane has the longest hours of sunshine on the daily basis (4:50
a.m.-6:40 p.m.).
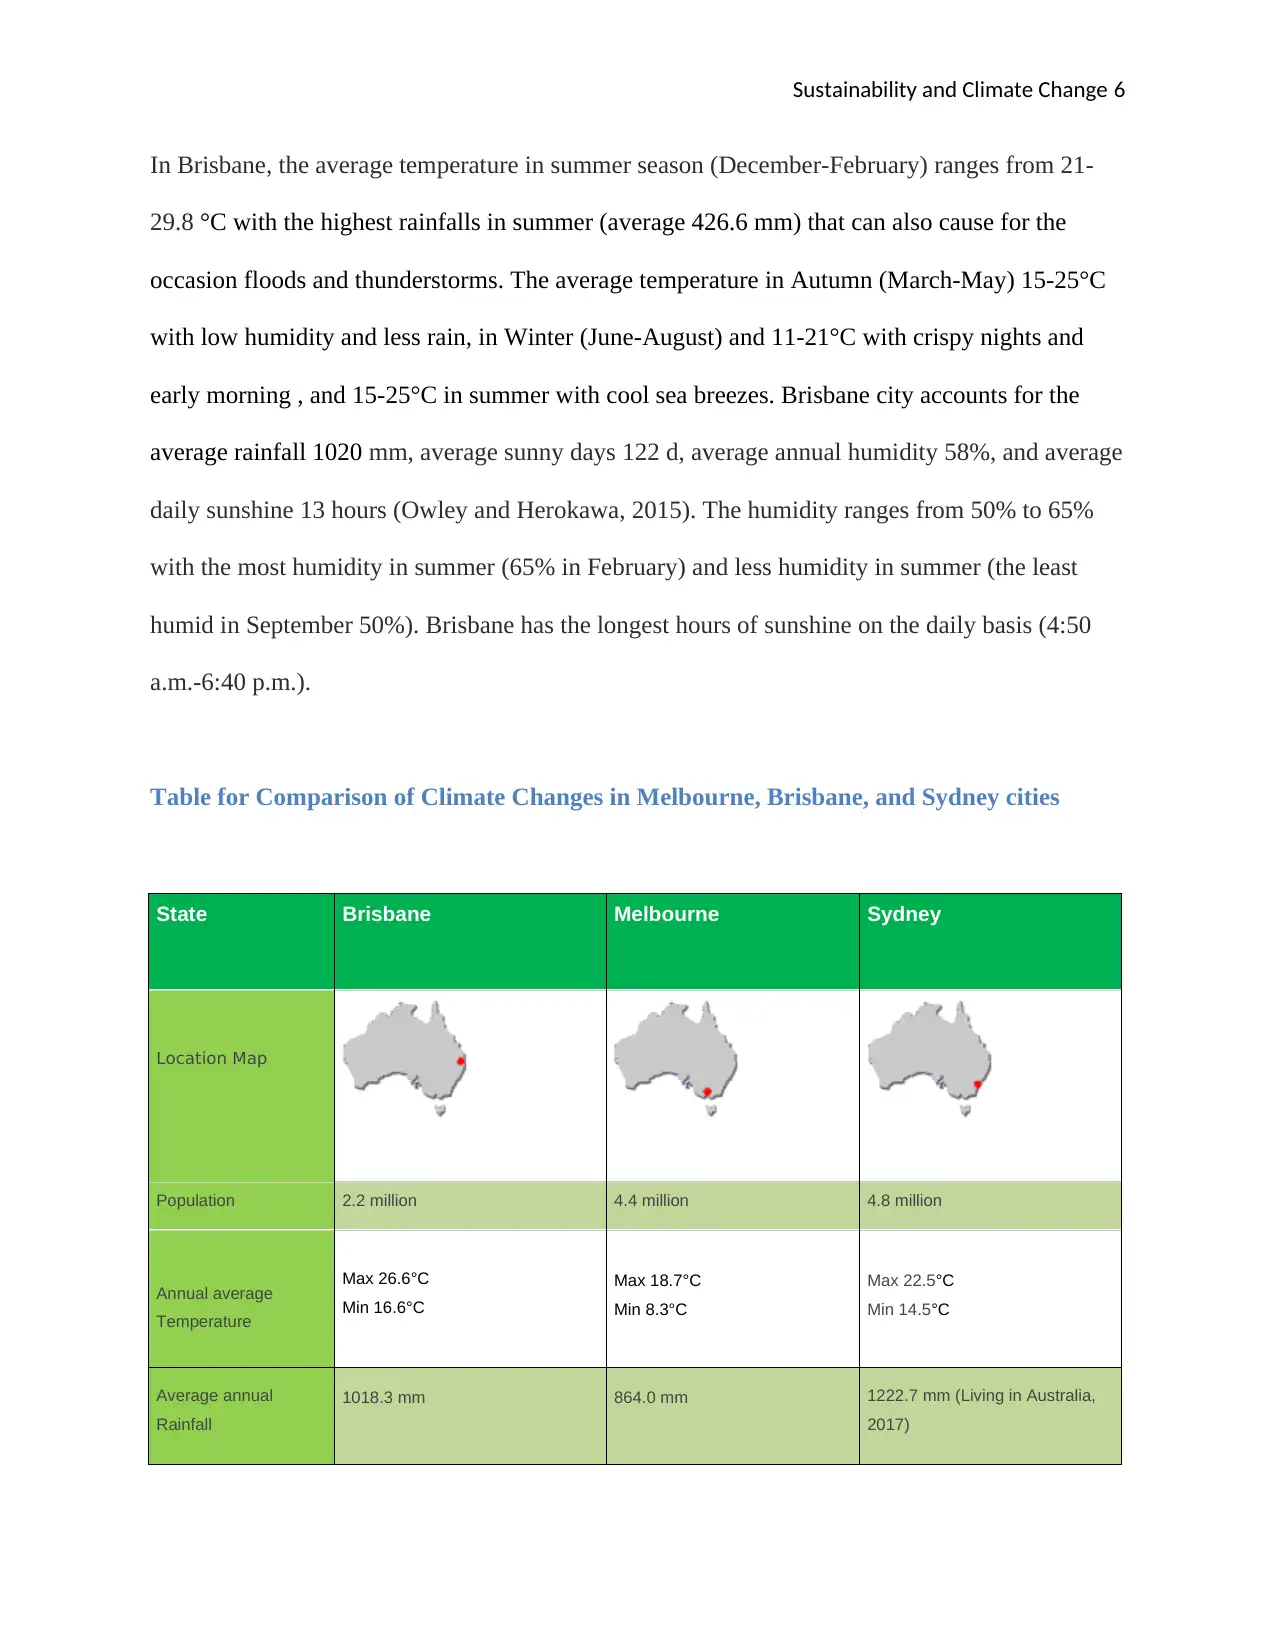
Table for Comparison of Climate Changes in Melbourne, Brisbane, and Sydney cities
State Brisbane Melbourne Sydney
Location Map
Population 2.2 million 4.4 million 4.8 million
Annual average
Temperature
Max 26.6°C
Min 16.6°C
Max 18.7°C
Min 8.3°C
Max 22.5°C
Min 14.5°C
Average annual
Rainfall
1018.3 mm 864.0 mm 1222.7 mm (Living in Australia,
2017)
In Brisbane, the average temperature in summer season (December-February) ranges from 21-
29.8 °C with the highest rainfalls in summer (average 426.6 mm) that can also cause for the
occasion floods and thunderstorms. The average temperature in Autumn (March-May) 15-25°C
with low humidity and less rain, in Winter (June-August) and 11-21°C with crispy nights and
early morning , and 15-25°C in summer with cool sea breezes. Brisbane city accounts for the
average rainfall 1020 mm, average sunny days 122 d, average annual humidity 58%, and average
daily sunshine 13 hours (Owley and Herokawa, 2015). The humidity ranges from 50% to 65%
with the most humidity in summer (65% in February) and less humidity in summer (the least
humid in September 50%). Brisbane has the longest hours of sunshine on the daily basis (4:50
a.m.-6:40 p.m.).
Table for Comparison of Climate Changes in Melbourne, Brisbane, and Sydney cities
State Brisbane Melbourne Sydney
Location Map
Population 2.2 million 4.4 million 4.8 million
Annual average
Temperature
Max 26.6°C
Min 16.6°C
Max 18.7°C
Min 8.3°C
Max 22.5°C
Min 14.5°C
Average annual
Rainfall
1018.3 mm 864.0 mm 1222.7 mm (Living in Australia,
2017)
⊘ This is a preview!⊘
Do you want full access?
Subscribe today to unlock all pages.
Trusted by 1+ million students worldwide
Sustainability and Climate Change 7
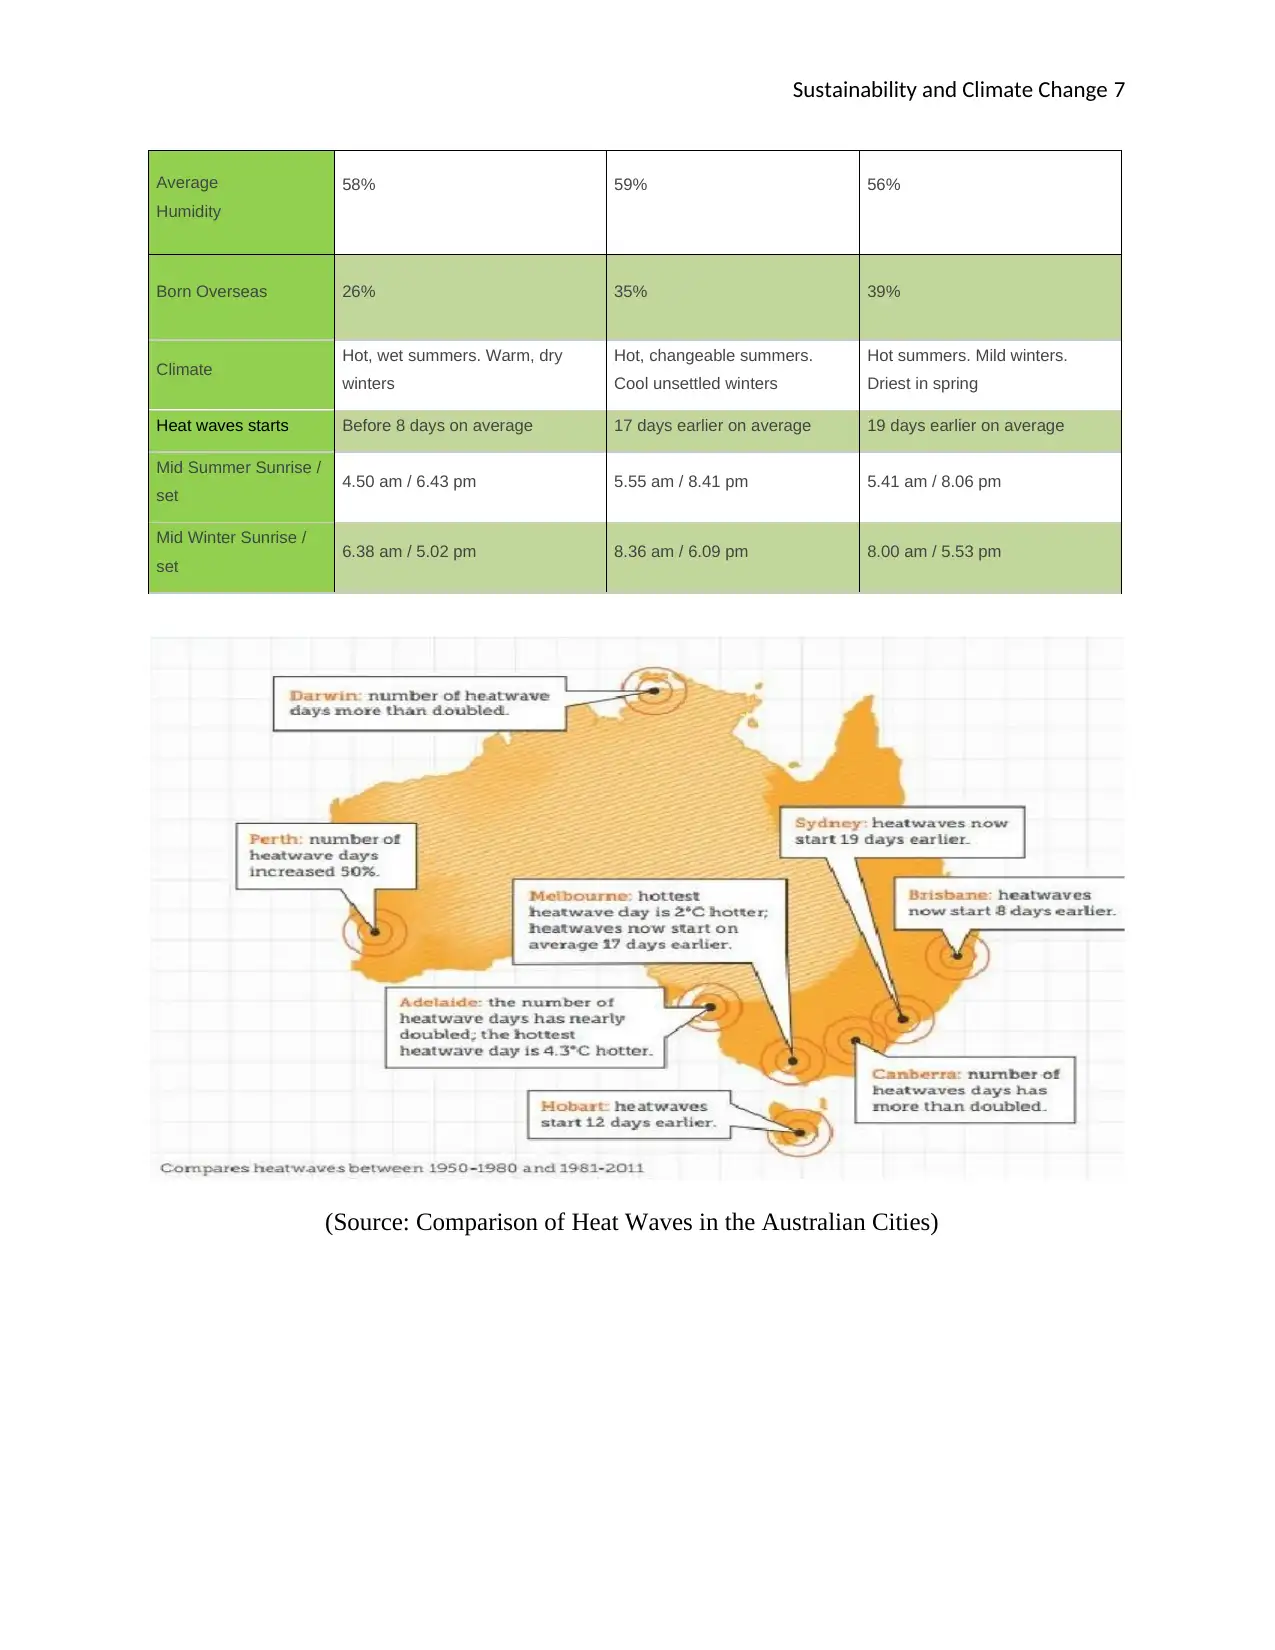
Average
Humidity
58% 59% 56%
Born Overseas 26% 35% 39%
Climate Hot, wet summers. Warm, dry
winters
Hot, changeable summers.
Cool unsettled winters
Hot summers. Mild winters.
Driest in spring
Heat waves starts Before 8 days on average 17 days earlier on average 19 days earlier on average
Mid Summer Sunrise /
set 4.50 am / 6.43 pm 5.55 am / 8.41 pm 5.41 am / 8.06 pm
Mid Winter Sunrise /
set 6.38 am / 5.02 pm 8.36 am / 6.09 pm 8.00 am / 5.53 pm
(Source: Comparison of Heat Waves in the Australian Cities)
Paraphrase This Document
Need a fresh take? Get an instant paraphrase of this document with our AI Paraphraser
Sustainability and Climate Change 8
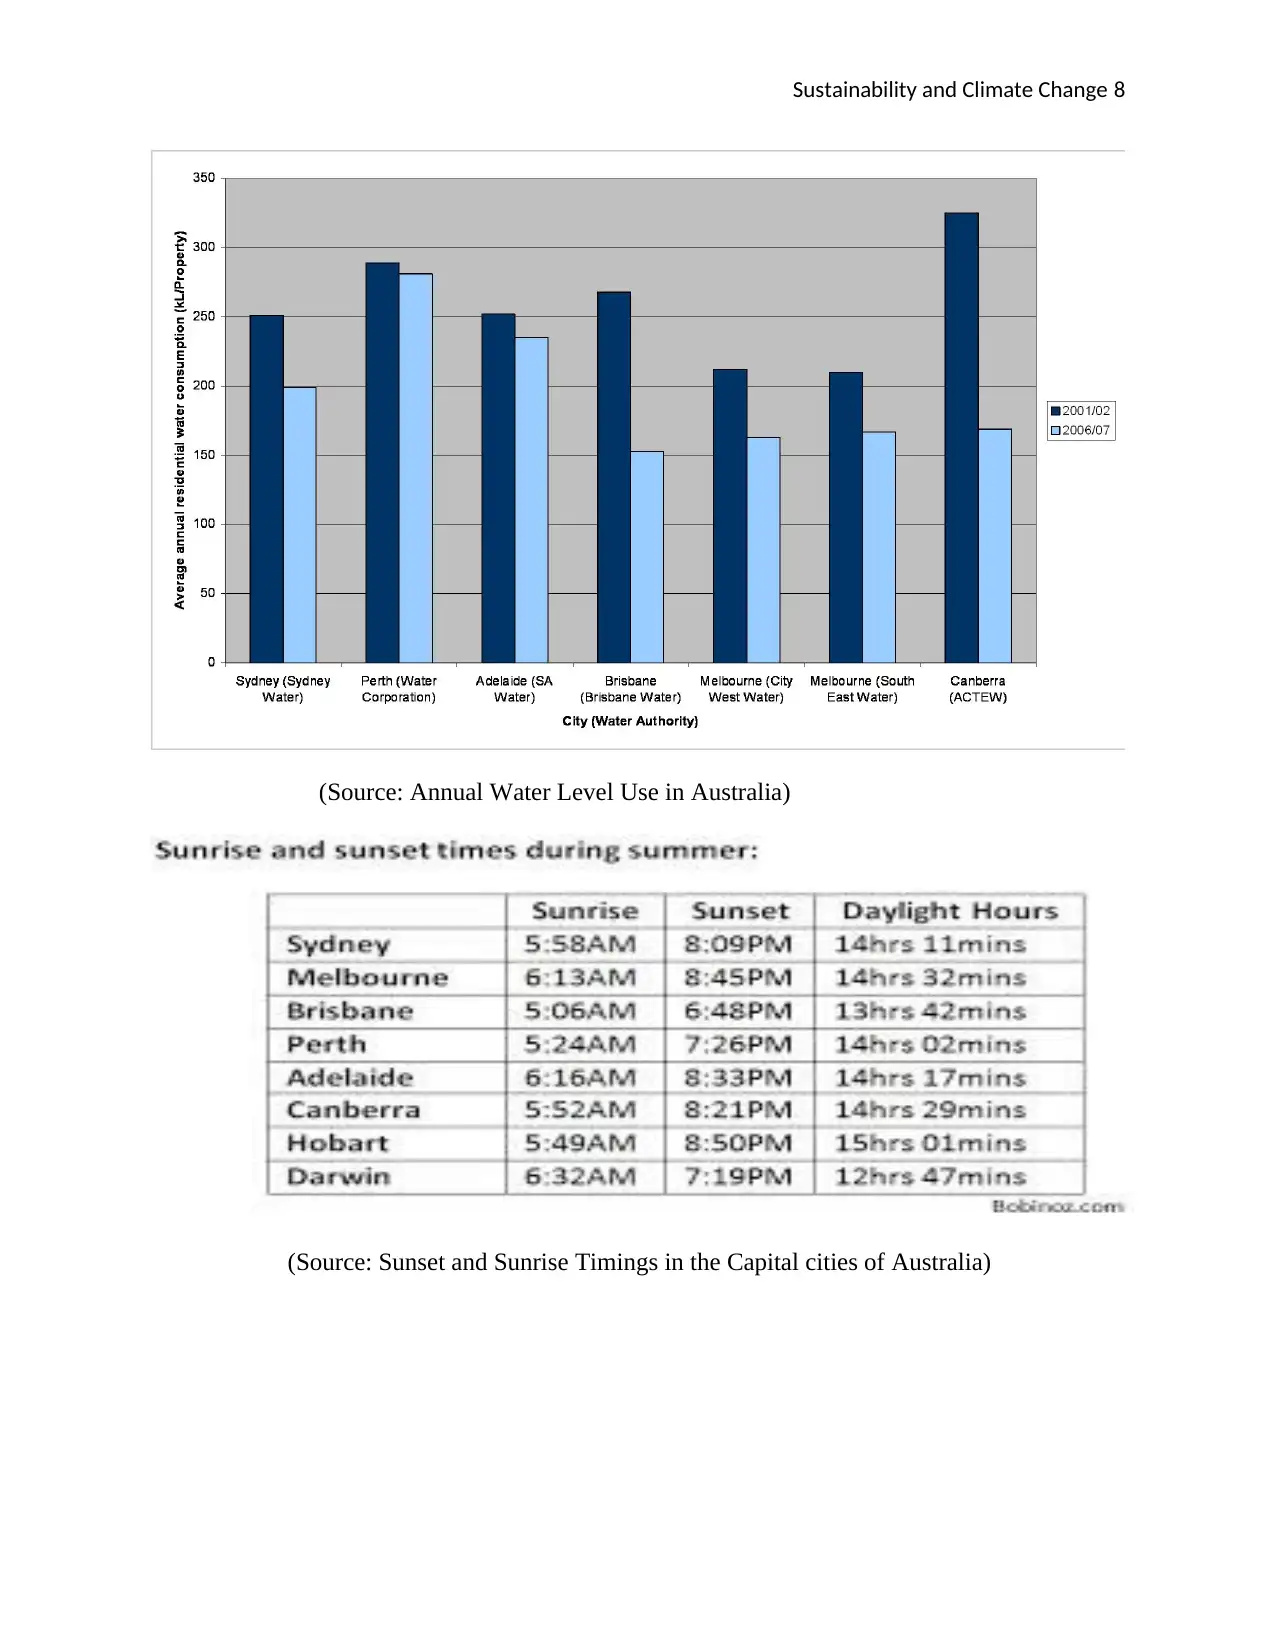
(Source: Annual Water Level Use in Australia)
(Source: Sunset and Sunrise Timings in the Capital cities of Australia)
(Source: Annual Water Level Use in Australia)
(Source: Sunset and Sunrise Timings in the Capital cities of Australia)
Sustainability and Climate Change 9
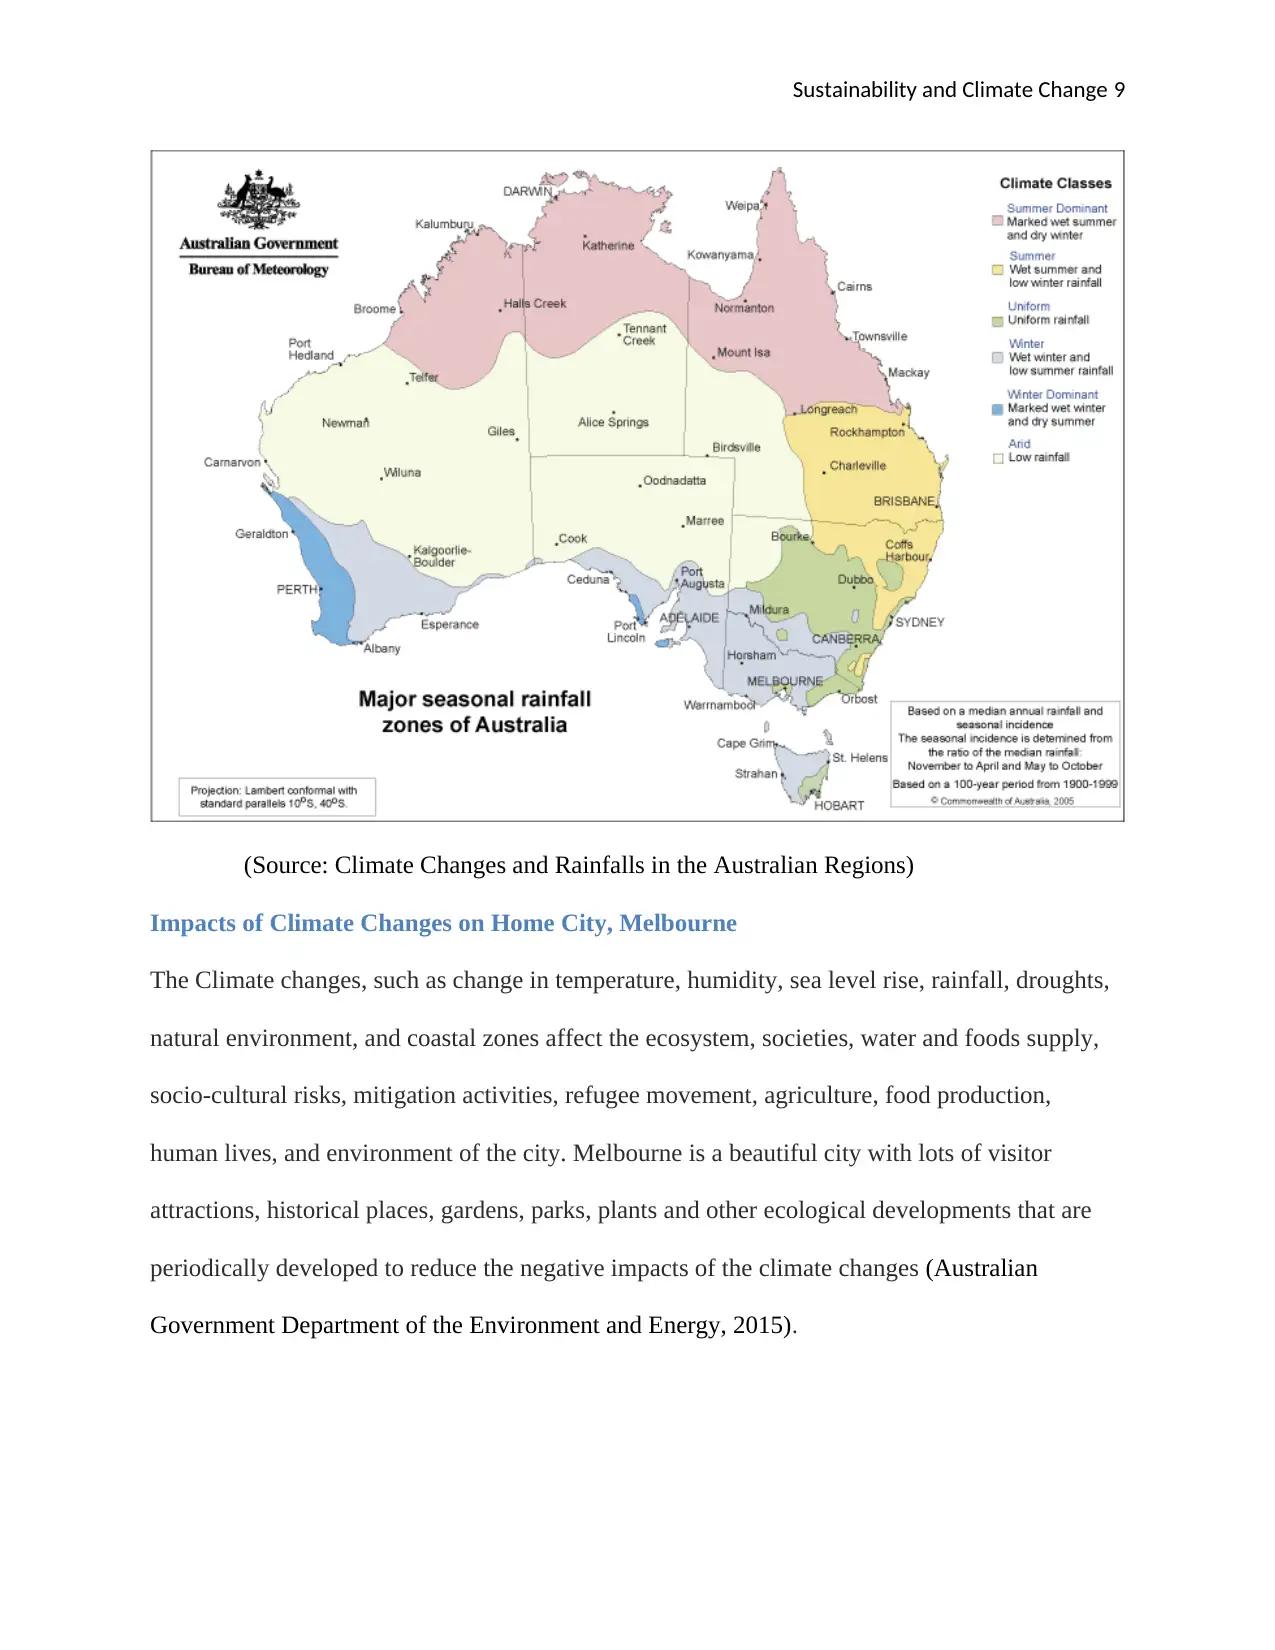
(Source: Climate Changes and Rainfalls in the Australian Regions)
Impacts of Climate Changes on Home City, Melbourne
The Climate changes, such as change in temperature, humidity, sea level rise, rainfall, droughts,
natural environment, and coastal zones affect the ecosystem, societies, water and foods supply,
socio-cultural risks, mitigation activities, refugee movement, agriculture, food production,
human lives, and environment of the city. Melbourne is a beautiful city with lots of visitor
attractions, historical places, gardens, parks, plants and other ecological developments that are
periodically developed to reduce the negative impacts of the climate changes (Australian
Government Department of the Environment and Energy, 2015).
⊘ This is a preview!⊘
Do you want full access?
Subscribe today to unlock all pages.
Trusted by 1+ million students worldwide
Sustainability and Climate Change 10
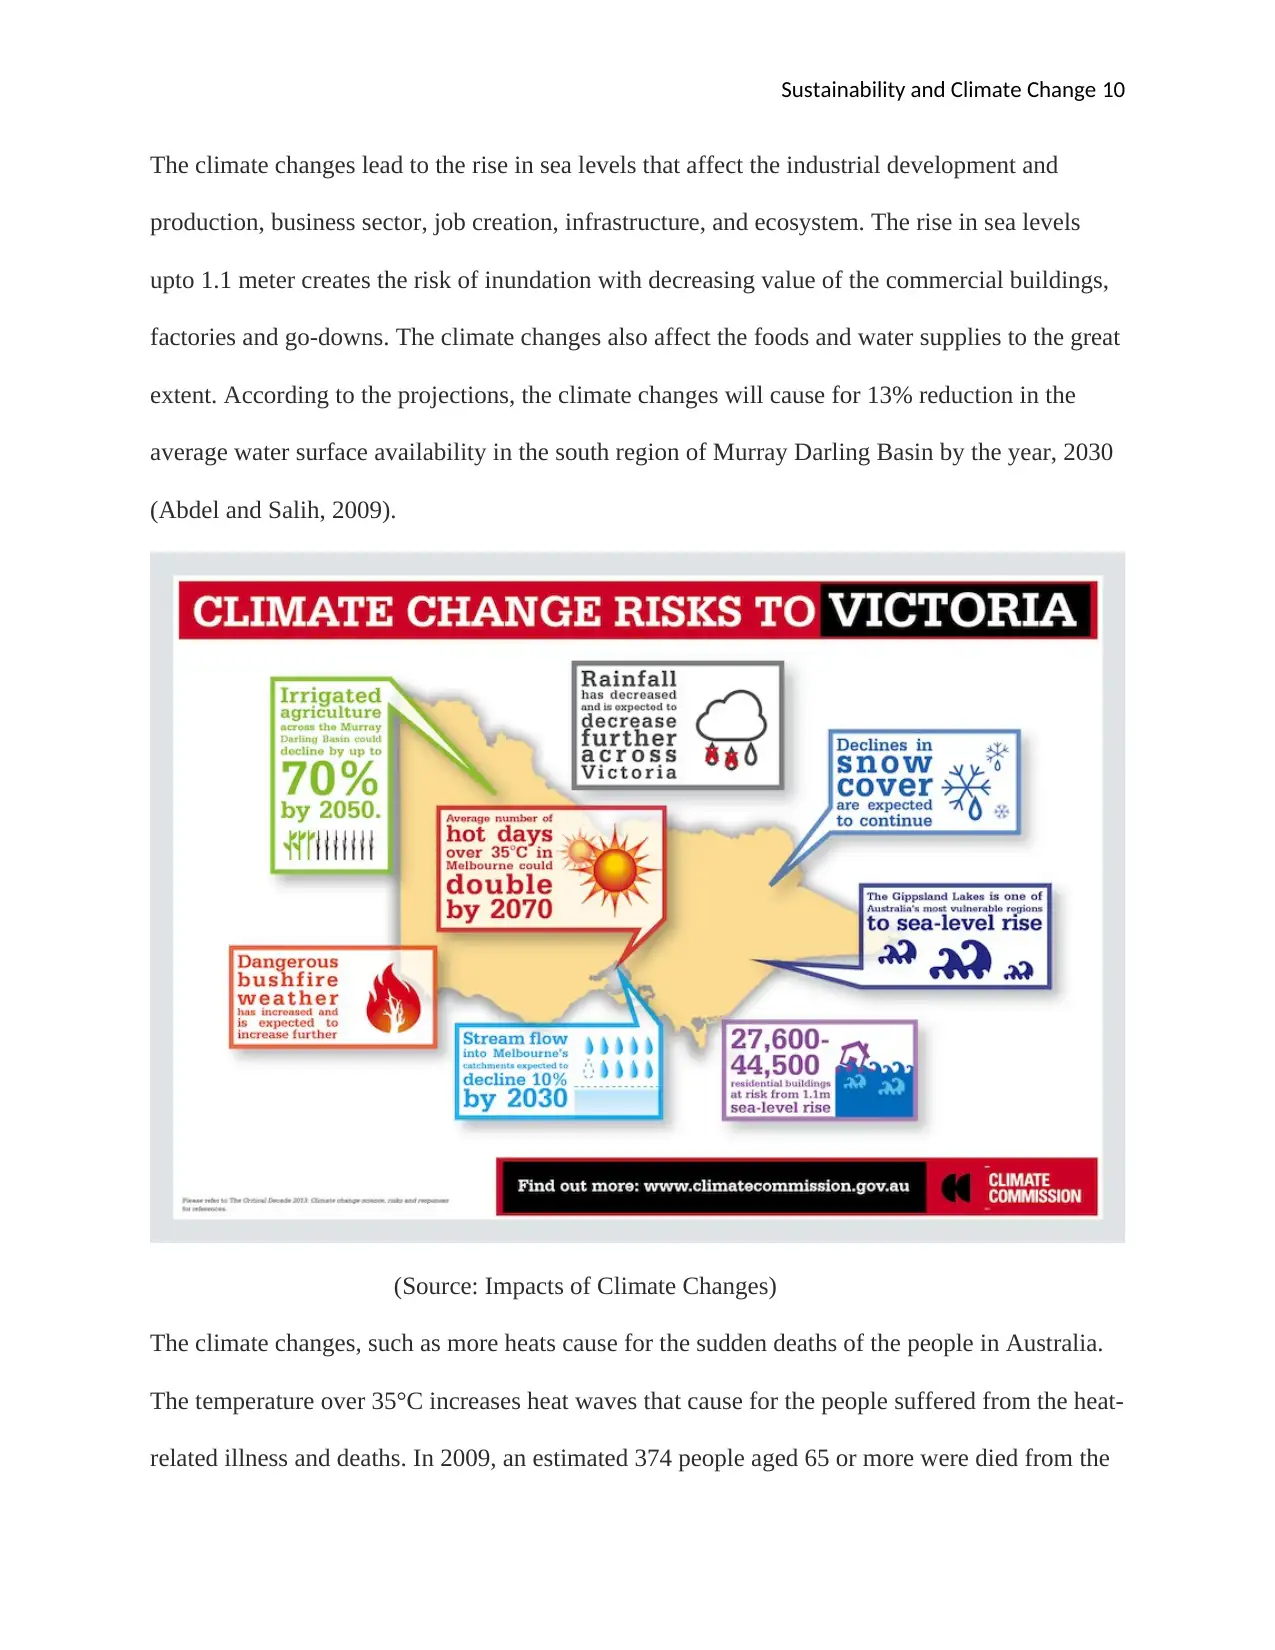
The climate changes lead to the rise in sea levels that affect the industrial development and
production, business sector, job creation, infrastructure, and ecosystem. The rise in sea levels
upto 1.1 meter creates the risk of inundation with decreasing value of the commercial buildings,
factories and go-downs. The climate changes also affect the foods and water supplies to the great
extent. According to the projections, the climate changes will cause for 13% reduction in the
average water surface availability in the south region of Murray Darling Basin by the year, 2030
(Abdel and Salih, 2009).
(Source: Impacts of Climate Changes)
The climate changes, such as more heats cause for the sudden deaths of the people in Australia.
The temperature over 35°C increases heat waves that cause for the people suffered from the heat-
related illness and deaths. In 2009, an estimated 374 people aged 65 or more were died from the
Paraphrase This Document
Need a fresh take? Get an instant paraphrase of this document with our AI Paraphraser
Sustainability and Climate Change 11
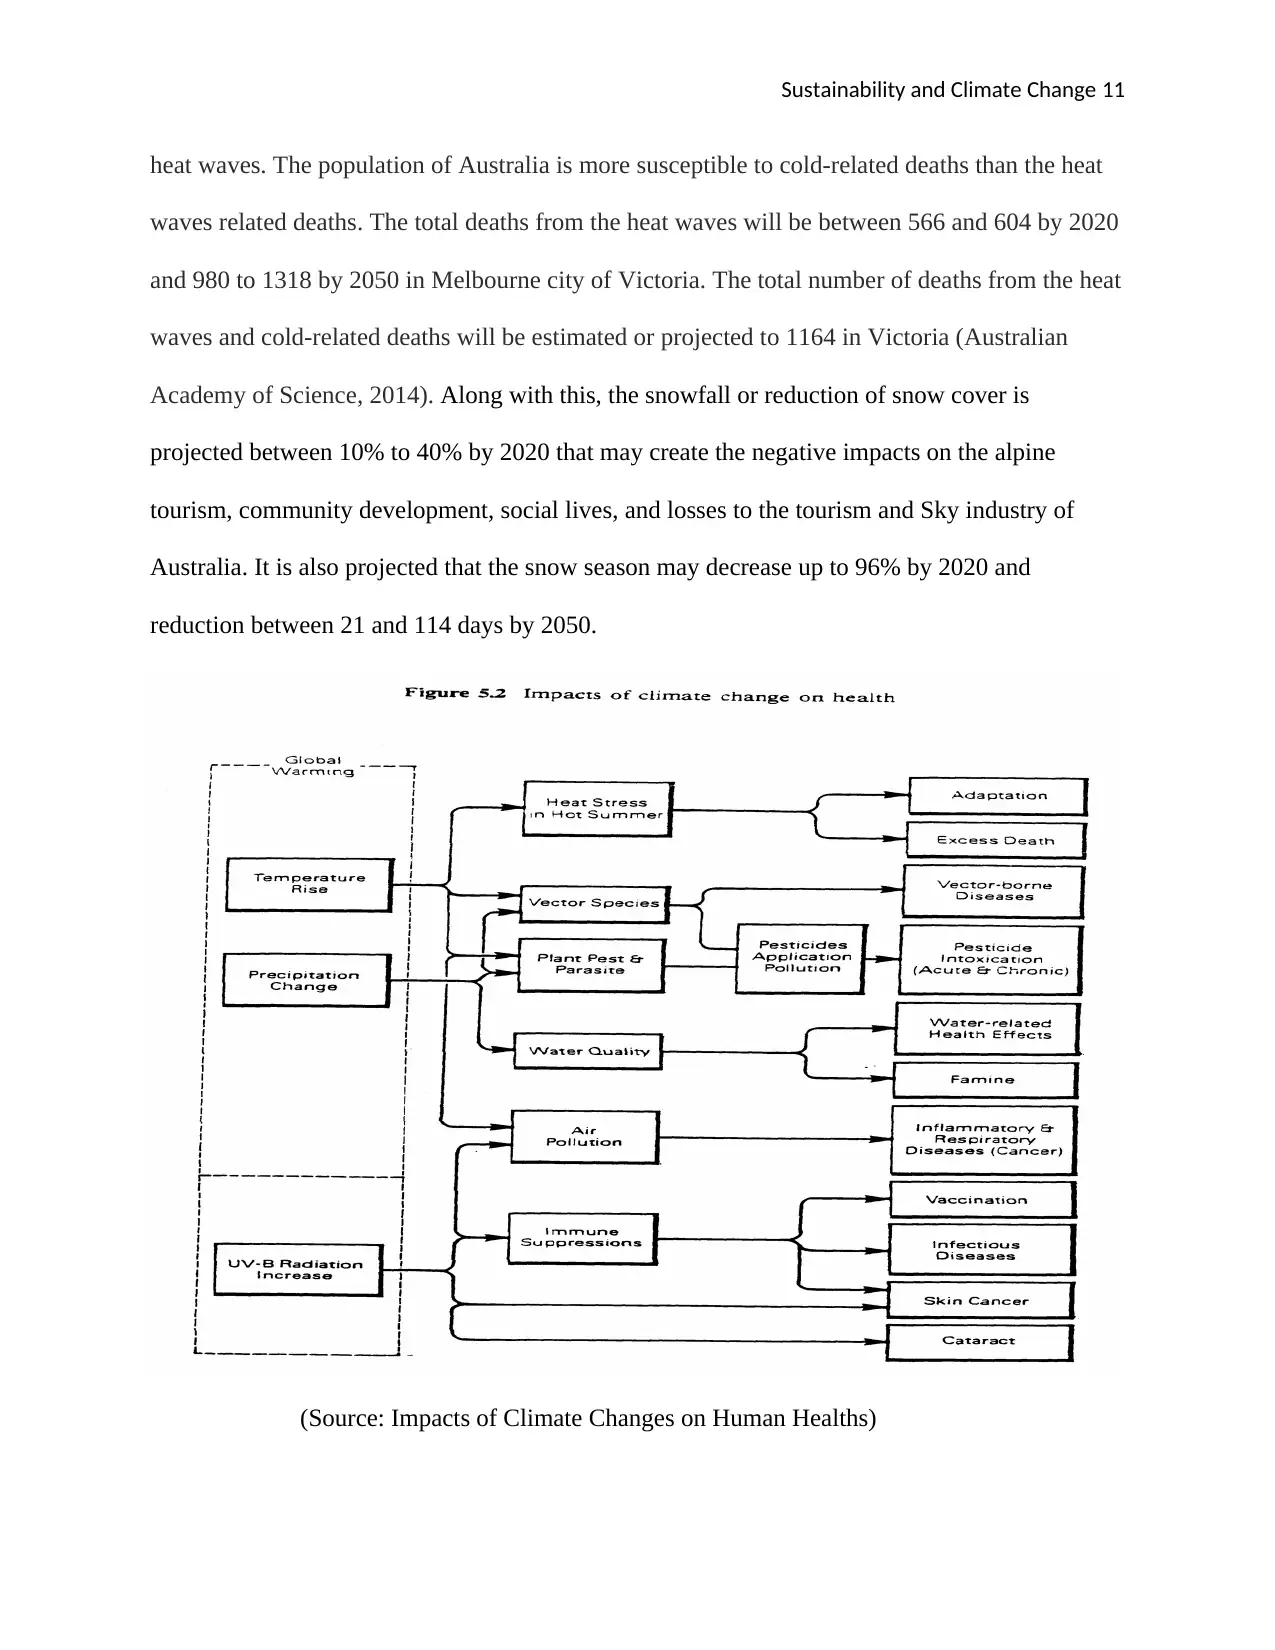
heat waves. The population of Australia is more susceptible to cold-related deaths than the heat
waves related deaths. The total deaths from the heat waves will be between 566 and 604 by 2020
and 980 to 1318 by 2050 in Melbourne city of Victoria. The total number of deaths from the heat
waves and cold-related deaths will be estimated or projected to 1164 in Victoria (Australian
Academy of Science, 2014). Along with this, the snowfall or reduction of snow cover is
projected between 10% to 40% by 2020 that may create the negative impacts on the alpine
tourism, community development, social lives, and losses to the tourism and Sky industry of
Australia. It is also projected that the snow season may decrease up to 96% by 2020 and
reduction between 21 and 114 days by 2050.
(Source: Impacts of Climate Changes on Human Healths)
Sustainability and Climate Change 12
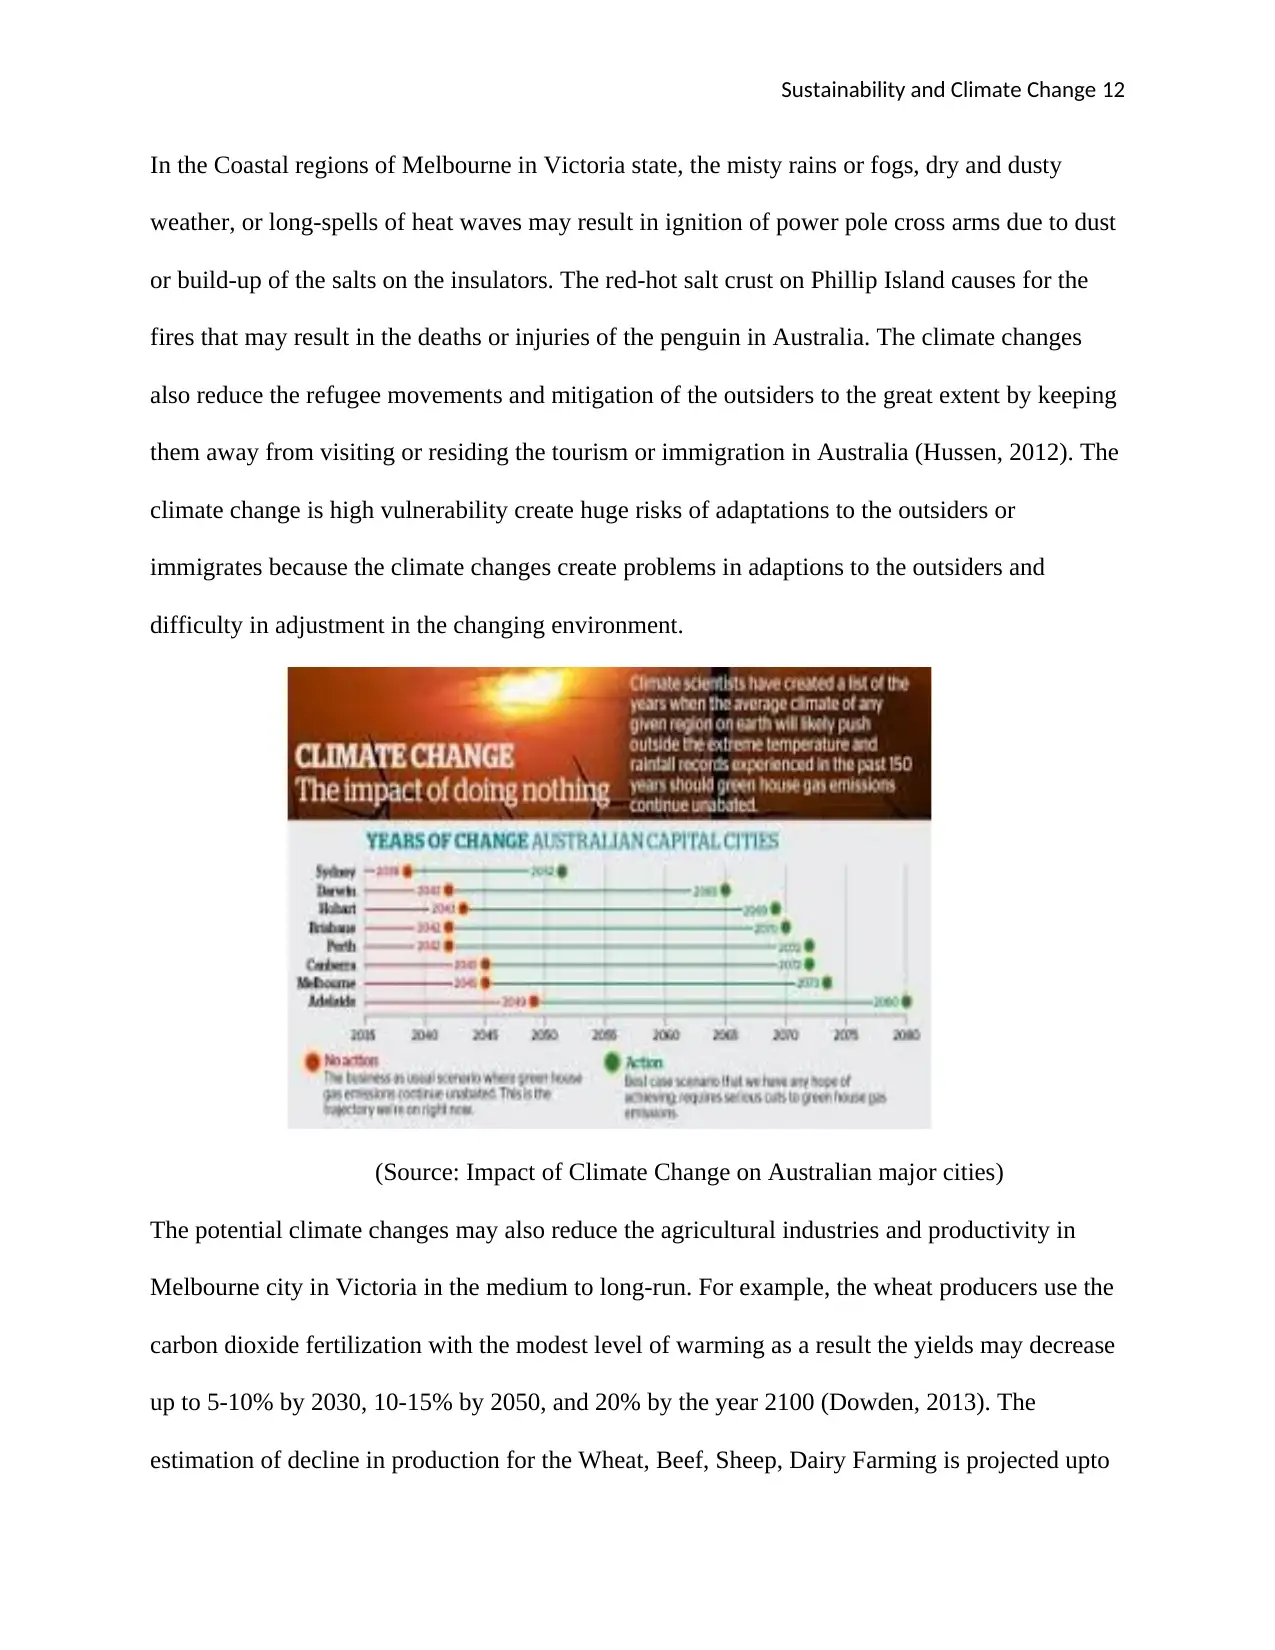
In the Coastal regions of Melbourne in Victoria state, the misty rains or fogs, dry and dusty
weather, or long-spells of heat waves may result in ignition of power pole cross arms due to dust
or build-up of the salts on the insulators. The red-hot salt crust on Phillip Island causes for the
fires that may result in the deaths or injuries of the penguin in Australia. The climate changes
also reduce the refugee movements and mitigation of the outsiders to the great extent by keeping
them away from visiting or residing the tourism or immigration in Australia (Hussen, 2012). The
climate change is high vulnerability create huge risks of adaptations to the outsiders or
immigrates because the climate changes create problems in adaptions to the outsiders and
difficulty in adjustment in the changing environment.
(Source: Impact of Climate Change on Australian major cities)
The potential climate changes may also reduce the agricultural industries and productivity in
Melbourne city in Victoria in the medium to long-run. For example, the wheat producers use the
carbon dioxide fertilization with the modest level of warming as a result the yields may decrease
up to 5-10% by 2030, 10-15% by 2050, and 20% by the year 2100 (Dowden, 2013). The
estimation of decline in production for the Wheat, Beef, Sheep, Dairy Farming is projected upto
⊘ This is a preview!⊘
Do you want full access?
Subscribe today to unlock all pages.
Trusted by 1+ million students worldwide
1 out of 19
Related Documents


Your All-in-One AI-Powered Toolkit for Academic Success.
+13062052269
info@desklib.com
Available 24*7 on WhatsApp / Email
![[object Object]](/_next/static/media/star-bottom.7253800d.svg)
Unlock your academic potential
Copyright © 2020–2026 A2Z Services. All Rights Reserved. Developed and managed by ZUCOL.