Economics Assignment: Analysis of Australian Economy's Performance
VerifiedAdded on 2021/05/27
|17
|4100
|21
Report
AI Summary
This economics assignment provides a comprehensive analysis of the Australian economy, examining key macroeconomic indicators and their interrelationships. The report begins with an executive summary that highlights the main findings, followed by an introduction to the Australian economy's performance over the last three decades. It then delves into the relationships between the real GDP growth rate and inflation, the real GDP growth rate and unemployment, and the evidence of the business cycle in Australia. Furthermore, the assignment investigates the relationship between net exports and real exchange rates, and the association between Australia's cash rates and the Federal Reserve's rates in the USA. The analysis utilizes graphical presentations and statistical explanations to support its findings, concluding with a macroeconomic outlook for Australia and a summary of the report's key insights. The report concludes that the Australian economy has high potential to become one of the largest economy around the world if it holds its current pace of growth.
Running head: ECONOMICS ASSIGNMENT
Economics Assignment
Name of the student:
Name of the University:
Author note
Economics Assignment
Name of the student:
Name of the University:
Author note
Paraphrase This Document
Need a fresh take? Get an instant paraphrase of this document with our AI Paraphraser
2ECONOMICS ASSIGNMENT
Executive summary:
This report was aimed to discuss the economic performance of the state through utilising the
graphical presentation and statistical explanation of the macroeconomic parameters like GDP
growth rate, unemployment rate, inflation rate and others. In addition to this, the report has
tried to trace, whether the Australian economy has been performing according to the theory
of the business cycle or not. From the analysis it has been found that Australian economy is
one of the largest mixed economy that has been going through large amount of growth during
the last three decades. From the analysis of the Real GDP of the stat and the various other
macroeconomic parameters of the Australia it can be seen that the state has been performing
pretty well during the recent years. To conclude the report has argued that Australian
economy has high potential to become one of the largest economy around the world if it
holds its current pace of growth.
3ECONOMICS ASSIGNMENT
Table of Contents
Introduction:...............................................................................................................................4
Relationship between Australia’s real GDP growth rate and inflation rate:..............................5
Real GDP growth rate and unemployment rate:........................................................................6
Evidence of the business cycle:..................................................................................................8
Relationship between net exports and the real exchange rates of USA and Australia:.............9
Association between Australia’s Cash rates and the Federal Reserve Fund’s rates in USA:. .10
How movements in the Federal Reserve Fund’s rates drive movements in the Cash rates:....12
Macroeconomic outlook of Australia:.....................................................................................12
Conclusion:..............................................................................................................................14
Reference:................................................................................................................................15
Appendix:.................................................................................................................................17
⊘ This is a preview!⊘
Do you want full access?
Subscribe today to unlock all pages.
Trusted by 1+ million students worldwide
4ECONOMICS ASSIGNMENT
Introduction:
Australia is one of the mixed developed economy, which has been going through
large amount of transformation since last two decades in its various economic factors.
Australia presently has been facing its 27th consecutive growth year, which has been mainly
driven by the strong performance of the mining, agriculture and service sector (Downes et al.
2014). Depending upon the large share of the tertiary and robust performance of the primary
sector, Australian economy ranks 1p9th as per the nominal Gross Domestic Product (GDP)
and presently Australia is trying hard to become a sustainable economy that can withstand
against the demand or supply side shock in future. Though the Australian GDP growth rate
has been fallen in recent years, however, overall GDP value has increased largely depicting
the fact that the Australian economy has been evolving as one of the largest economy around
the world (Markovic et al. 2016). With considerable amount of employment and job creation,
economy of the state has transformed itself largely from where it was during three decades
ago. Considering the open market scenario of the Australian economy, it can be seen that the
state has recently reduced the gap in exchange rate between Australian dollar (AUD) and US
dollar (USD) depicting good trading performance of the state (Rees et al. 2016).
Under this scenario, this report is aimed to discuss the economic performance of the
state through utilising the graphical presentation and statistical explanation of the
macroeconomic parameters like GDP growth rate, unemployment rate, inflation rate and
others. In addition to this, the report will trace, whether the Australian economy has been
performing according to the theory of the business cycle or not. Moreover, it will portray the
relationship between the Federal Reserve rate and the cash rate of Australia in order to
showcase the loanable fund market of the economies and depict a comparison between these
two trading partners. Moving forward, the report will provide a forecast for the Australian
economy and to conclude the report will give a summarised overview of its findings.
Paraphrase This Document
Need a fresh take? Get an instant paraphrase of this document with our AI Paraphraser
5ECONOMICS ASSIGNMENT
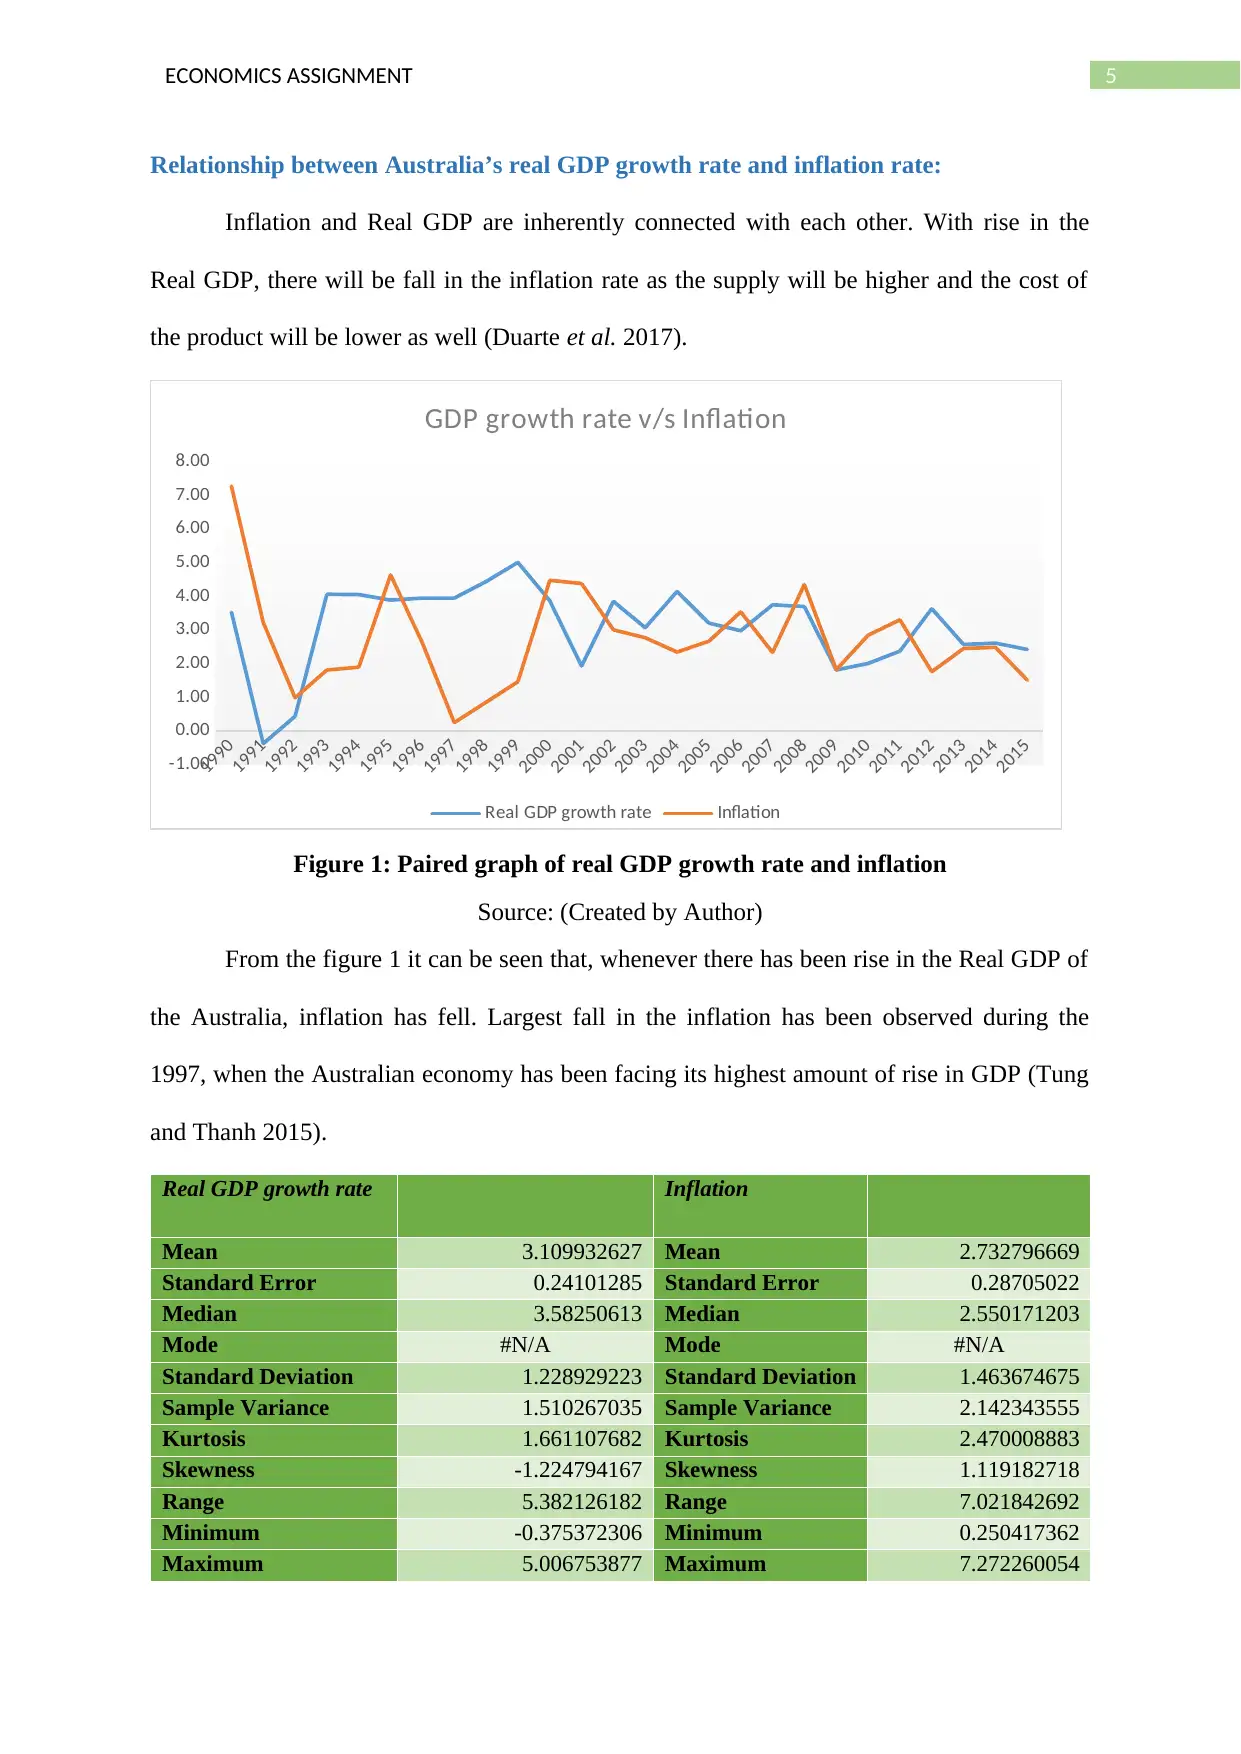
Relationship between Australia’s real GDP growth rate and inflation rate:
Inflation and Real GDP are inherently connected with each other. With rise in the
Real GDP, there will be fall in the inflation rate as the supply will be higher and the cost of
the product will be lower as well (Duarte et al. 2017).
1990
1991
1992
1993
1994
1995
1996
1997
1998
1999
2000
2001
2002
2003
2004
2005
2006
2007
2008
2009
2010
2011
2012
2013
2014
2015
-1.00
0.00
1.00
2.00
3.00
4.00
5.00
6.00
7.00
8.00
GDP growth rate v/s Inflation
Real GDP growth rate Inflation
Figure 1: Paired graph of real GDP growth rate and inflation
Source: (Created by Author)
From the figure 1 it can be seen that, whenever there has been rise in the Real GDP of
the Australia, inflation has fell. Largest fall in the inflation has been observed during the
1997, when the Australian economy has been facing its highest amount of rise in GDP (Tung
and Thanh 2015).
Real GDP growth rate Inflation
Mean 3.109932627 Mean 2.732796669
Standard Error 0.24101285 Standard Error 0.28705022
Median 3.58250613 Median 2.550171203
Mode #N/A Mode #N/A
Standard Deviation 1.228929223 Standard Deviation 1.463674675
Sample Variance 1.510267035 Sample Variance 2.142343555
Kurtosis 1.661107682 Kurtosis 2.470008883
Skewness -1.224794167 Skewness 1.119182718
Range 5.382126182 Range 7.021842692
Minimum -0.375372306 Minimum 0.250417362
Maximum 5.006753877 Maximum 7.272260054
6ECONOMICS ASSIGNMENT
Sum 80.85824831 Sum 71.05271339
Count 26 Count 26
Table 1: Summary statistics of Real GDP growth rate and inflation
Source: (Created by Author)
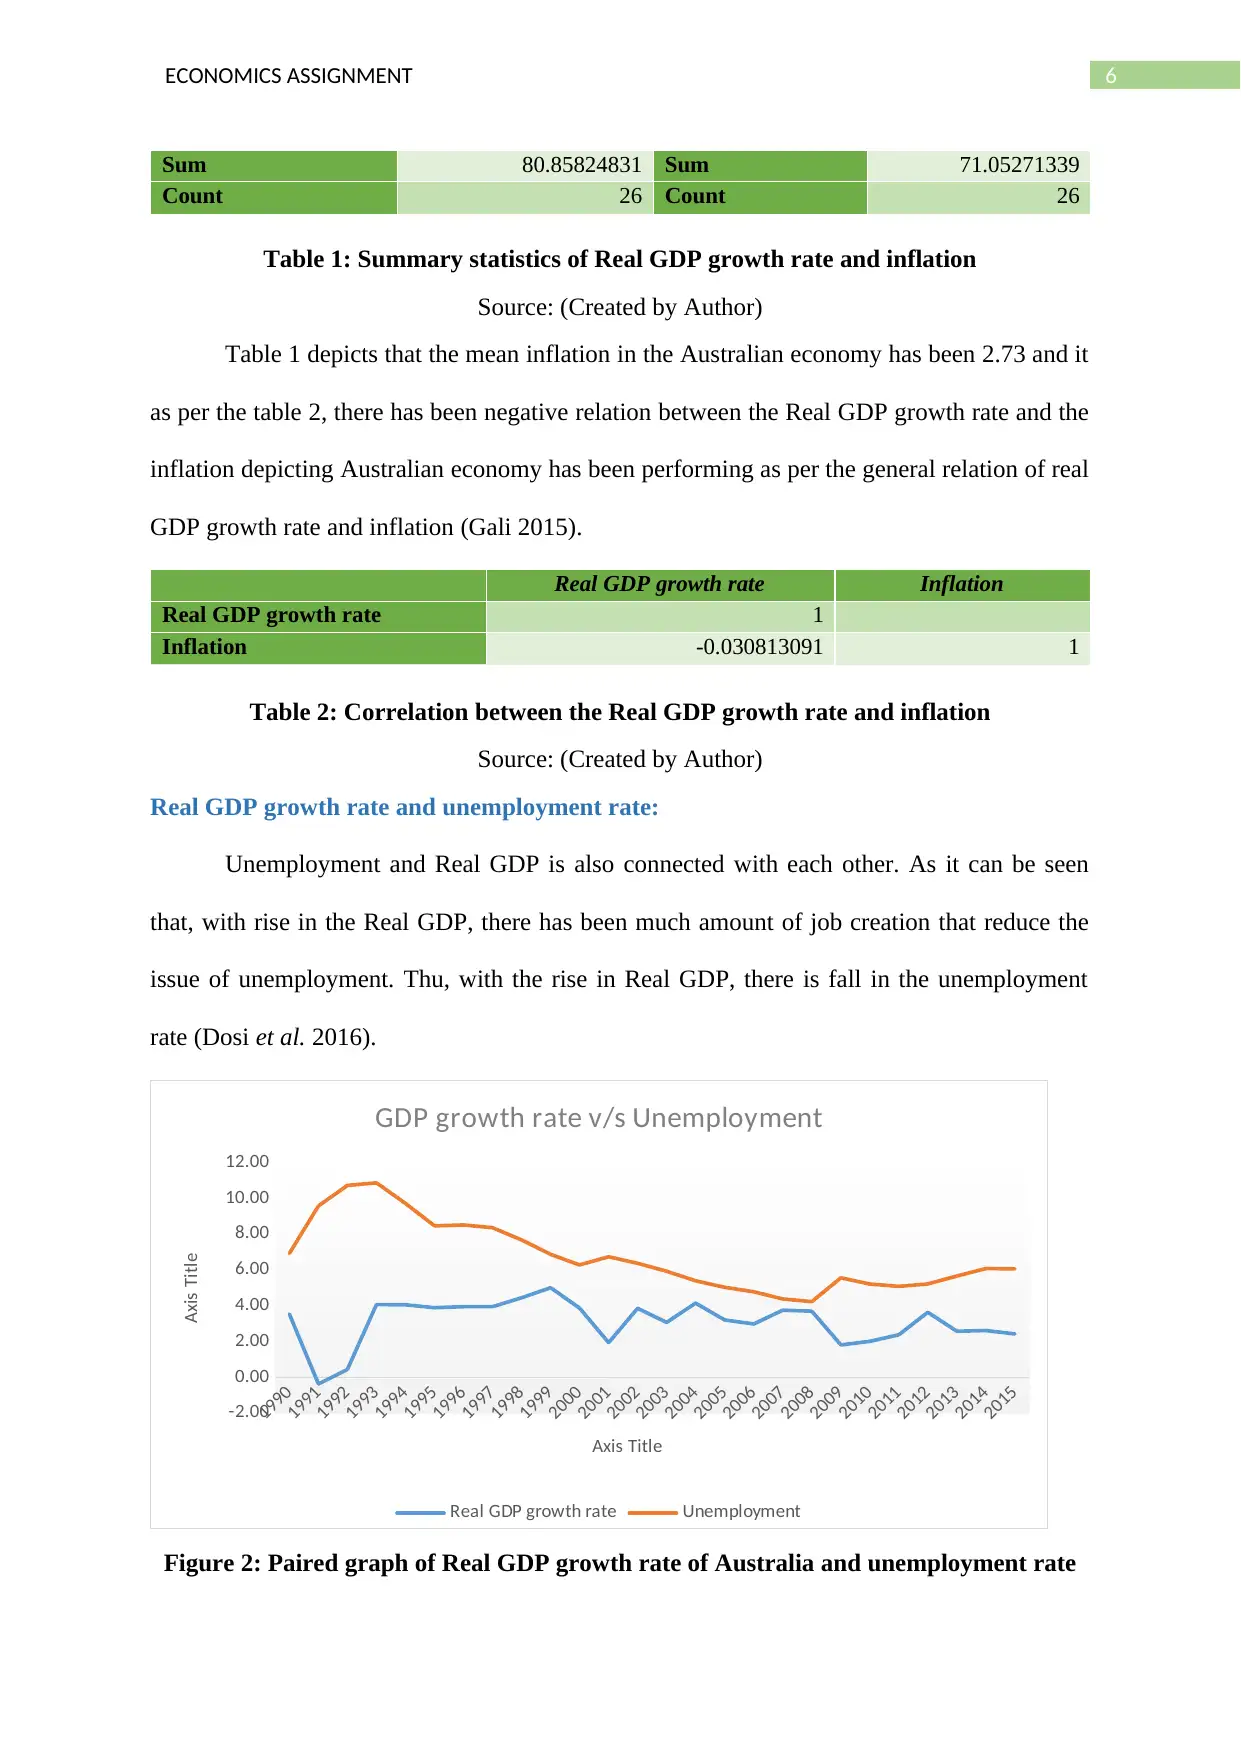
Table 1 depicts that the mean inflation in the Australian economy has been 2.73 and it
as per the table 2, there has been negative relation between the Real GDP growth rate and the
inflation depicting Australian economy has been performing as per the general relation of real
GDP growth rate and inflation (Gali 2015).
Real GDP growth rate Inflation
Real GDP growth rate 1
Inflation -0.030813091 1
Table 2: Correlation between the Real GDP growth rate and inflation
Source: (Created by Author)
Real GDP growth rate and unemployment rate:
Unemployment and Real GDP is also connected with each other. As it can be seen
that, with rise in the Real GDP, there has been much amount of job creation that reduce the
issue of unemployment. Thu, with the rise in Real GDP, there is fall in the unemployment
rate (Dosi et al. 2016).
1990
1991
1992
1993
1994
1995
1996
1997
1998
1999
2000
2001
2002
2003
2004
2005
2006
2007
2008
2009
2010
2011
2012
2013
2014
2015
-2.00
0.00
2.00
4.00
6.00
8.00
10.00
12.00
GDP growth rate v/s Unemployment
Real GDP growth rate Unemployment
Axis Title
Axis Title
Figure 2: Paired graph of Real GDP growth rate of Australia and unemployment rate
Sum 80.85824831 Sum 71.05271339
Count 26 Count 26
Table 1: Summary statistics of Real GDP growth rate and inflation
Source: (Created by Author)
Table 1 depicts that the mean inflation in the Australian economy has been 2.73 and it
as per the table 2, there has been negative relation between the Real GDP growth rate and the
inflation depicting Australian economy has been performing as per the general relation of real
GDP growth rate and inflation (Gali 2015).
Real GDP growth rate Inflation
Real GDP growth rate 1
Inflation -0.030813091 1
Table 2: Correlation between the Real GDP growth rate and inflation
Source: (Created by Author)
Real GDP growth rate and unemployment rate:
Unemployment and Real GDP is also connected with each other. As it can be seen
that, with rise in the Real GDP, there has been much amount of job creation that reduce the
issue of unemployment. Thu, with the rise in Real GDP, there is fall in the unemployment
rate (Dosi et al. 2016).
1990
1991
1992
1993
1994
1995
1996
1997
1998
1999
2000
2001
2002
2003
2004
2005
2006
2007
2008
2009
2010
2011
2012
2013
2014
2015
-2.00
0.00
2.00
4.00
6.00
8.00
10.00
12.00
GDP growth rate v/s Unemployment
Real GDP growth rate Unemployment
Axis Title
Axis Title
Figure 2: Paired graph of Real GDP growth rate of Australia and unemployment rate
⊘ This is a preview!⊘
Do you want full access?
Subscribe today to unlock all pages.
Trusted by 1+ million students worldwide
7ECONOMICS ASSIGNMENT
Source: (Created by Author)
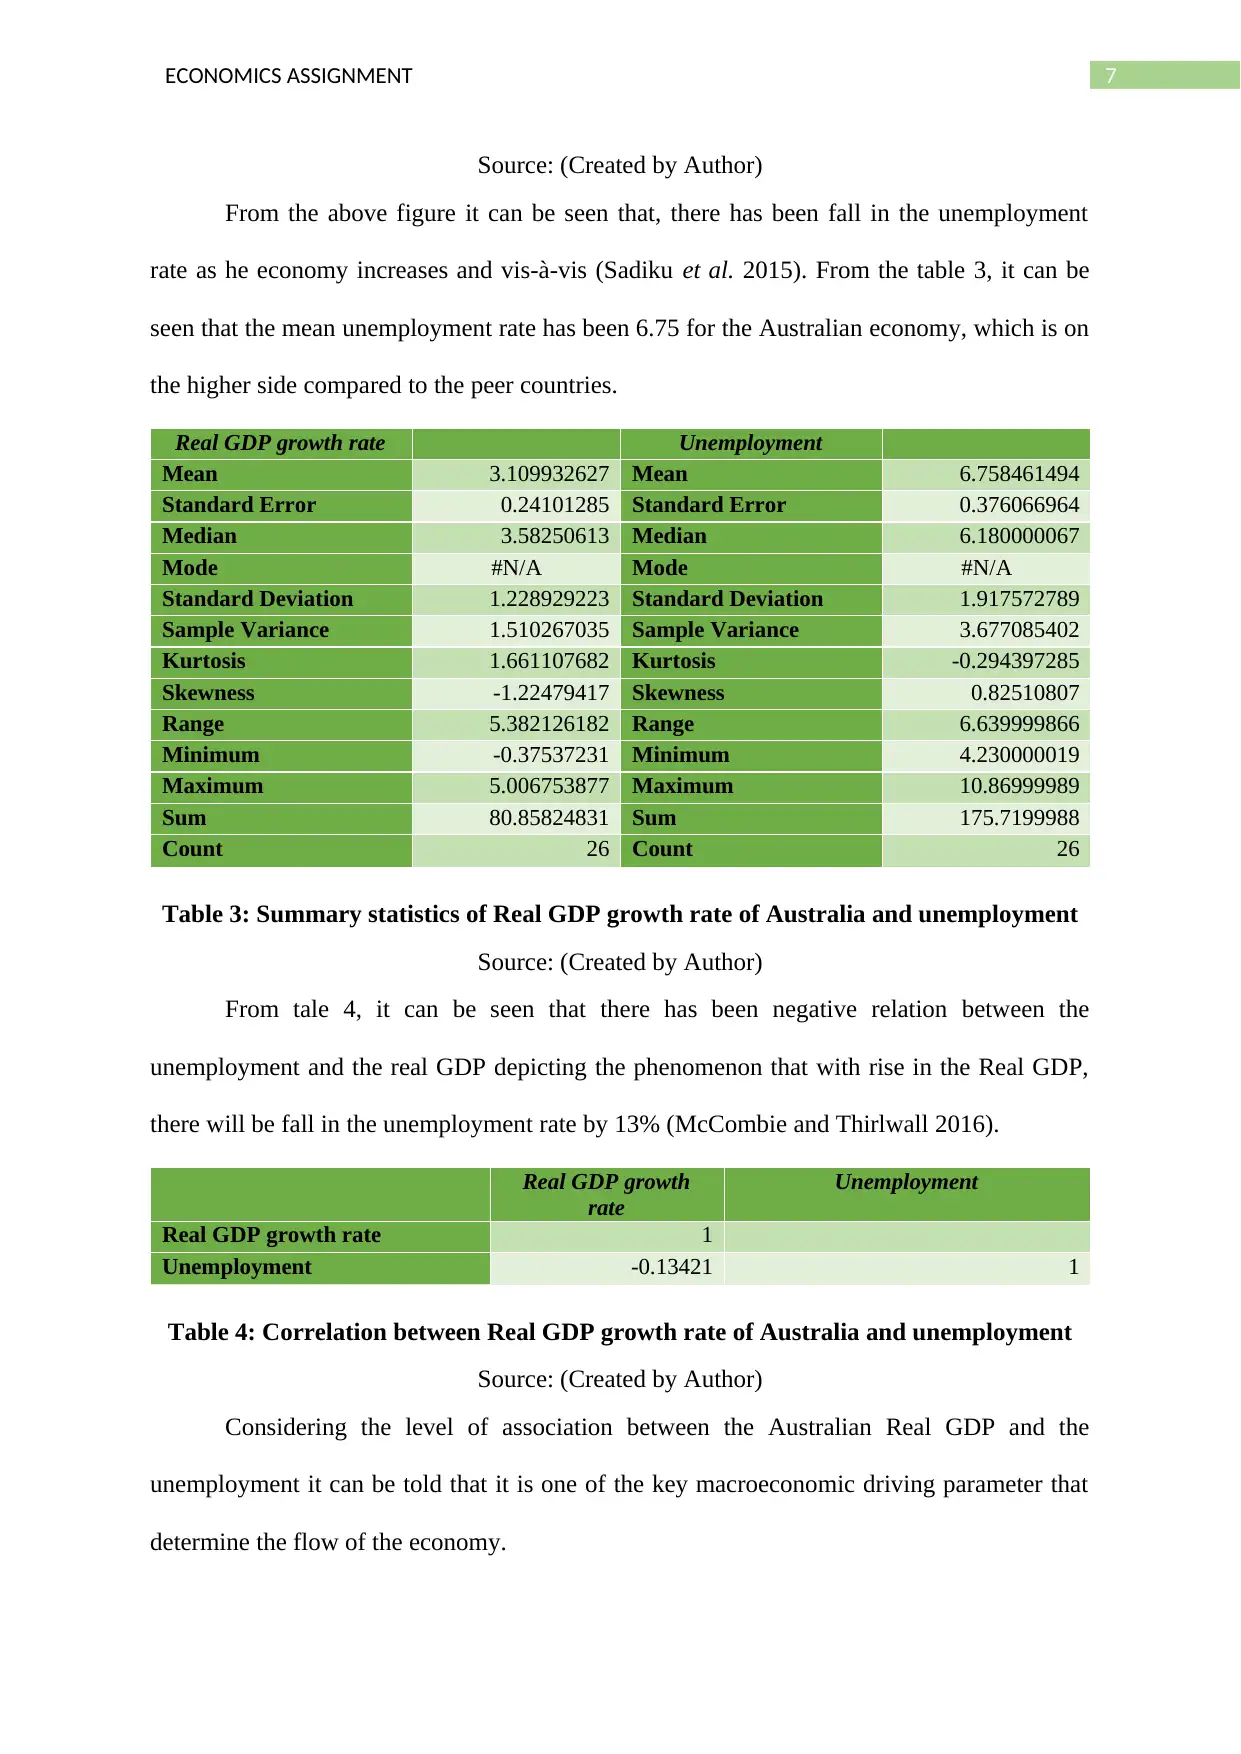
From the above figure it can be seen that, there has been fall in the unemployment
rate as he economy increases and vis-à-vis (Sadiku et al. 2015). From the table 3, it can be
seen that the mean unemployment rate has been 6.75 for the Australian economy, which is on
the higher side compared to the peer countries.
Real GDP growth rate Unemployment
Mean 3.109932627 Mean 6.758461494
Standard Error 0.24101285 Standard Error 0.376066964
Median 3.58250613 Median 6.180000067
Mode #N/A Mode #N/A
Standard Deviation 1.228929223 Standard Deviation 1.917572789
Sample Variance 1.510267035 Sample Variance 3.677085402
Kurtosis 1.661107682 Kurtosis -0.294397285
Skewness -1.22479417 Skewness 0.82510807
Range 5.382126182 Range 6.639999866
Minimum -0.37537231 Minimum 4.230000019
Maximum 5.006753877 Maximum 10.86999989
Sum 80.85824831 Sum 175.7199988
Count 26 Count 26
Table 3: Summary statistics of Real GDP growth rate of Australia and unemployment
Source: (Created by Author)
From tale 4, it can be seen that there has been negative relation between the
unemployment and the real GDP depicting the phenomenon that with rise in the Real GDP,
there will be fall in the unemployment rate by 13% (McCombie and Thirlwall 2016).
Real GDP growth
rate
Unemployment
Real GDP growth rate 1
Unemployment -0.13421 1
Table 4: Correlation between Real GDP growth rate of Australia and unemployment
Source: (Created by Author)
Considering the level of association between the Australian Real GDP and the
unemployment it can be told that it is one of the key macroeconomic driving parameter that
determine the flow of the economy.
Source: (Created by Author)
From the above figure it can be seen that, there has been fall in the unemployment
rate as he economy increases and vis-à-vis (Sadiku et al. 2015). From the table 3, it can be
seen that the mean unemployment rate has been 6.75 for the Australian economy, which is on
the higher side compared to the peer countries.
Real GDP growth rate Unemployment
Mean 3.109932627 Mean 6.758461494
Standard Error 0.24101285 Standard Error 0.376066964
Median 3.58250613 Median 6.180000067
Mode #N/A Mode #N/A
Standard Deviation 1.228929223 Standard Deviation 1.917572789
Sample Variance 1.510267035 Sample Variance 3.677085402
Kurtosis 1.661107682 Kurtosis -0.294397285
Skewness -1.22479417 Skewness 0.82510807
Range 5.382126182 Range 6.639999866
Minimum -0.37537231 Minimum 4.230000019
Maximum 5.006753877 Maximum 10.86999989
Sum 80.85824831 Sum 175.7199988
Count 26 Count 26
Table 3: Summary statistics of Real GDP growth rate of Australia and unemployment
Source: (Created by Author)
From tale 4, it can be seen that there has been negative relation between the
unemployment and the real GDP depicting the phenomenon that with rise in the Real GDP,
there will be fall in the unemployment rate by 13% (McCombie and Thirlwall 2016).
Real GDP growth
rate
Unemployment
Real GDP growth rate 1
Unemployment -0.13421 1
Table 4: Correlation between Real GDP growth rate of Australia and unemployment
Source: (Created by Author)
Considering the level of association between the Australian Real GDP and the
unemployment it can be told that it is one of the key macroeconomic driving parameter that
determine the flow of the economy.
Paraphrase This Document
Need a fresh take? Get an instant paraphrase of this document with our AI Paraphraser
8ECONOMICS ASSIGNMENT
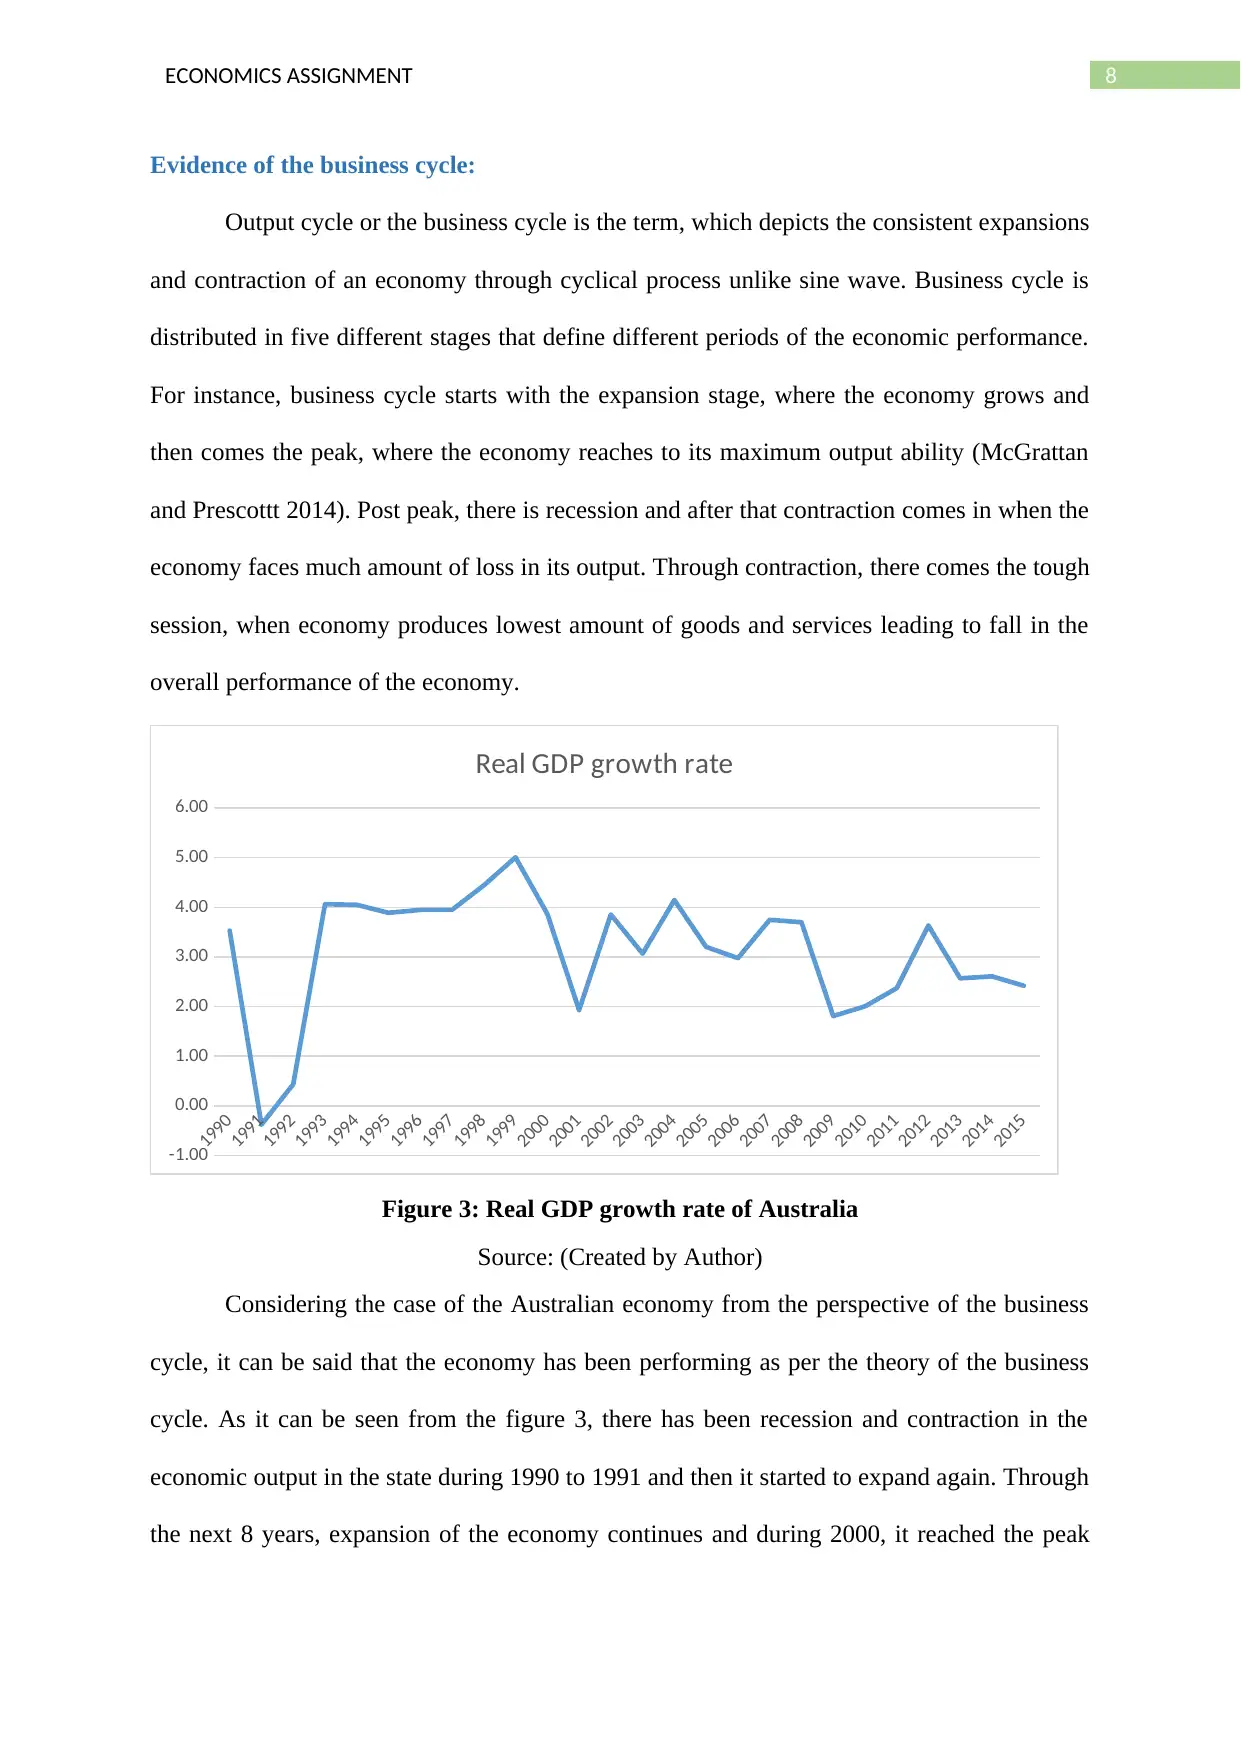
Evidence of the business cycle:
Output cycle or the business cycle is the term, which depicts the consistent expansions
and contraction of an economy through cyclical process unlike sine wave. Business cycle is
distributed in five different stages that define different periods of the economic performance.
For instance, business cycle starts with the expansion stage, where the economy grows and
then comes the peak, where the economy reaches to its maximum output ability (McGrattan
and Prescottt 2014). Post peak, there is recession and after that contraction comes in when the
economy faces much amount of loss in its output. Through contraction, there comes the tough
session, when economy produces lowest amount of goods and services leading to fall in the
overall performance of the economy.
1990
1991
1992
1993
1994
1995
1996
1997
1998
1999
2000
2001
2002
2003
2004
2005
2006
2007
2008
2009
2010
2011
2012
2013
2014
2015
-1.00
0.00
1.00
2.00
3.00
4.00
5.00
6.00
Real GDP growth rate
Figure 3: Real GDP growth rate of Australia
Source: (Created by Author)
Considering the case of the Australian economy from the perspective of the business
cycle, it can be said that the economy has been performing as per the theory of the business
cycle. As it can be seen from the figure 3, there has been recession and contraction in the
economic output in the state during 1990 to 1991 and then it started to expand again. Through
the next 8 years, expansion of the economy continues and during 2000, it reached the peak
9ECONOMICS ASSIGNMENT
(Schroeder 2018). Post peak, economy started to fall again and recession comes in. through
this economic cycle Australian economic output has been increasing during the last three
decades and considering this it can be stated that Australian economy has been performed as
per the business cycle (Manalo et al. 2015). Australian business cycles relatively symmetric
in terms of both the amplitude and duration during the chosen years and contraction as well
as the peak is short lived session of the business cycle.
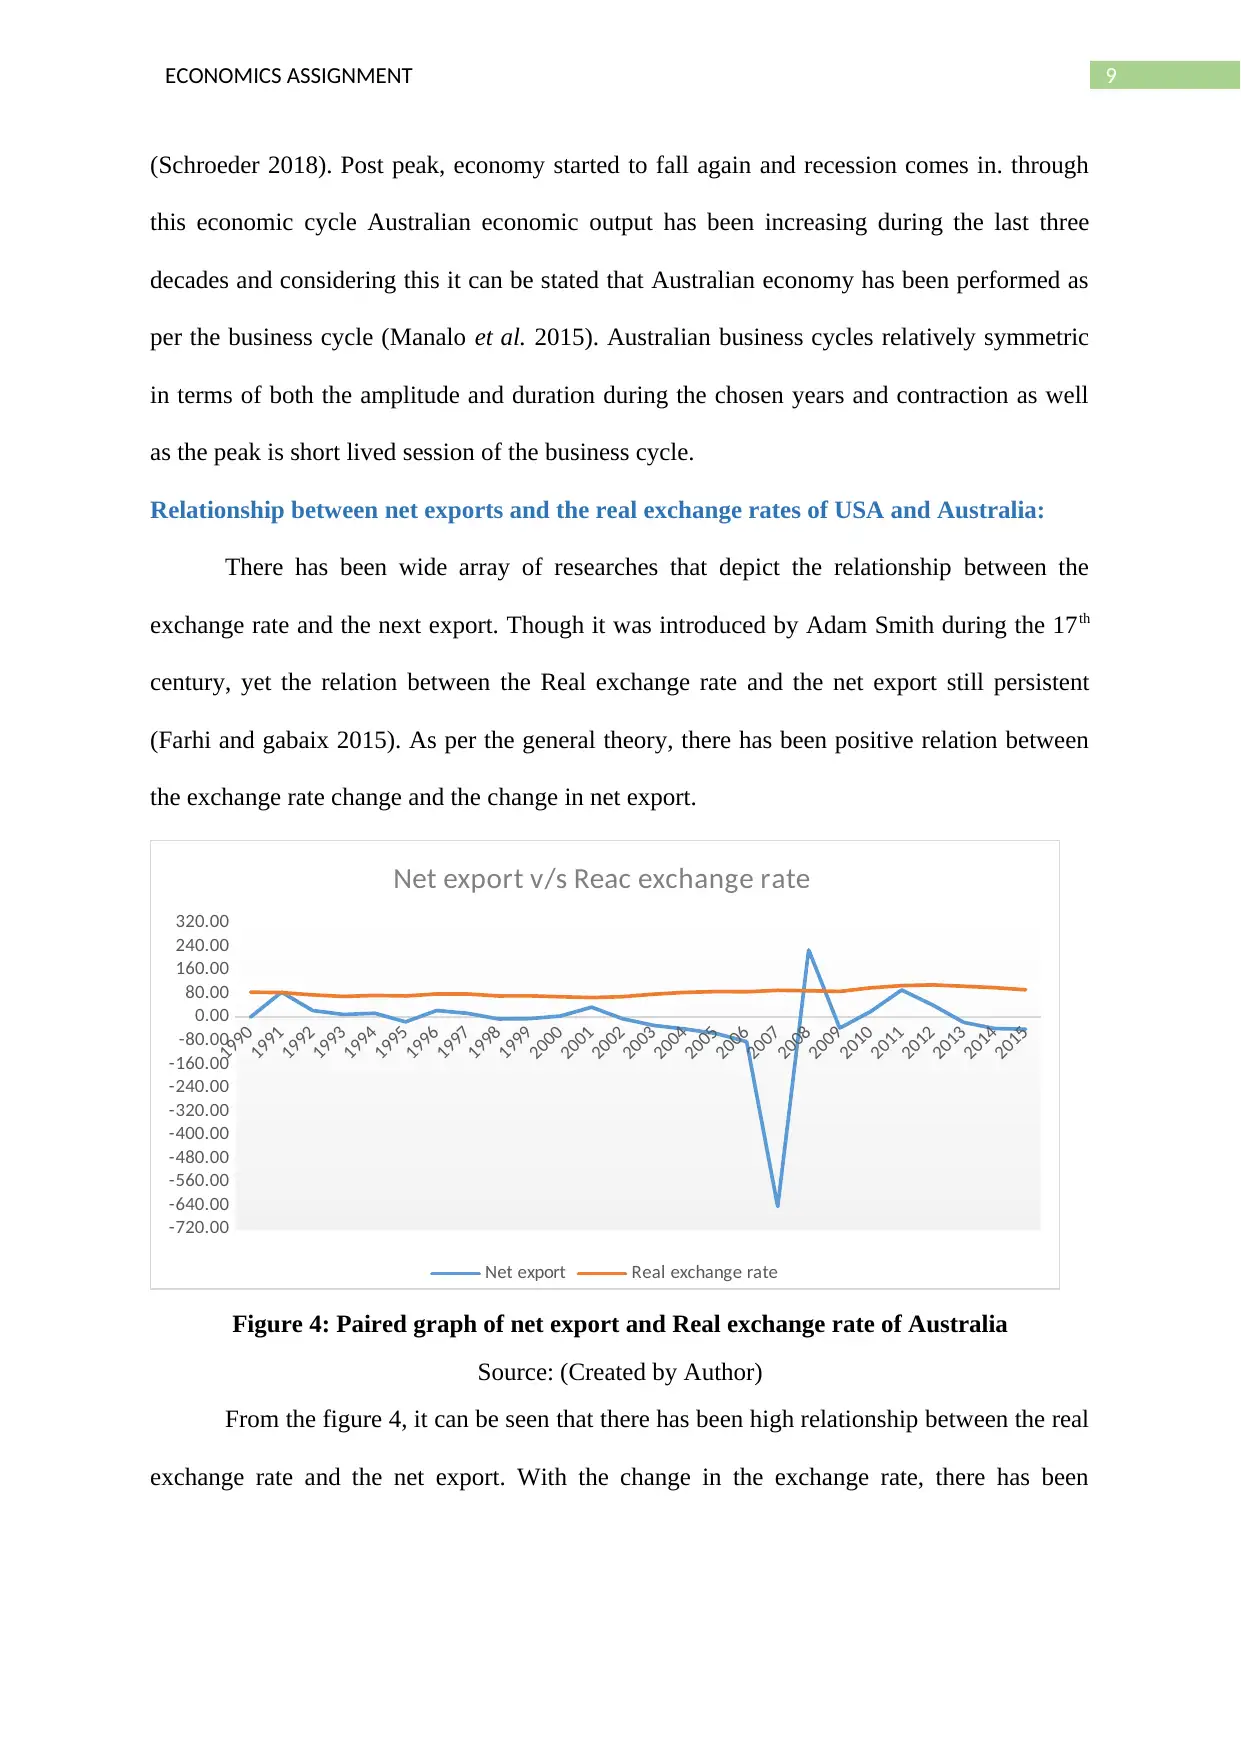
Relationship between net exports and the real exchange rates of USA and Australia:
There has been wide array of researches that depict the relationship between the
exchange rate and the next export. Though it was introduced by Adam Smith during the 17th
century, yet the relation between the Real exchange rate and the net export still persistent
(Farhi and gabaix 2015). As per the general theory, there has been positive relation between
the exchange rate change and the change in net export.
1990
1991
1992
1993
1994
1995
1996
1997
1998
1999
2000
2001
2002
2003
2004
2005
2006
2007
2008
2009
2010
2011
2012
2013
2014
2015
-720.00
-640.00
-560.00
-480.00
-400.00
-320.00
-240.00
-160.00
-80.00
0.00
80.00
160.00
240.00
320.00
Net export v/s Reac exchange rate
Net export Real exchange rate
Figure 4: Paired graph of net export and Real exchange rate of Australia
Source: (Created by Author)
From the figure 4, it can be seen that there has been high relationship between the real
exchange rate and the net export. With the change in the exchange rate, there has been
(Schroeder 2018). Post peak, economy started to fall again and recession comes in. through
this economic cycle Australian economic output has been increasing during the last three
decades and considering this it can be stated that Australian economy has been performed as
per the business cycle (Manalo et al. 2015). Australian business cycles relatively symmetric
in terms of both the amplitude and duration during the chosen years and contraction as well
as the peak is short lived session of the business cycle.
Relationship between net exports and the real exchange rates of USA and Australia:
There has been wide array of researches that depict the relationship between the
exchange rate and the next export. Though it was introduced by Adam Smith during the 17th
century, yet the relation between the Real exchange rate and the net export still persistent
(Farhi and gabaix 2015). As per the general theory, there has been positive relation between
the exchange rate change and the change in net export.
1990
1991
1992
1993
1994
1995
1996
1997
1998
1999
2000
2001
2002
2003
2004
2005
2006
2007
2008
2009
2010
2011
2012
2013
2014
2015
-720.00
-640.00
-560.00
-480.00
-400.00
-320.00
-240.00
-160.00
-80.00
0.00
80.00
160.00
240.00
320.00
Net export v/s Reac exchange rate
Net export Real exchange rate
Figure 4: Paired graph of net export and Real exchange rate of Australia
Source: (Created by Author)
From the figure 4, it can be seen that there has been high relationship between the real
exchange rate and the net export. With the change in the exchange rate, there has been
⊘ This is a preview!⊘
Do you want full access?
Subscribe today to unlock all pages.
Trusted by 1+ million students worldwide
10ECONOMICS ASSIGNMENT
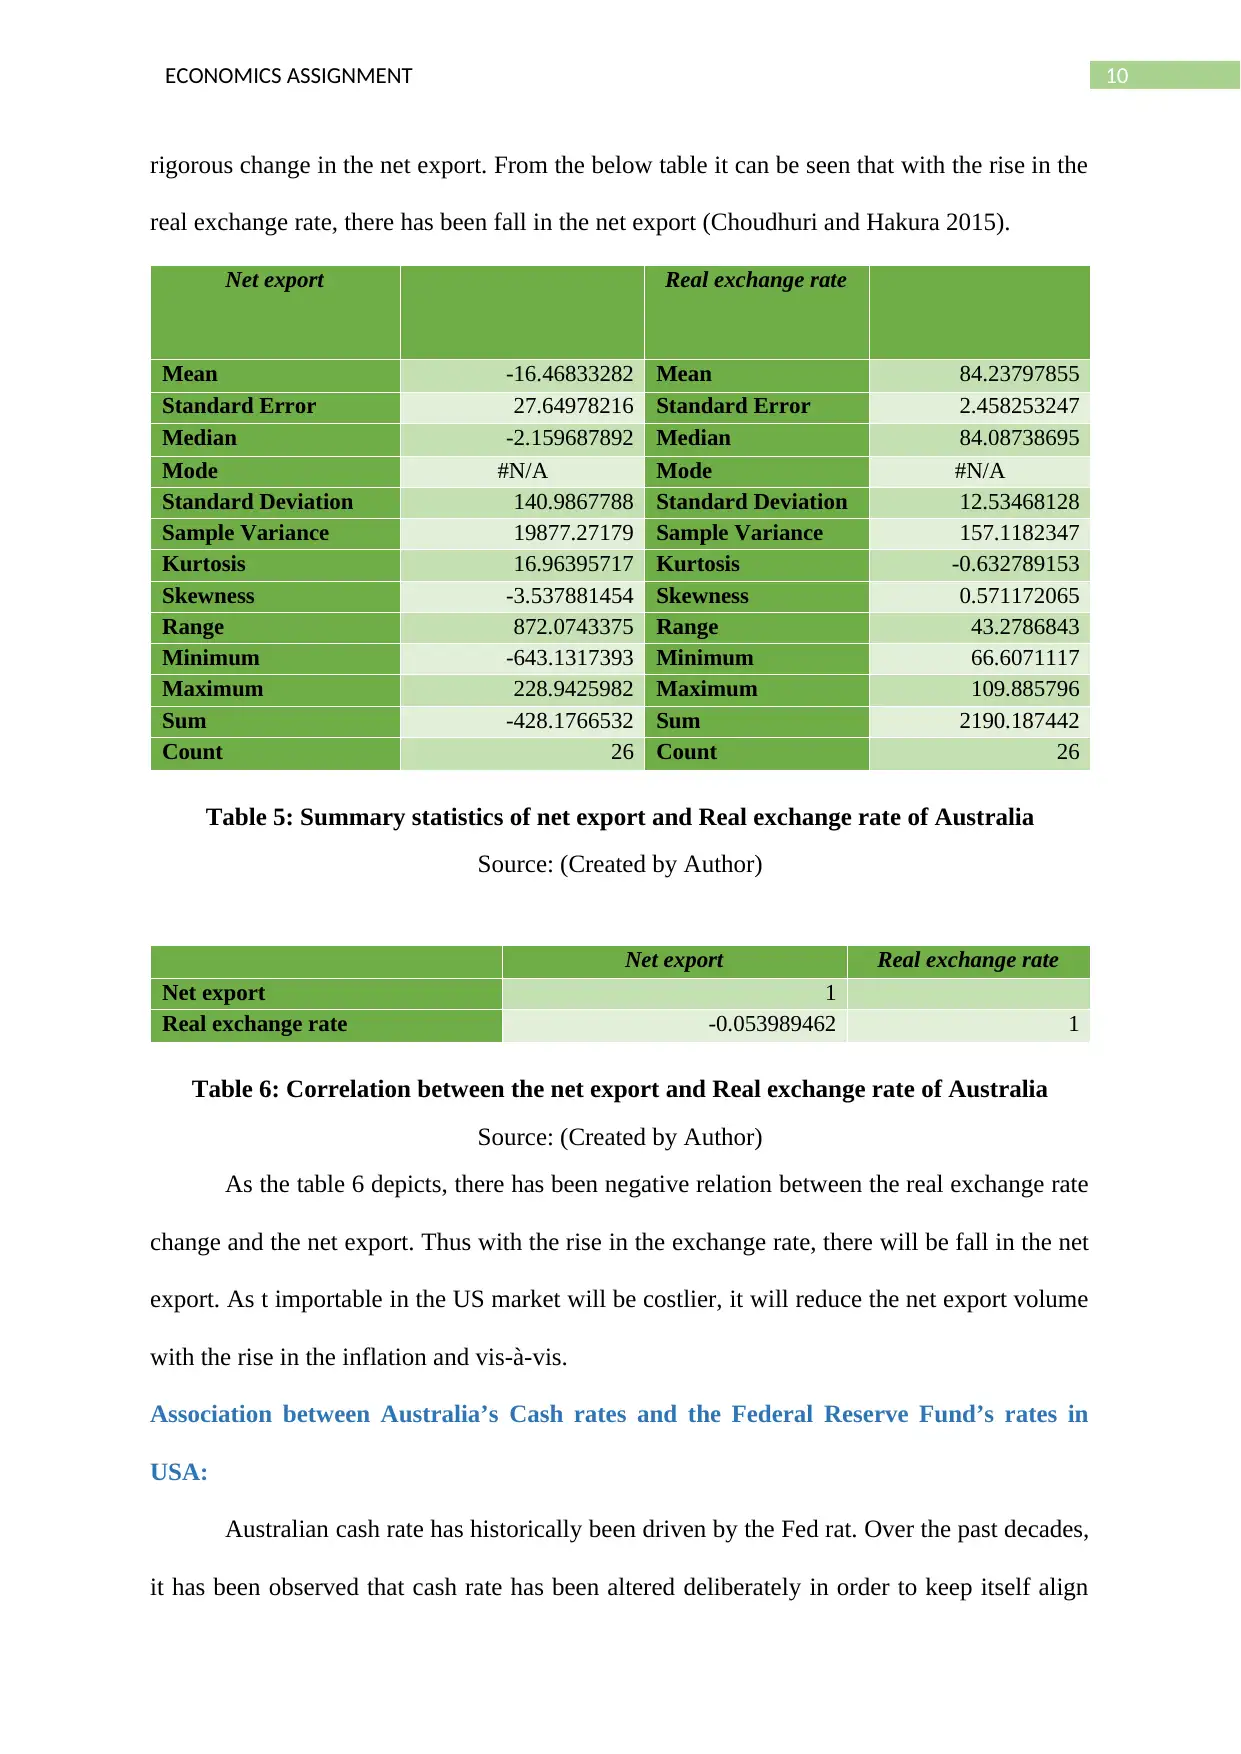
rigorous change in the net export. From the below table it can be seen that with the rise in the
real exchange rate, there has been fall in the net export (Choudhuri and Hakura 2015).
Net export Real exchange rate
Mean -16.46833282 Mean 84.23797855
Standard Error 27.64978216 Standard Error 2.458253247
Median -2.159687892 Median 84.08738695
Mode #N/A Mode #N/A
Standard Deviation 140.9867788 Standard Deviation 12.53468128
Sample Variance 19877.27179 Sample Variance 157.1182347
Kurtosis 16.96395717 Kurtosis -0.632789153
Skewness -3.537881454 Skewness 0.571172065
Range 872.0743375 Range 43.2786843
Minimum -643.1317393 Minimum 66.6071117
Maximum 228.9425982 Maximum 109.885796
Sum -428.1766532 Sum 2190.187442
Count 26 Count 26
Table 5: Summary statistics of net export and Real exchange rate of Australia
Source: (Created by Author)
Net export Real exchange rate
Net export 1
Real exchange rate -0.053989462 1
Table 6: Correlation between the net export and Real exchange rate of Australia
Source: (Created by Author)
As the table 6 depicts, there has been negative relation between the real exchange rate
change and the net export. Thus with the rise in the exchange rate, there will be fall in the net
export. As t importable in the US market will be costlier, it will reduce the net export volume
with the rise in the inflation and vis-à-vis.
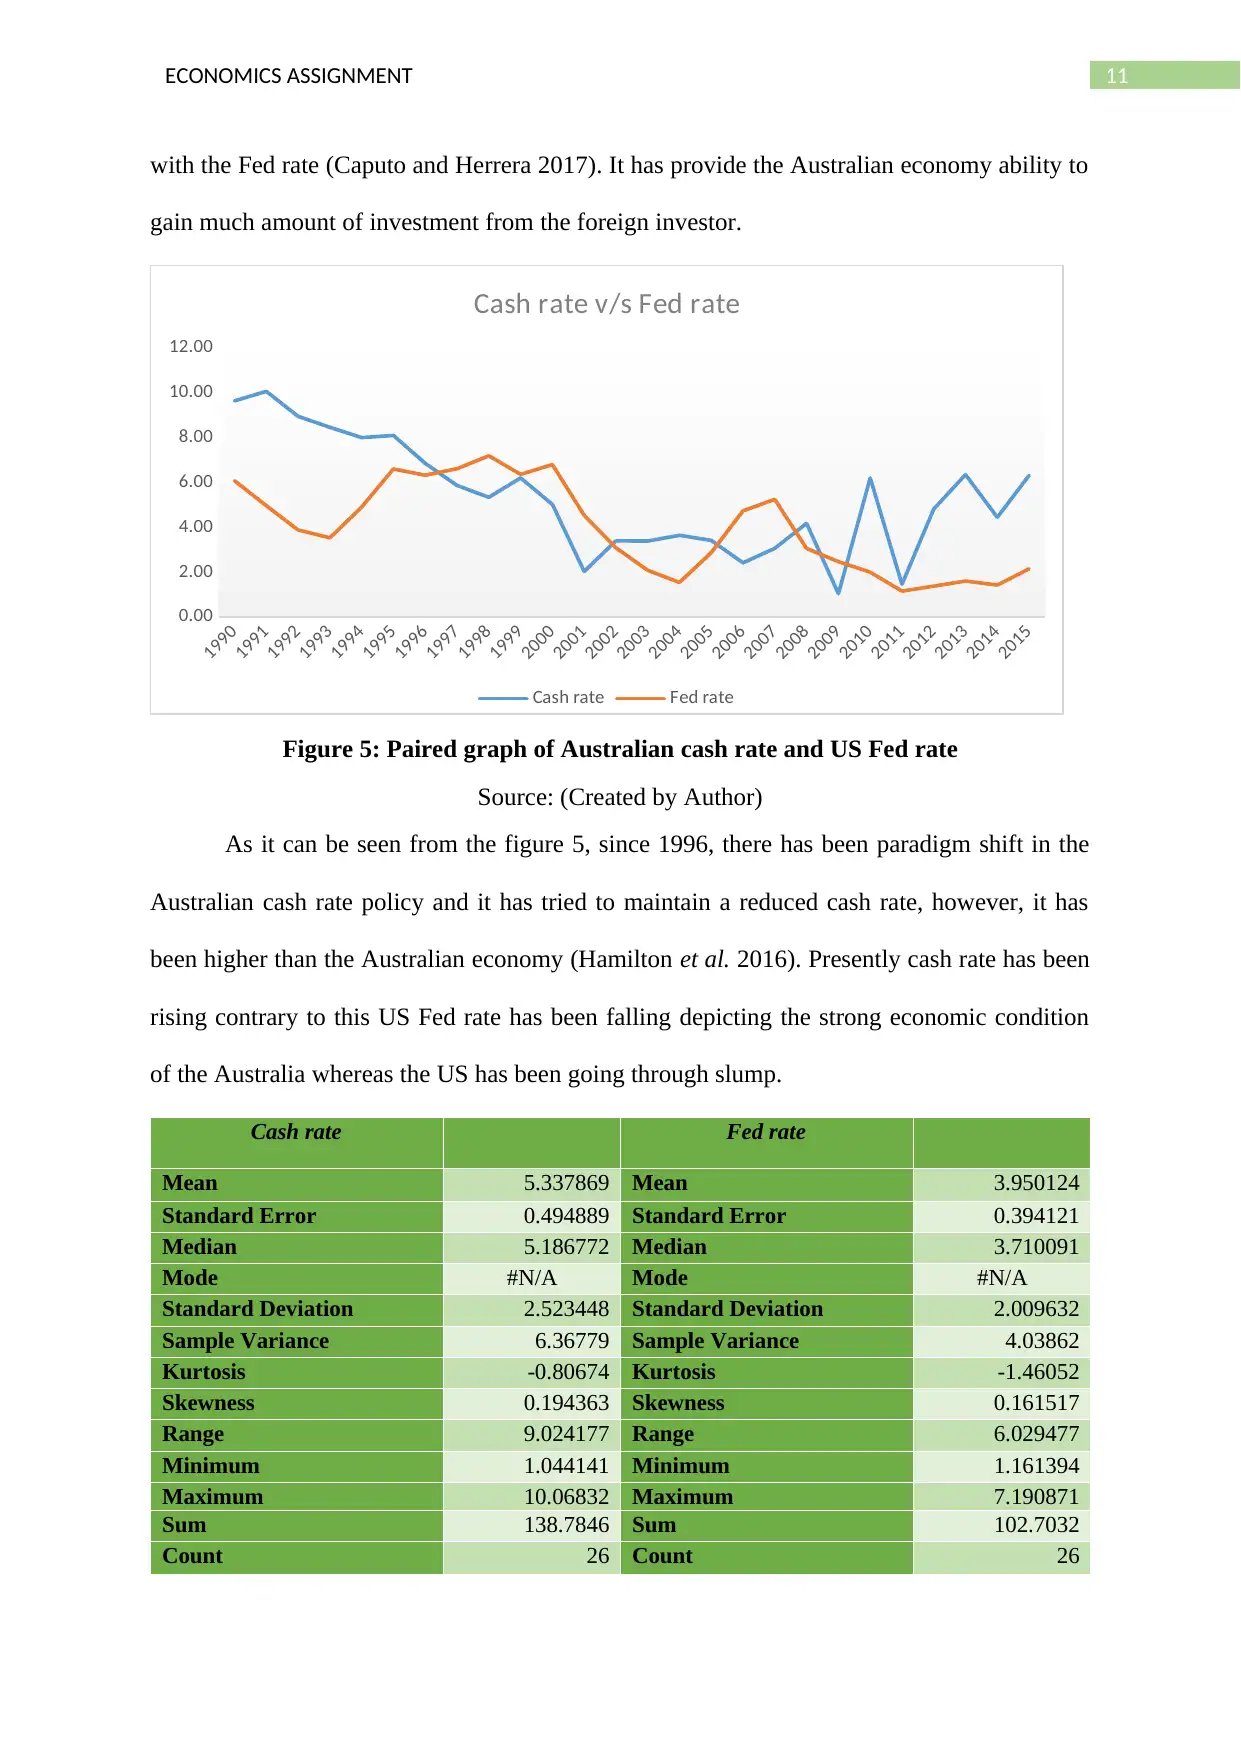
Association between Australia’s Cash rates and the Federal Reserve Fund’s rates in
USA:
Australian cash rate has historically been driven by the Fed rat. Over the past decades,
it has been observed that cash rate has been altered deliberately in order to keep itself align
rigorous change in the net export. From the below table it can be seen that with the rise in the
real exchange rate, there has been fall in the net export (Choudhuri and Hakura 2015).
Net export Real exchange rate
Mean -16.46833282 Mean 84.23797855
Standard Error 27.64978216 Standard Error 2.458253247
Median -2.159687892 Median 84.08738695
Mode #N/A Mode #N/A
Standard Deviation 140.9867788 Standard Deviation 12.53468128
Sample Variance 19877.27179 Sample Variance 157.1182347
Kurtosis 16.96395717 Kurtosis -0.632789153
Skewness -3.537881454 Skewness 0.571172065
Range 872.0743375 Range 43.2786843
Minimum -643.1317393 Minimum 66.6071117
Maximum 228.9425982 Maximum 109.885796
Sum -428.1766532 Sum 2190.187442
Count 26 Count 26
Table 5: Summary statistics of net export and Real exchange rate of Australia
Source: (Created by Author)
Net export Real exchange rate
Net export 1
Real exchange rate -0.053989462 1
Table 6: Correlation between the net export and Real exchange rate of Australia
Source: (Created by Author)
As the table 6 depicts, there has been negative relation between the real exchange rate
change and the net export. Thus with the rise in the exchange rate, there will be fall in the net
export. As t importable in the US market will be costlier, it will reduce the net export volume
with the rise in the inflation and vis-à-vis.
Association between Australia’s Cash rates and the Federal Reserve Fund’s rates in
USA:
Australian cash rate has historically been driven by the Fed rat. Over the past decades,
it has been observed that cash rate has been altered deliberately in order to keep itself align
Paraphrase This Document
Need a fresh take? Get an instant paraphrase of this document with our AI Paraphraser
11ECONOMICS ASSIGNMENT
with the Fed rate (Caputo and Herrera 2017). It has provide the Australian economy ability to
gain much amount of investment from the foreign investor.
1990
1991
1992
1993
1994
1995
1996
1997
1998
1999
2000
2001
2002
2003
2004
2005
2006
2007
2008
2009
2010
2011
2012
2013
2014
2015
0.00
2.00
4.00
6.00
8.00
10.00
12.00
Cash rate v/s Fed rate
Cash rate Fed rate
Figure 5: Paired graph of Australian cash rate and US Fed rate
Source: (Created by Author)
As it can be seen from the figure 5, since 1996, there has been paradigm shift in the
Australian cash rate policy and it has tried to maintain a reduced cash rate, however, it has
been higher than the Australian economy (Hamilton et al. 2016). Presently cash rate has been
rising contrary to this US Fed rate has been falling depicting the strong economic condition
of the Australia whereas the US has been going through slump.
Cash rate Fed rate
Mean 5.337869 Mean 3.950124
Standard Error 0.494889 Standard Error 0.394121
Median 5.186772 Median 3.710091
Mode #N/A Mode #N/A
Standard Deviation 2.523448 Standard Deviation 2.009632
Sample Variance 6.36779 Sample Variance 4.03862
Kurtosis -0.80674 Kurtosis -1.46052
Skewness 0.194363 Skewness 0.161517
Range 9.024177 Range 6.029477
Minimum 1.044141 Minimum 1.161394
Maximum 10.06832 Maximum 7.190871
Sum 138.7846 Sum 102.7032
Count 26 Count 26
12ECONOMICS ASSIGNMENT
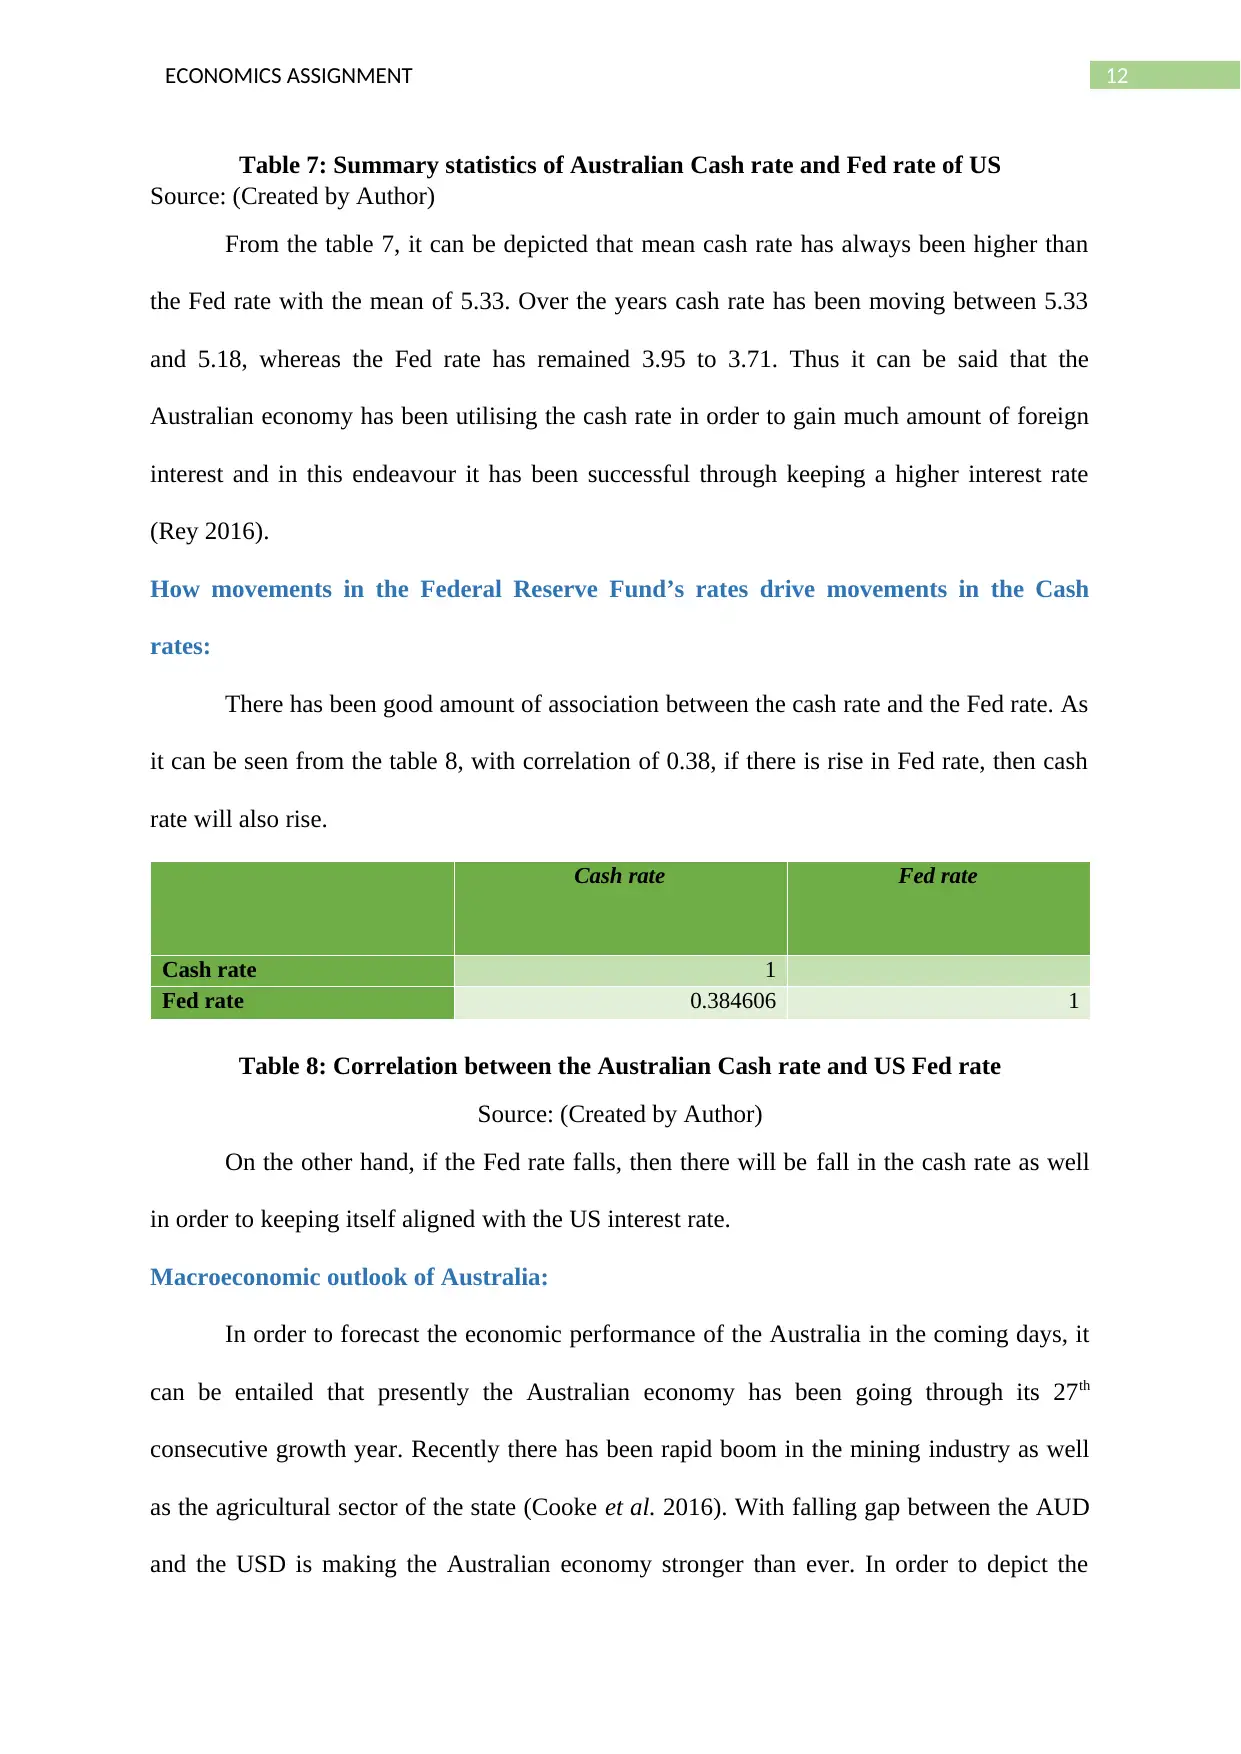
Table 7: Summary statistics of Australian Cash rate and Fed rate of US
Source: (Created by Author)
From the table 7, it can be depicted that mean cash rate has always been higher than
the Fed rate with the mean of 5.33. Over the years cash rate has been moving between 5.33
and 5.18, whereas the Fed rate has remained 3.95 to 3.71. Thus it can be said that the
Australian economy has been utilising the cash rate in order to gain much amount of foreign
interest and in this endeavour it has been successful through keeping a higher interest rate
(Rey 2016).
How movements in the Federal Reserve Fund’s rates drive movements in the Cash
rates:
There has been good amount of association between the cash rate and the Fed rate. As
it can be seen from the table 8, with correlation of 0.38, if there is rise in Fed rate, then cash
rate will also rise.
Cash rate Fed rate
Cash rate 1
Fed rate 0.384606 1
Table 8: Correlation between the Australian Cash rate and US Fed rate
Source: (Created by Author)
On the other hand, if the Fed rate falls, then there will be fall in the cash rate as well
in order to keeping itself aligned with the US interest rate.
Macroeconomic outlook of Australia:
In order to forecast the economic performance of the Australia in the coming days, it
can be entailed that presently the Australian economy has been going through its 27th
consecutive growth year. Recently there has been rapid boom in the mining industry as well
as the agricultural sector of the state (Cooke et al. 2016). With falling gap between the AUD
and the USD is making the Australian economy stronger than ever. In order to depict the
⊘ This is a preview!⊘
Do you want full access?
Subscribe today to unlock all pages.
Trusted by 1+ million students worldwide
1 out of 17
Related Documents


Your All-in-One AI-Powered Toolkit for Academic Success.
+13062052269
info@desklib.com
Available 24*7 on WhatsApp / Email
![[object Object]](/_next/static/media/star-bottom.7253800d.svg)
Unlock your academic potential
Copyright © 2020–2026 A2Z Services. All Rights Reserved. Developed and managed by ZUCOL.