Analyzing Business Cycles in Australia: Causes, Policies, and Outcomes
VerifiedAdded on 2020/02/24
|19
|3122
|61
Report
AI Summary
This report provides a comprehensive analysis of business cycles in Australia, exploring the causes of recessions and booms, including factors such as terms of trade, global capital markets, and monetary policies. It examines the consequences of these cycles, including impacts on unemployment and economic growth. The report delves into the specific factors contributing to Australia's economic expansion, such as floating exchange rates, productivity growth, and the housing boom. Furthermore, it compares the monetary and fiscal policy interventions during the Global Financial Crisis with those of the Great Depression, assessing their effectiveness and limitations. The analysis incorporates data and graphs to illustrate key economic trends and policy impacts, providing a detailed overview of Australia's economic performance and policy responses to cyclical fluctuations.
Word count: 2136 BUSINESS CYCLES 1
BUSINESS CYCLES
By (Name)
Name of the class (course)
The Course instructor (Professor)
The Institution
The City and State location
The Date
BUSINESS CYCLES
By (Name)
Name of the class (course)
The Course instructor (Professor)
The Institution
The City and State location
The Date
Paraphrase This Document
Need a fresh take? Get an instant paraphrase of this document with our AI Paraphraser
BUSINESS CYCLES 2
Table of Contents
1.0. Introduction...........................................................................................................................3
2.0. Literature Review.................................................................................................................3
3.0. Business Cycles in Australia................................................................................................4
3.1. Causes of Recessions........................................................................................................4
3.1.1. Deterioration in Terms of Trade................................................................................4
3.1.2. Global Capital Markets..............................................................................................5
3.1.3. Tighter Monetary and Fiscal Policies........................................................................5
3.2. Causes of Booms...............................................................................................................6
3.2.1. Floating Exchange Rate.............................................................................................7
3.2.2. Growth in Productivity..............................................................................................7
3.2.3. The Housing Boom....................................................................................................8
3.2.4. Export Growth...........................................................................................................9
3.3. Consequences of Business Cycles..................................................................................10
4.0. Did the monetary and fiscal instruments interventions of GCF differ from those of 1930s
Great Depression?..........................................................................................................................11
4.1. Monetary Policy..............................................................................................................11
4.2. Fiscal Policy....................................................................................................................13
4.3. Effectiveness of the Policies...........................................................................................13
4.4. Limitations of the Policies..............................................................................................14

BUSINESS CYCLES 3
Conclusion.....................................................................................................................................15
Bibliography..................................................................................................................................16
Conclusion.....................................................................................................................................15
Bibliography..................................................................................................................................16
⊘ This is a preview!⊘
Do you want full access?
Subscribe today to unlock all pages.
Trusted by 1+ million students worldwide
BUSINESS CYCLES 4
1.0. Introduction
Countries across the globe experience ups and downs in the economic activity. In some
years, a good number of industries operate below capacity and unemployment surges while in
other years industries booms and unemployment reduce. The period of economic downturn is
referred to as recession and moments of economic prosperity is known as booms or expansions
(Arnold, 2013, p.56). Therefore, this paper explores the causes and outcomes of business cycles
in Australia. The application, effectiveness, and limitations of monetary and fiscal instruments in
stabilizing the economy are also discussed. Besides, this study seeks to understand whether the
economic policies applied by Australia during the Global Financial Crises differed from those
used during Great Depression of the 1930s.
2.0. Literature Review
Studies show that a variety of factors are responsible for business cycles encountered in
an economy. Some of the factors include interest rates, consumer and business confidence, and
the multiplier effect. Interest rates directly impact the consumer expenditure and finally
economic growth. When the interest rates are cut, individuals borrow more money resulting in a
higher spending and increase in economic growth. On the other hand, a hike in the cost of
borrowing results in a decline in household consumption and investments and hence economic
downturn (Sloman et al., 2015, p.42).
Some economists also attribute the business cycles to consumer and investor confidence.
During the recovery phase, the consumers and investors are confident and optimistic, and thus
they increase their consumption and investment causing economic growth. Since consumption
Paraphrase This Document
Need a fresh take? Get an instant paraphrase of this document with our AI Paraphraser
BUSINESS CYCLES 5
and investments contribute significantly to the Gross Domestic Product, when the confidence in
economy drops, an economy is likely to go into recession.
Moreover, according to the multiplier effect, a reduction in injections is likely to cause a
significant decline in the real Gross Domestic Product. For instance, if government scales back
public expenditure, there will be a drop in the aggregate demand and an increase in
unemployment. The demand of products in the economy will also decrease as a result of
joblessness causing a recession (MAY LI & SPENCER, 2016, p.95). Similarly, a positive
injection such as an increase in government investments leads to a progressive effect on the
economy.
The impacts of the business cycle on the economy differ during boom and recessions.
During expansion, the businesses grow to create more jobs and hence a decline in unemployment
rate. The increase in the incomes of individuals will also exert pressure on goods and services
resulting in inflation and finally depreciation in the country’s currency. On the contrary, an
economy shrinks during the recession. A decline in economic output during contraction stage of
business cycle results increase in unemployment (Arnold, 2013, p.59). Therefore, the
governments should intervene through appropriate policies to minimize the impacts of business
cycles.
3.0. Business Cycles in Australia
3.1. Causes of Recessions
3.1.1. Deterioration in Terms of Trade
Australia encountered a significant and sustained drop in the terms of trade during the
mid-1920s. This scenario resulted from a decline in prices of Australia’s leading agricultural
BUSINESS CYCLES 6
exports, especially wool. This problem was made worse by Australia’s reliance on the gold
standard. In 1925, the Chancellor of the Exchequer, Winston Churchill, reinstated the Great
Britain to the gold standard. This move resulted in an overstatement of gold price making the
exports of British expensive in the global market. Since Australia pound was prized in
connection to the pound sterling, its exports were also affected. The prices of wool decreased
gradually from the mid-1920s, and that of wheat also declined sharply from 1930 and hence
depression. The drop in metal export prices in 1982 also made Australia’s economy to contract
by 2.23% (Australian Government, 2015).
3.1.2. Global Capital Markets
In the 1920s, the government of Australia borrowed a lot from the capital market of
London. Most of the borrowed money was used in the development of public infrastructure.
However, the growing British worries concerning poor investment returns in 1929, made London
stop lending to Australia. The banks in London then started pressuring the government of
Australia to remit payments on overdrafts (The National Museum of Australia, 2017). Moreover,
banks in Australia restricted loans to the local economy thus worsening the situation.
3.1.3. Tighter Monetary and Fiscal Policies
Studies show that the 1991 recession in Australia was caused by tighter monetary and
budgetary policies. During this period, Australia’s economy declined by 0.38% (The World
Bank, 2017). The focus on current account deficit made the government slow and reluctant to
ease monetary and fiscal policy. Therefore, the contractionary shock and the general drop in
world economic caused an economic downturn in Australia.
⊘ This is a preview!⊘
Do you want full access?
Subscribe today to unlock all pages.
Trusted by 1+ million students worldwide
BUSINESS CYCLES 7
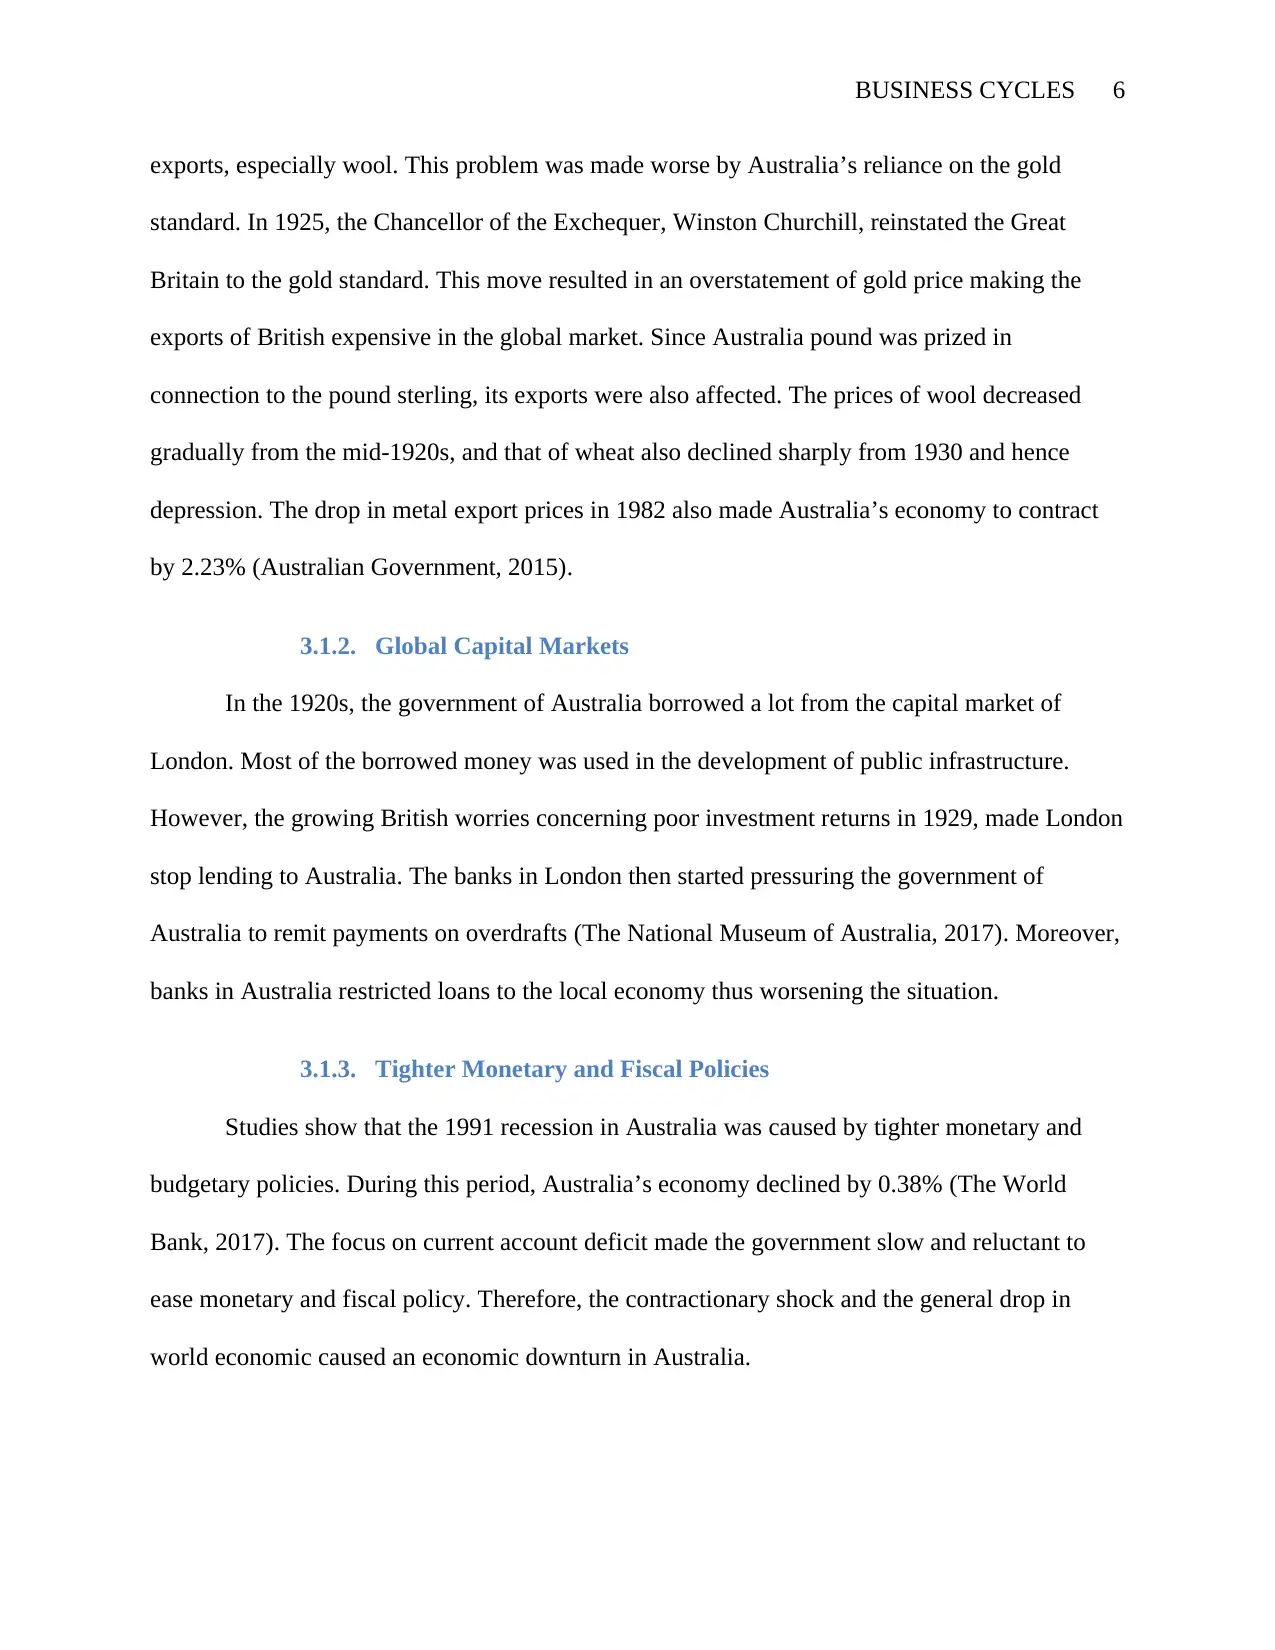
AS-AD model
Price level
Real GDP (Y)
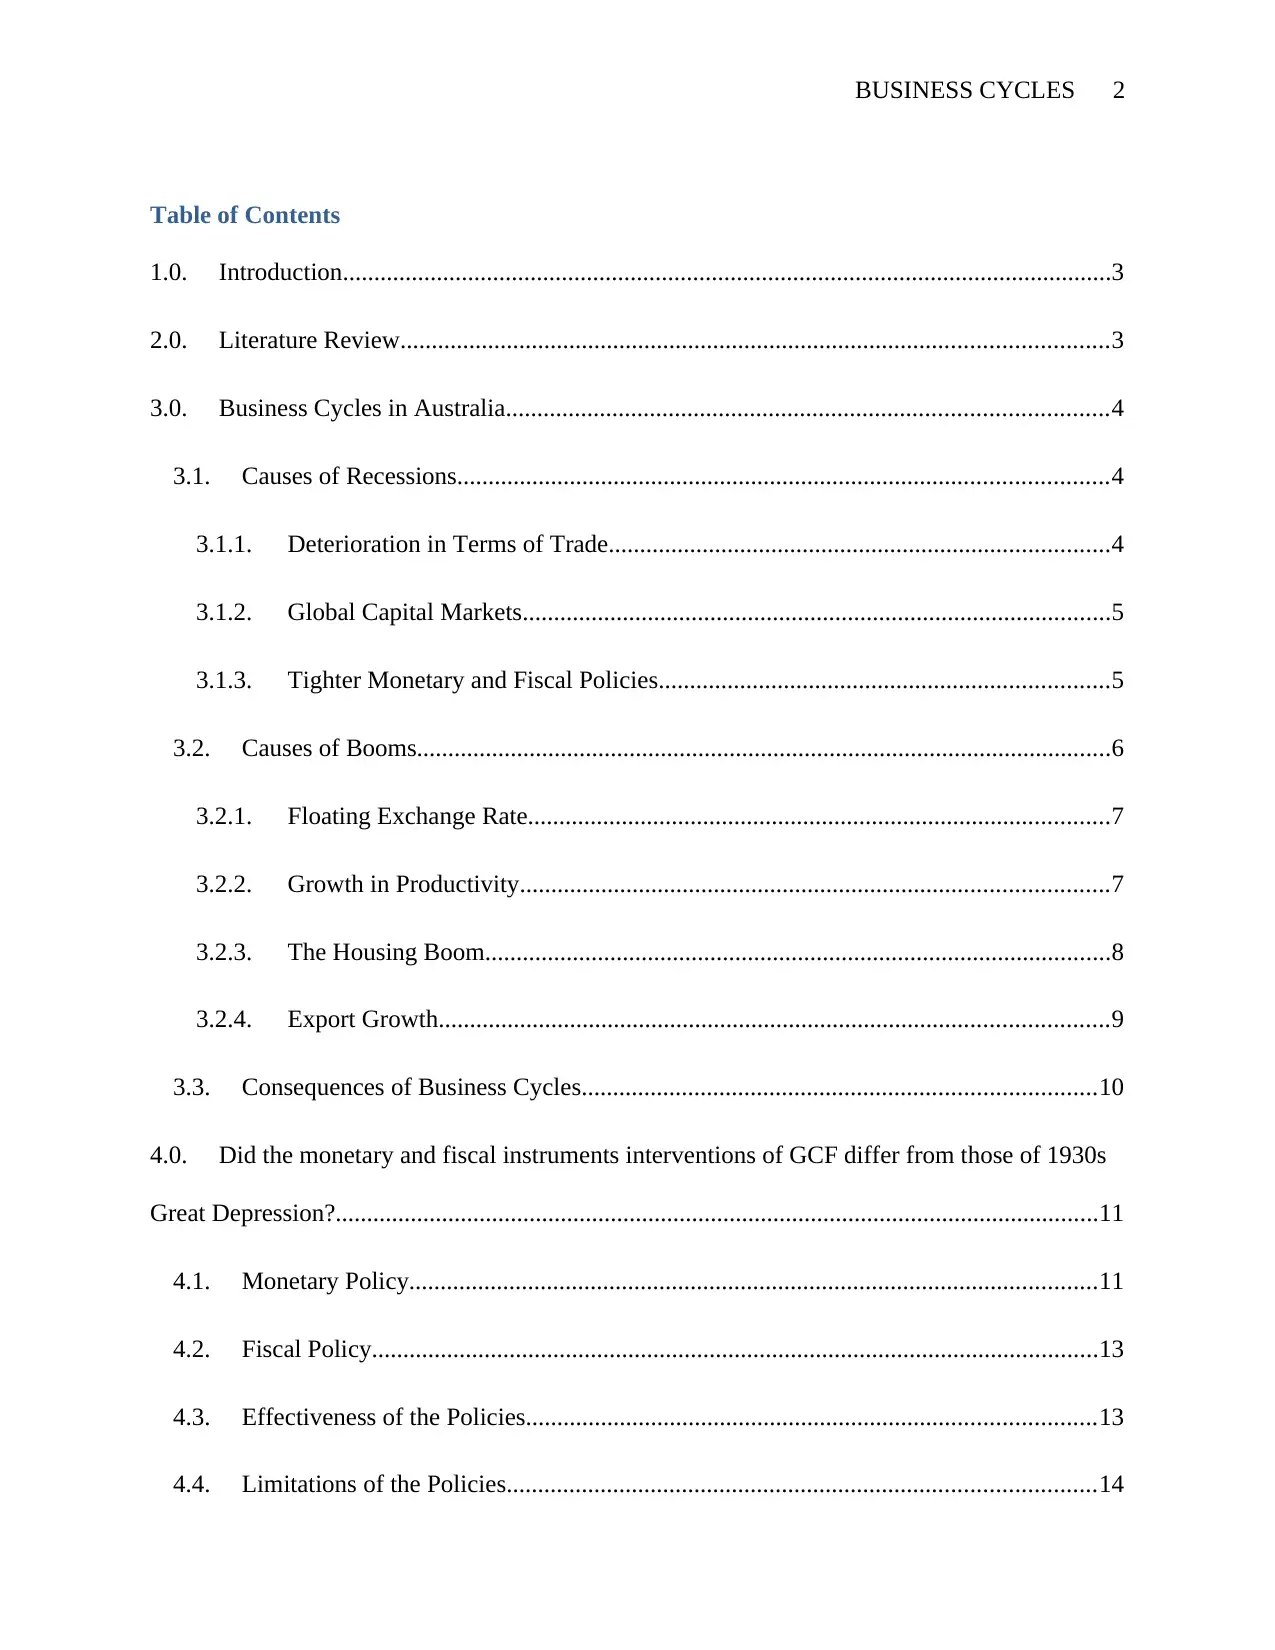
The use of contractionary monetary and fiscal instruments by the government reduced the
buying power in the economy. The scenario is depicted by the shift in the aggregate demand
from AD1 to AD. Consequently, real Gross Domestic Product declined from Y2 to Y1 and the
general price also dropped from P2 to P1.
3.2. Causes of Booms
Since the recession of 1991, Australia has maintained a remarkable economic expansion
unmarred by the recession. Even during the global financial crisis of 2008/2009, Australia’s
economy did not experience economic downturn. In 2008, the country’s economy grew by
3.70% and in 2009 by 1.81% (The World Bank, 2017). Some of the factors that have caused
economic progress in this country include, floating exchange rate, growth in productivity, the
housing boom, household consumption, exports,
AS
P2
P1
AD 1
AD
Y1 Y2
AS-AD model
Price level
Real GDP (Y)
The use of contractionary monetary and fiscal instruments by the government reduced the
buying power in the economy. The scenario is depicted by the shift in the aggregate demand
from AD1 to AD. Consequently, real Gross Domestic Product declined from Y2 to Y1 and the
general price also dropped from P2 to P1.
3.2. Causes of Booms
Since the recession of 1991, Australia has maintained a remarkable economic expansion
unmarred by the recession. Even during the global financial crisis of 2008/2009, Australia’s
economy did not experience economic downturn. In 2008, the country’s economy grew by
3.70% and in 2009 by 1.81% (The World Bank, 2017). Some of the factors that have caused
economic progress in this country include, floating exchange rate, growth in productivity, the
housing boom, household consumption, exports,
AS
P2
P1
AD 1
AD
Y1 Y2
Paraphrase This Document
Need a fresh take? Get an instant paraphrase of this document with our AI Paraphraser
BUSINESS CYCLES 8
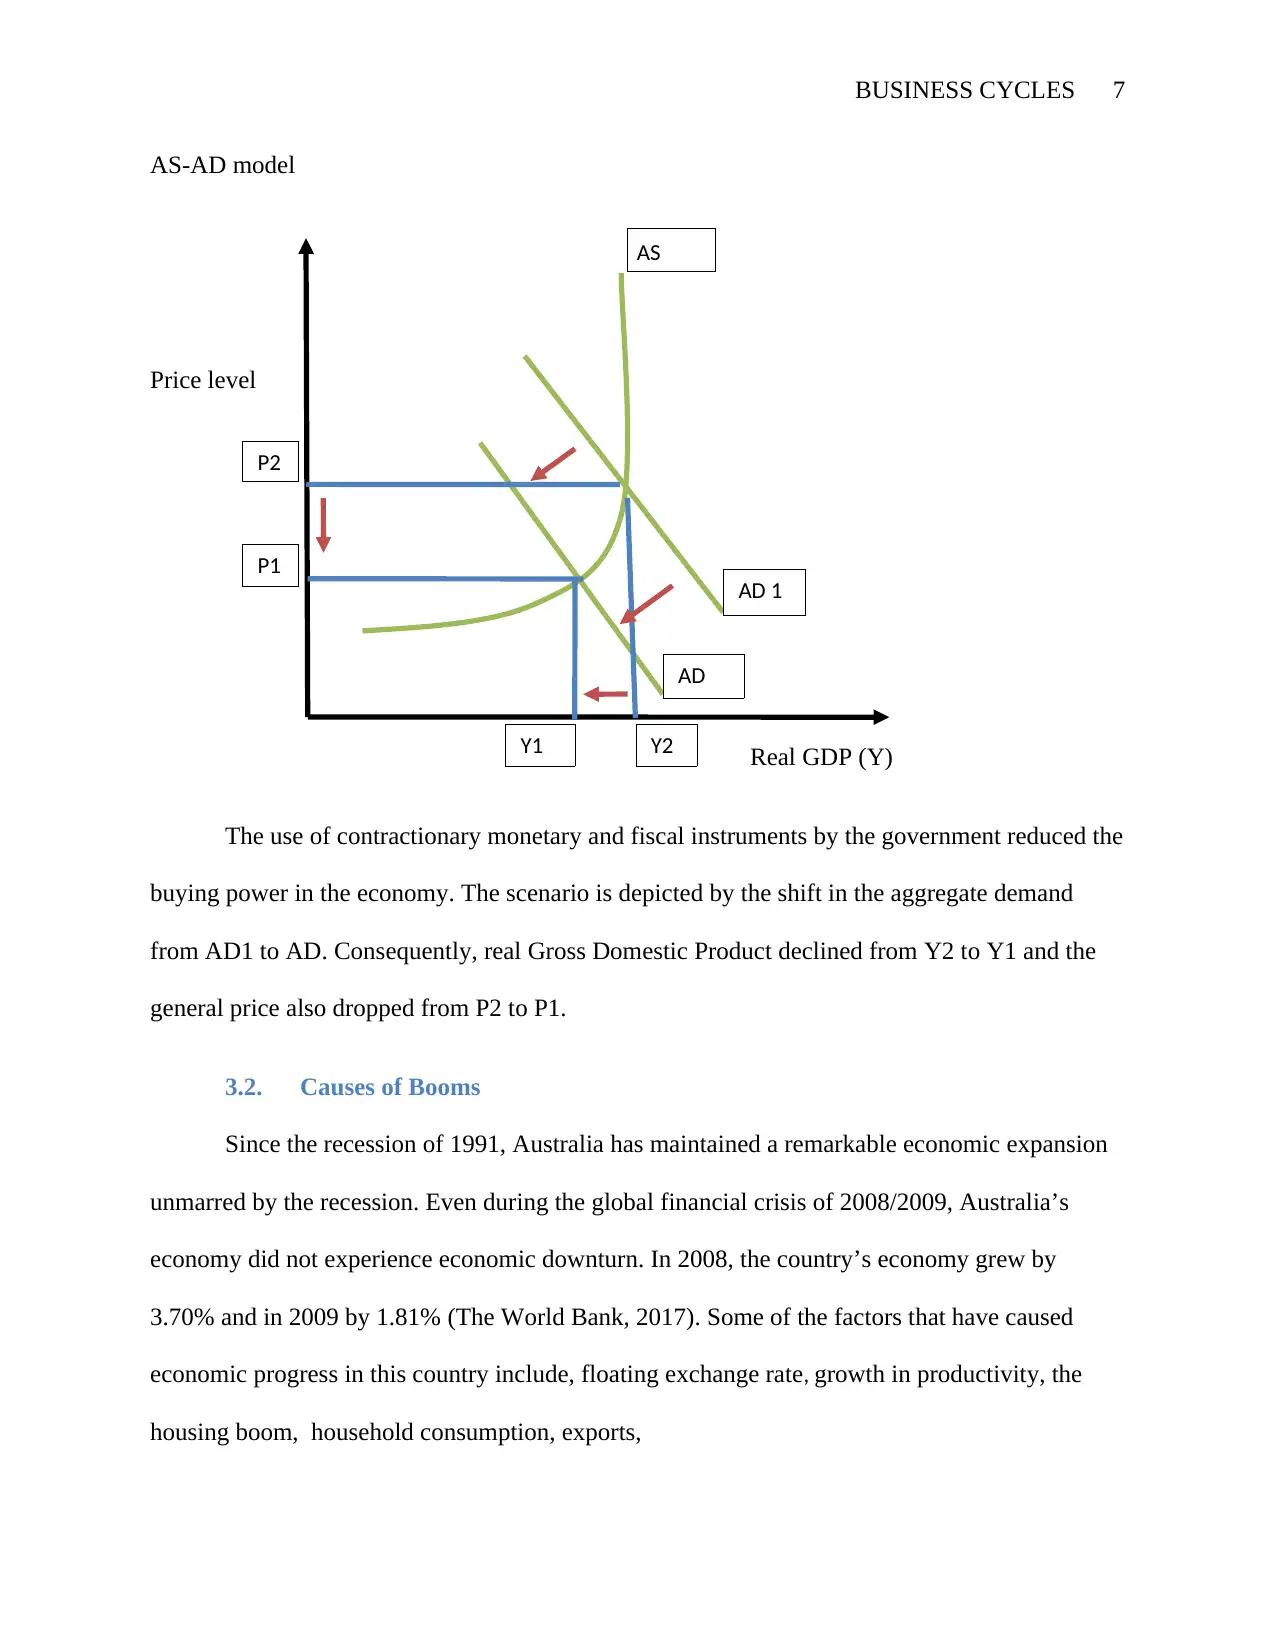
3.2.1. Floating Exchange Rate
The Australian dollar has performed a critical countercyclical function by falling and
rising in response to several external occurrences that would have destabilized the domestic
economy. For example, during the dot-com bubble and Asian crisis, the Australian dollar
declined sharply in reaction to worsening economic conditions in overseas thus shielding the
local economy. Also, the Australian dollar appreciated robustly between 2006 and 2008 as the
commodity price increased (RESERVE BANK OF AUSTRALIA, 2017). This occurrence
played a significant role in dissipating pressure thus preventing the economy from overheating.
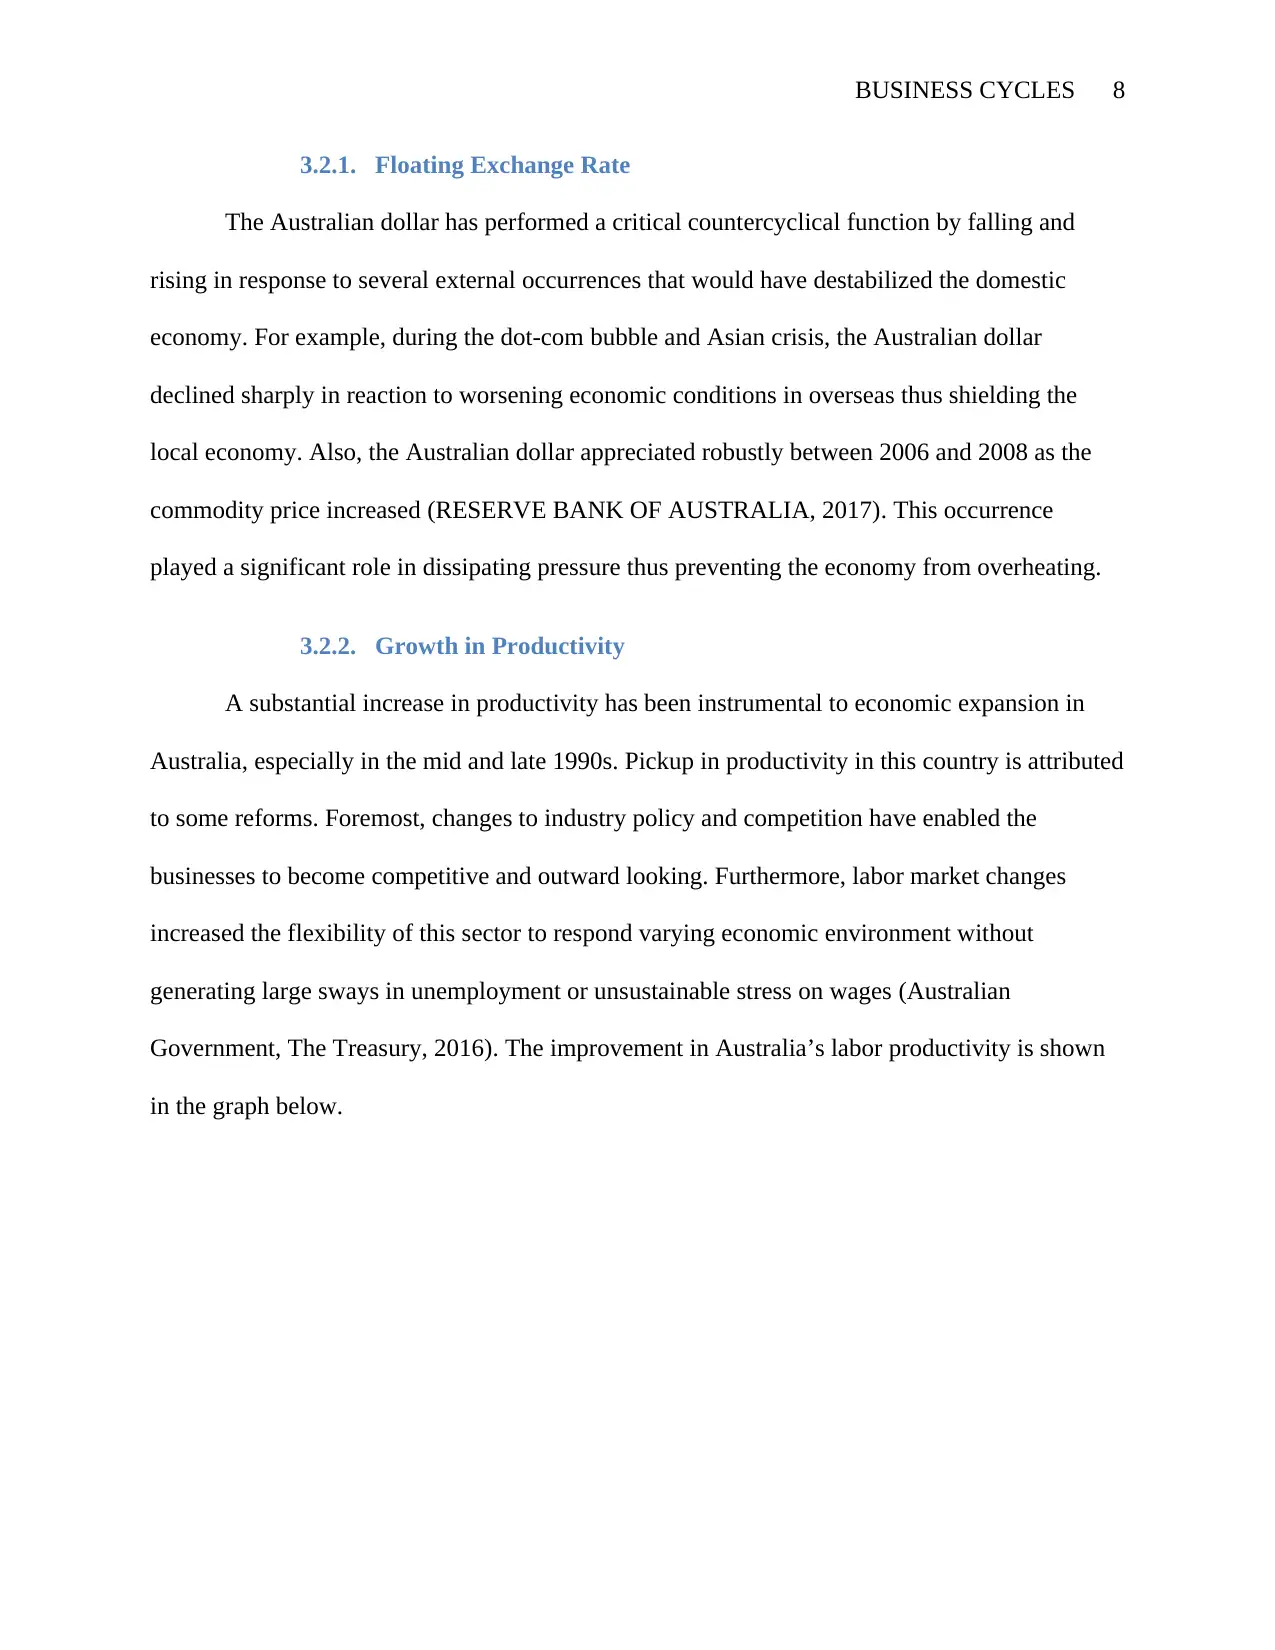
3.2.2. Growth in Productivity
A substantial increase in productivity has been instrumental to economic expansion in
Australia, especially in the mid and late 1990s. Pickup in productivity in this country is attributed
to some reforms. Foremost, changes to industry policy and competition have enabled the
businesses to become competitive and outward looking. Furthermore, labor market changes
increased the flexibility of this sector to respond varying economic environment without
generating large sways in unemployment or unsustainable stress on wages (Australian
Government, The Treasury, 2016). The improvement in Australia’s labor productivity is shown
in the graph below.
3.2.1. Floating Exchange Rate
The Australian dollar has performed a critical countercyclical function by falling and
rising in response to several external occurrences that would have destabilized the domestic
economy. For example, during the dot-com bubble and Asian crisis, the Australian dollar
declined sharply in reaction to worsening economic conditions in overseas thus shielding the
local economy. Also, the Australian dollar appreciated robustly between 2006 and 2008 as the
commodity price increased (RESERVE BANK OF AUSTRALIA, 2017). This occurrence
played a significant role in dissipating pressure thus preventing the economy from overheating.
3.2.2. Growth in Productivity
A substantial increase in productivity has been instrumental to economic expansion in
Australia, especially in the mid and late 1990s. Pickup in productivity in this country is attributed
to some reforms. Foremost, changes to industry policy and competition have enabled the
businesses to become competitive and outward looking. Furthermore, labor market changes
increased the flexibility of this sector to respond varying economic environment without
generating large sways in unemployment or unsustainable stress on wages (Australian
Government, The Treasury, 2016). The improvement in Australia’s labor productivity is shown
in the graph below.
BUSINESS CYCLES 9
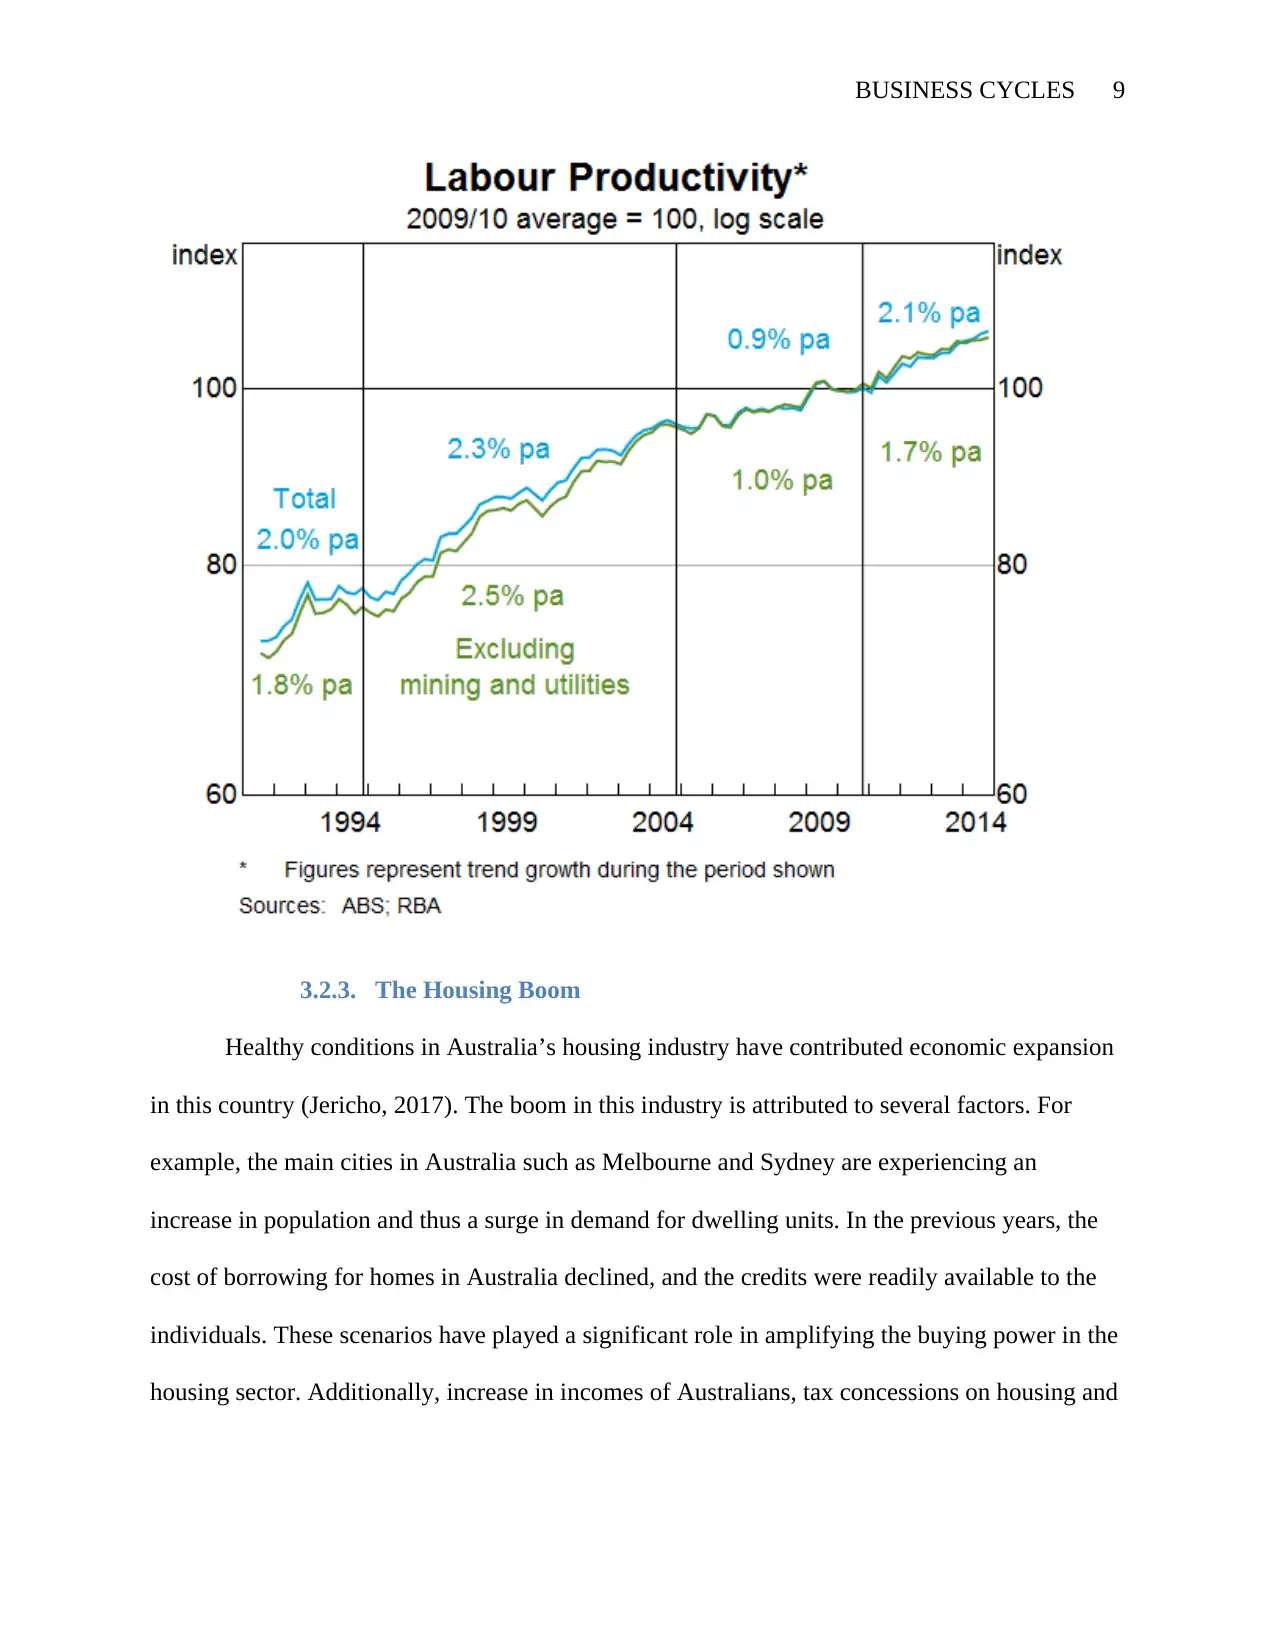
3.2.3. The Housing Boom
Healthy conditions in Australia’s housing industry have contributed economic expansion
in this country (Jericho, 2017). The boom in this industry is attributed to several factors. For
example, the main cities in Australia such as Melbourne and Sydney are experiencing an
increase in population and thus a surge in demand for dwelling units. In the previous years, the
cost of borrowing for homes in Australia declined, and the credits were readily available to the
individuals. These scenarios have played a significant role in amplifying the buying power in the
housing sector. Additionally, increase in incomes of Australians, tax concessions on housing and
⊘ This is a preview!⊘
Do you want full access?
Subscribe today to unlock all pages.
Trusted by 1+ million students worldwide
BUSINESS CYCLES 10
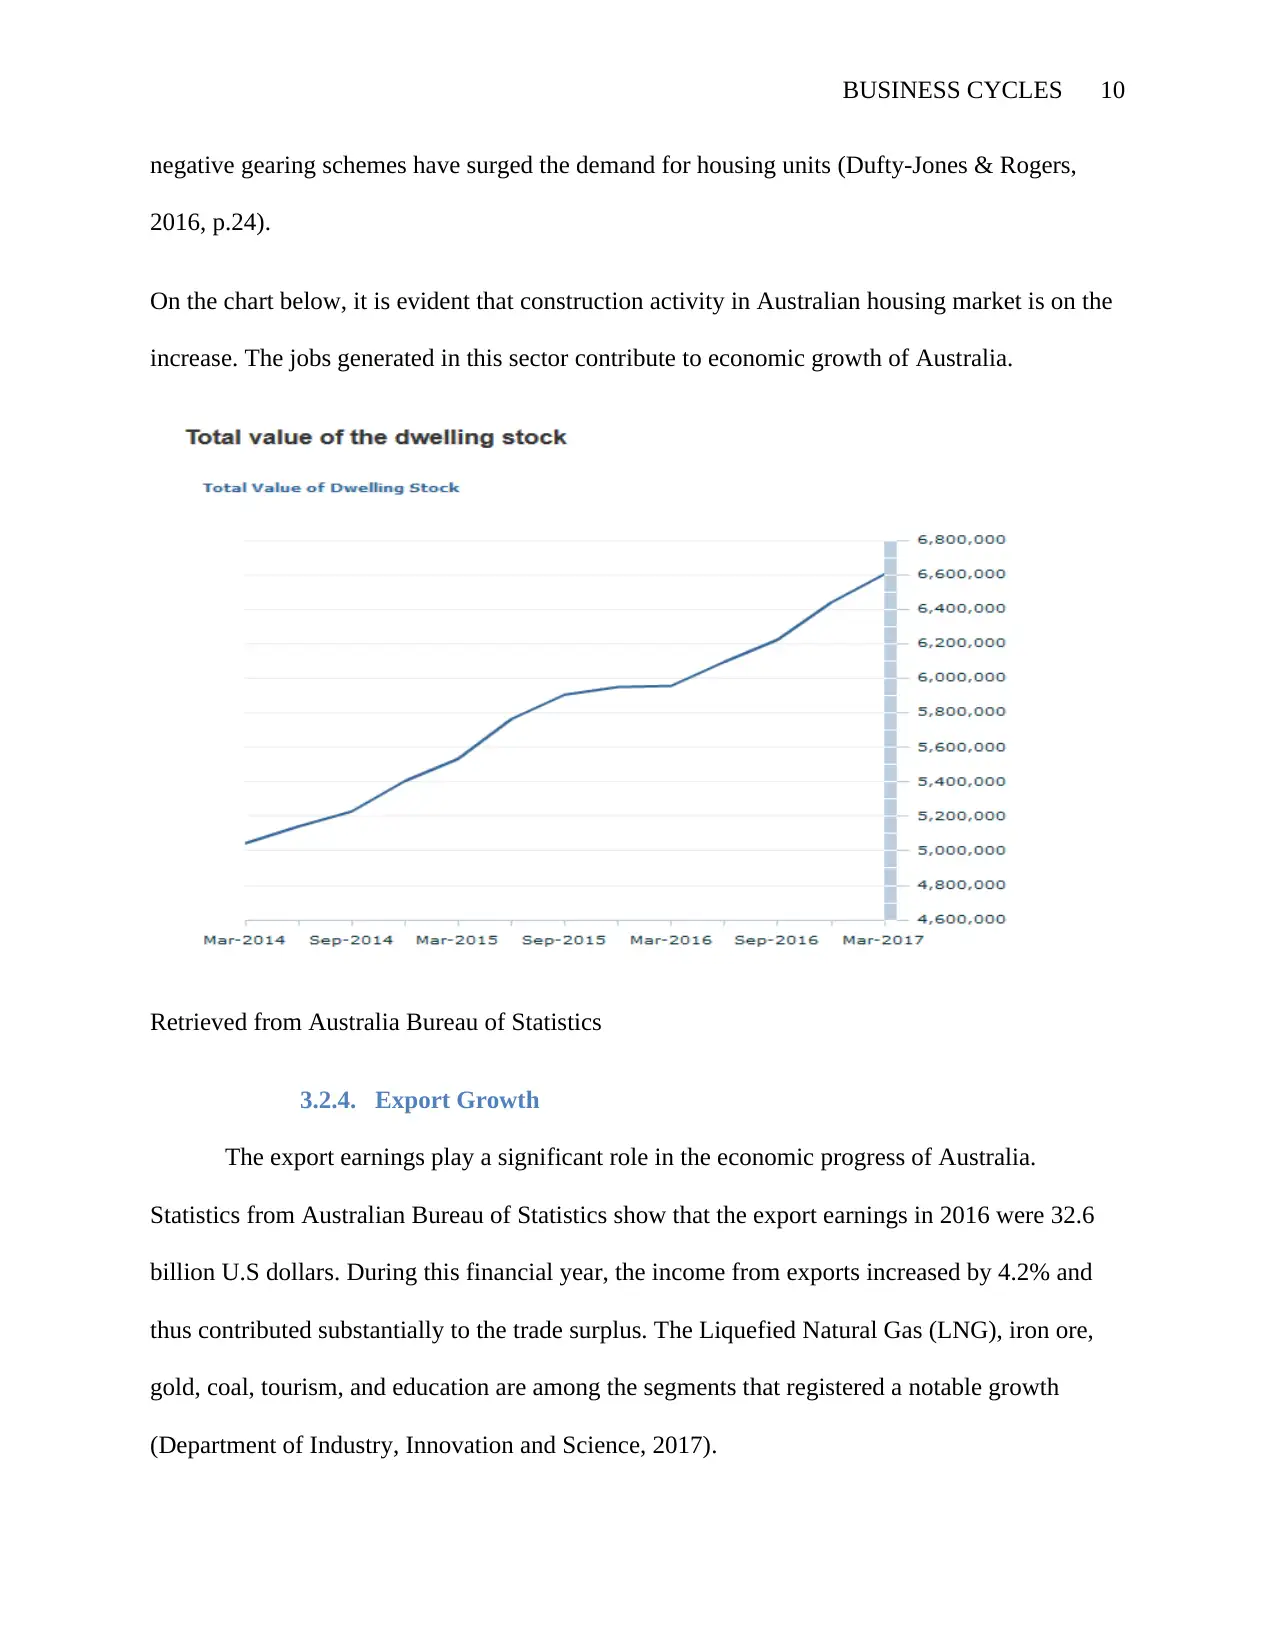
negative gearing schemes have surged the demand for housing units (Dufty-Jones & Rogers,
2016, p.24).
On the chart below, it is evident that construction activity in Australian housing market is on the
increase. The jobs generated in this sector contribute to economic growth of Australia.
Retrieved from Australia Bureau of Statistics
3.2.4. Export Growth
The export earnings play a significant role in the economic progress of Australia.
Statistics from Australian Bureau of Statistics show that the export earnings in 2016 were 32.6
billion U.S dollars. During this financial year, the income from exports increased by 4.2% and
thus contributed substantially to the trade surplus. The Liquefied Natural Gas (LNG), iron ore,
gold, coal, tourism, and education are among the segments that registered a notable growth
(Department of Industry, Innovation and Science, 2017).
Paraphrase This Document
Need a fresh take? Get an instant paraphrase of this document with our AI Paraphraser
BUSINESS CYCLES 11
3.3. Consequences of Business Cycles
There are several outcomes associated with business cycles. During the recession, many
businesses close down while others reduce their workforce. Such incidence leads to increase in
the level of unemployment in the country and consequently deterioration in the living standards
of individuals. For instance, in mid-1930, the unemployment rate was 21% and rose to 32% in
mid-1931 (Australian Government, 2015). Moreover, when Australia went into recession in
1991, the level of unemployment increased substantially the impact spread to 1992 and 1993. In
1991, the unemployment rate was 9.58% and rose to 10.73% in 1992 and 10.87% in 1993.
Although Australia managed to escape economic downturn during the financial crisis of
2008/2009, the level of unemployment rose sharply in 2009 to 5.56% from 4.23% in 2008 (The
World Bank, 2017).
Recessions also result in social and political consequences. For example, during the Great
Depression of the 1930s, many Australians lost their homes, and they were forced to inhabit
makeshift houses with poor sanitation and heating (Australian Government, 2015). Such
devastating experience made the Australians to lose confidence in government.
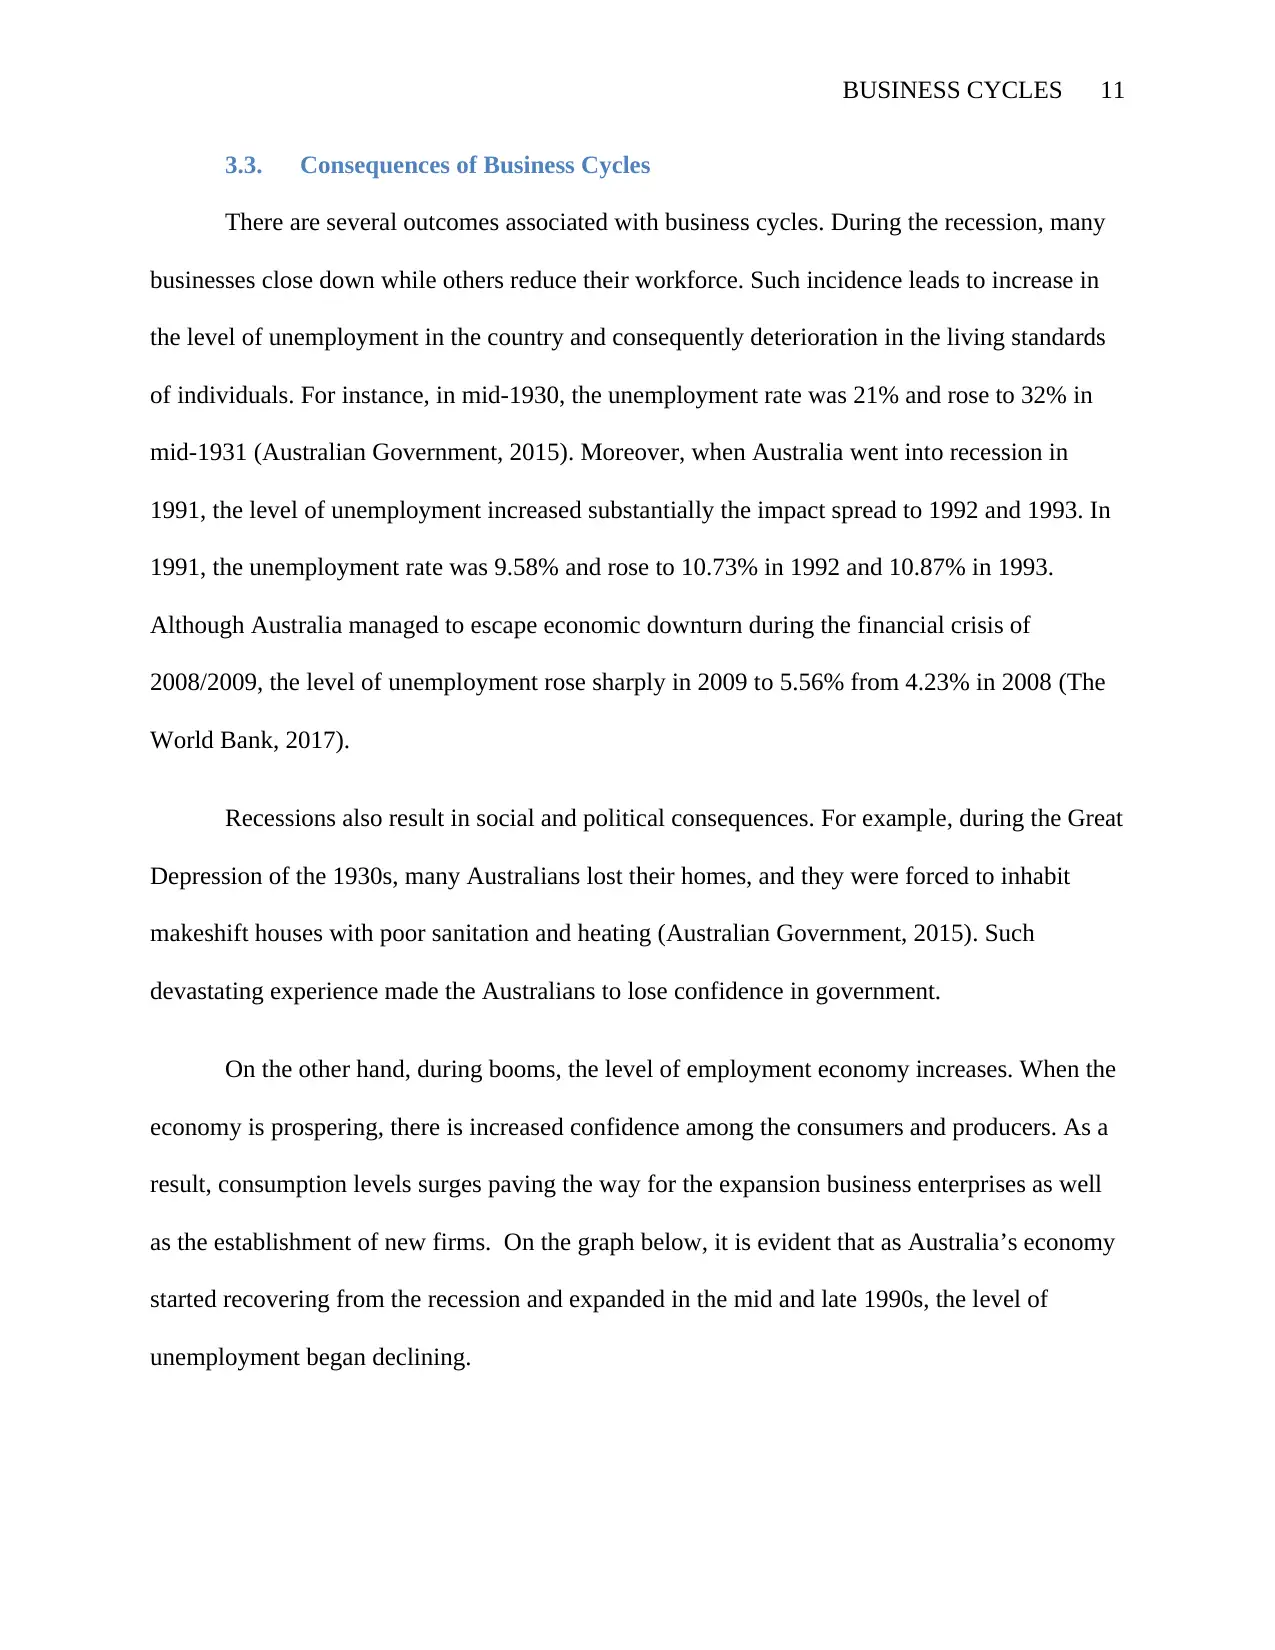
On the other hand, during booms, the level of employment economy increases. When the
economy is prospering, there is increased confidence among the consumers and producers. As a
result, consumption levels surges paving the way for the expansion business enterprises as well
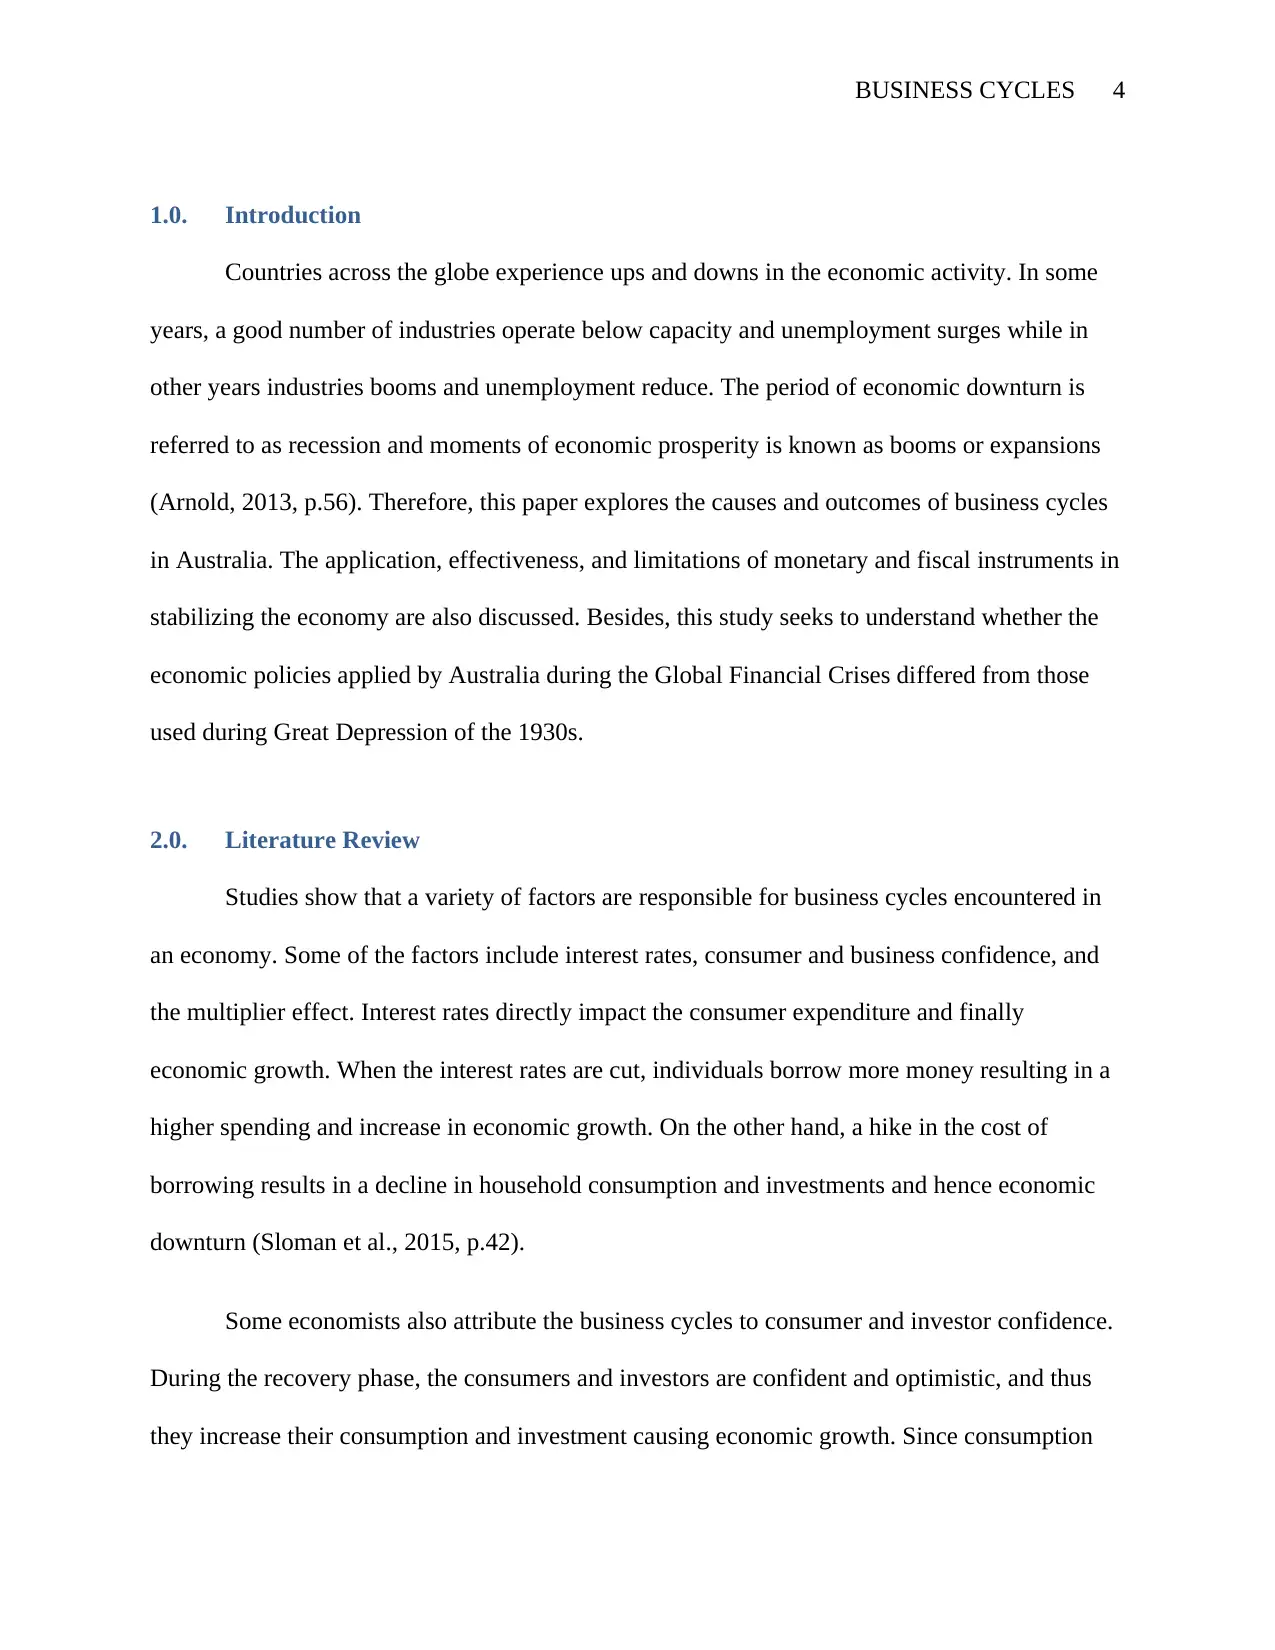
as the establishment of new firms. On the graph below, it is evident that as Australia’s economy
started recovering from the recession and expanded in the mid and late 1990s, the level of
unemployment began declining.
3.3. Consequences of Business Cycles
There are several outcomes associated with business cycles. During the recession, many
businesses close down while others reduce their workforce. Such incidence leads to increase in
the level of unemployment in the country and consequently deterioration in the living standards
of individuals. For instance, in mid-1930, the unemployment rate was 21% and rose to 32% in
mid-1931 (Australian Government, 2015). Moreover, when Australia went into recession in
1991, the level of unemployment increased substantially the impact spread to 1992 and 1993. In
1991, the unemployment rate was 9.58% and rose to 10.73% in 1992 and 10.87% in 1993.
Although Australia managed to escape economic downturn during the financial crisis of
2008/2009, the level of unemployment rose sharply in 2009 to 5.56% from 4.23% in 2008 (The
World Bank, 2017).
Recessions also result in social and political consequences. For example, during the Great
Depression of the 1930s, many Australians lost their homes, and they were forced to inhabit
makeshift houses with poor sanitation and heating (Australian Government, 2015). Such
devastating experience made the Australians to lose confidence in government.
On the other hand, during booms, the level of employment economy increases. When the
economy is prospering, there is increased confidence among the consumers and producers. As a
result, consumption levels surges paving the way for the expansion business enterprises as well
as the establishment of new firms. On the graph below, it is evident that as Australia’s economy
started recovering from the recession and expanded in the mid and late 1990s, the level of
unemployment began declining.
BUSINESS CYCLES 12
1991 1992 1993 1994 1995 1996 1997 1998 1999
-2
0
2
4
6
8
10
12
GDP % and Unemployment
GDP Growth (Annual %)
Unemployment rate
%
Data extracted from the World Bank
4.0. Did the monetary and fiscal instruments interventions of GCF differ from those of
1930s Great Depression?
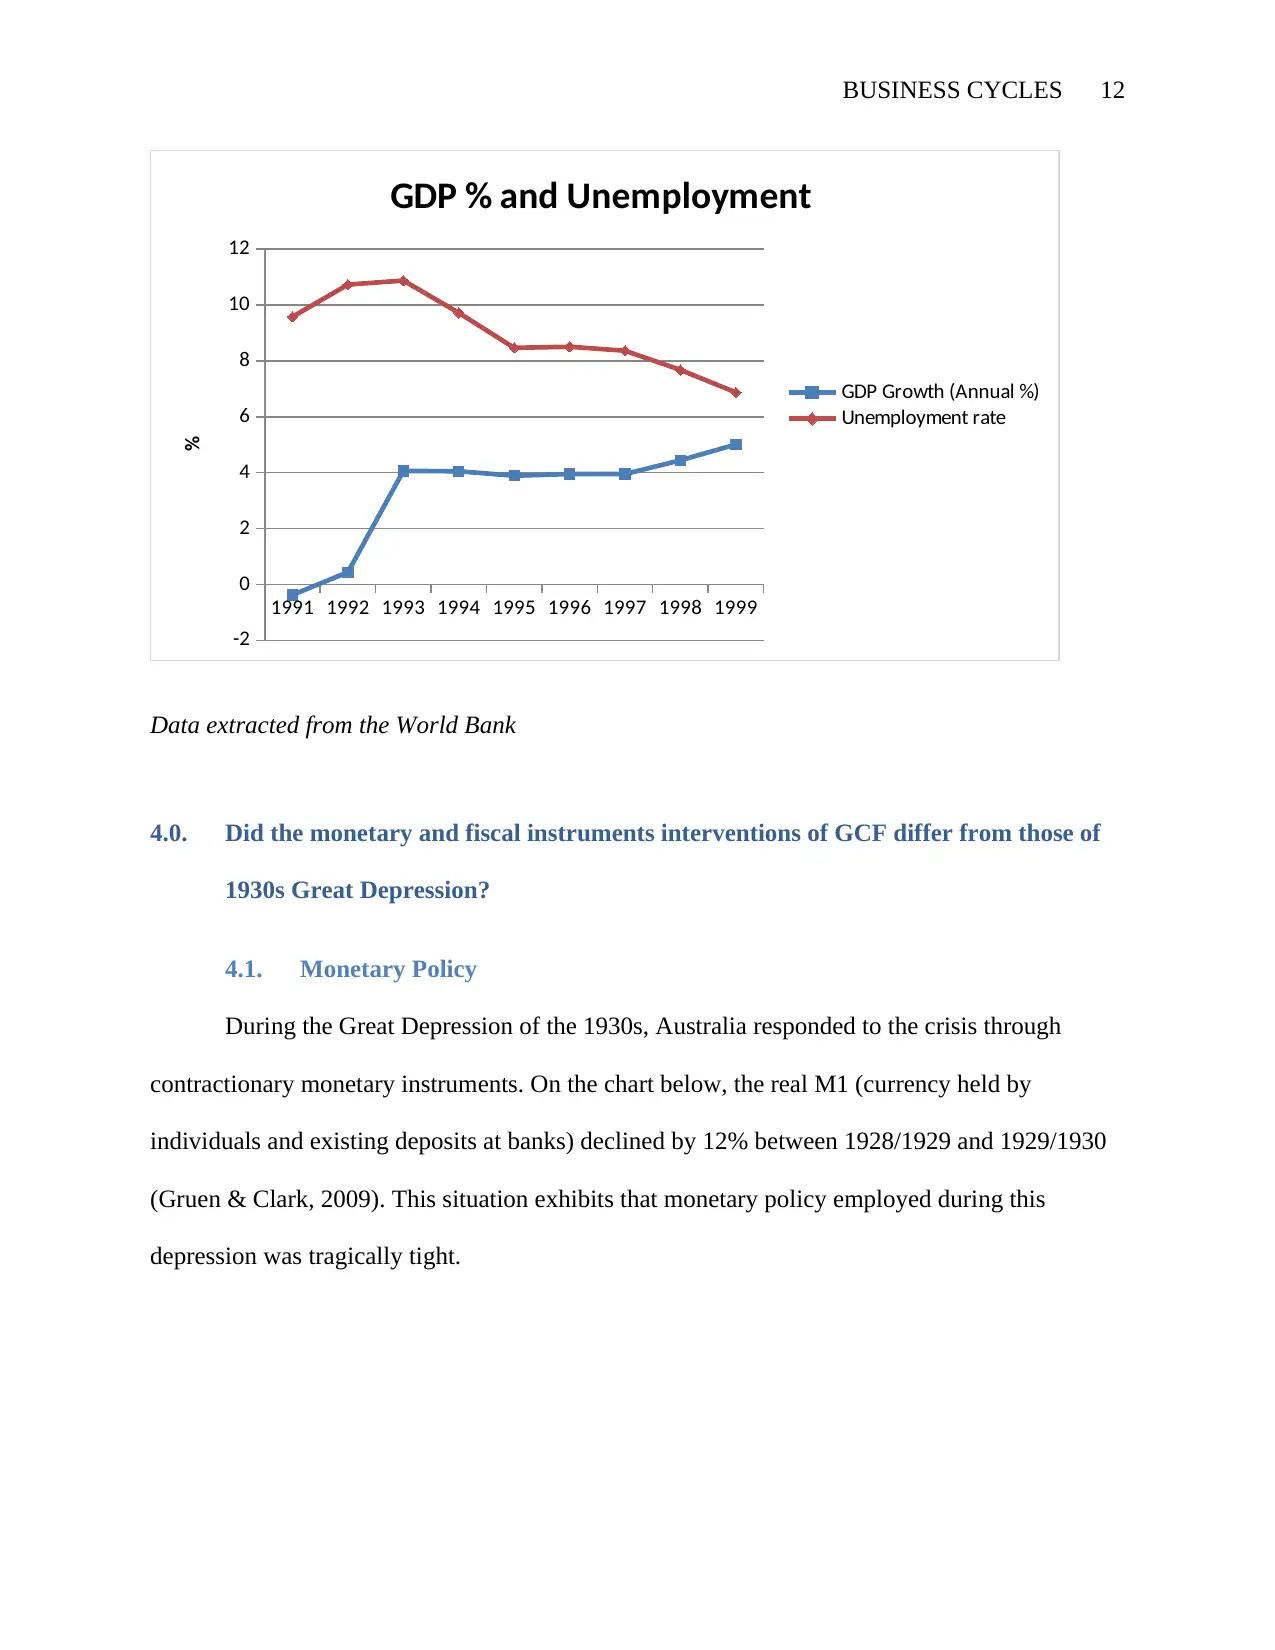
4.1. Monetary Policy
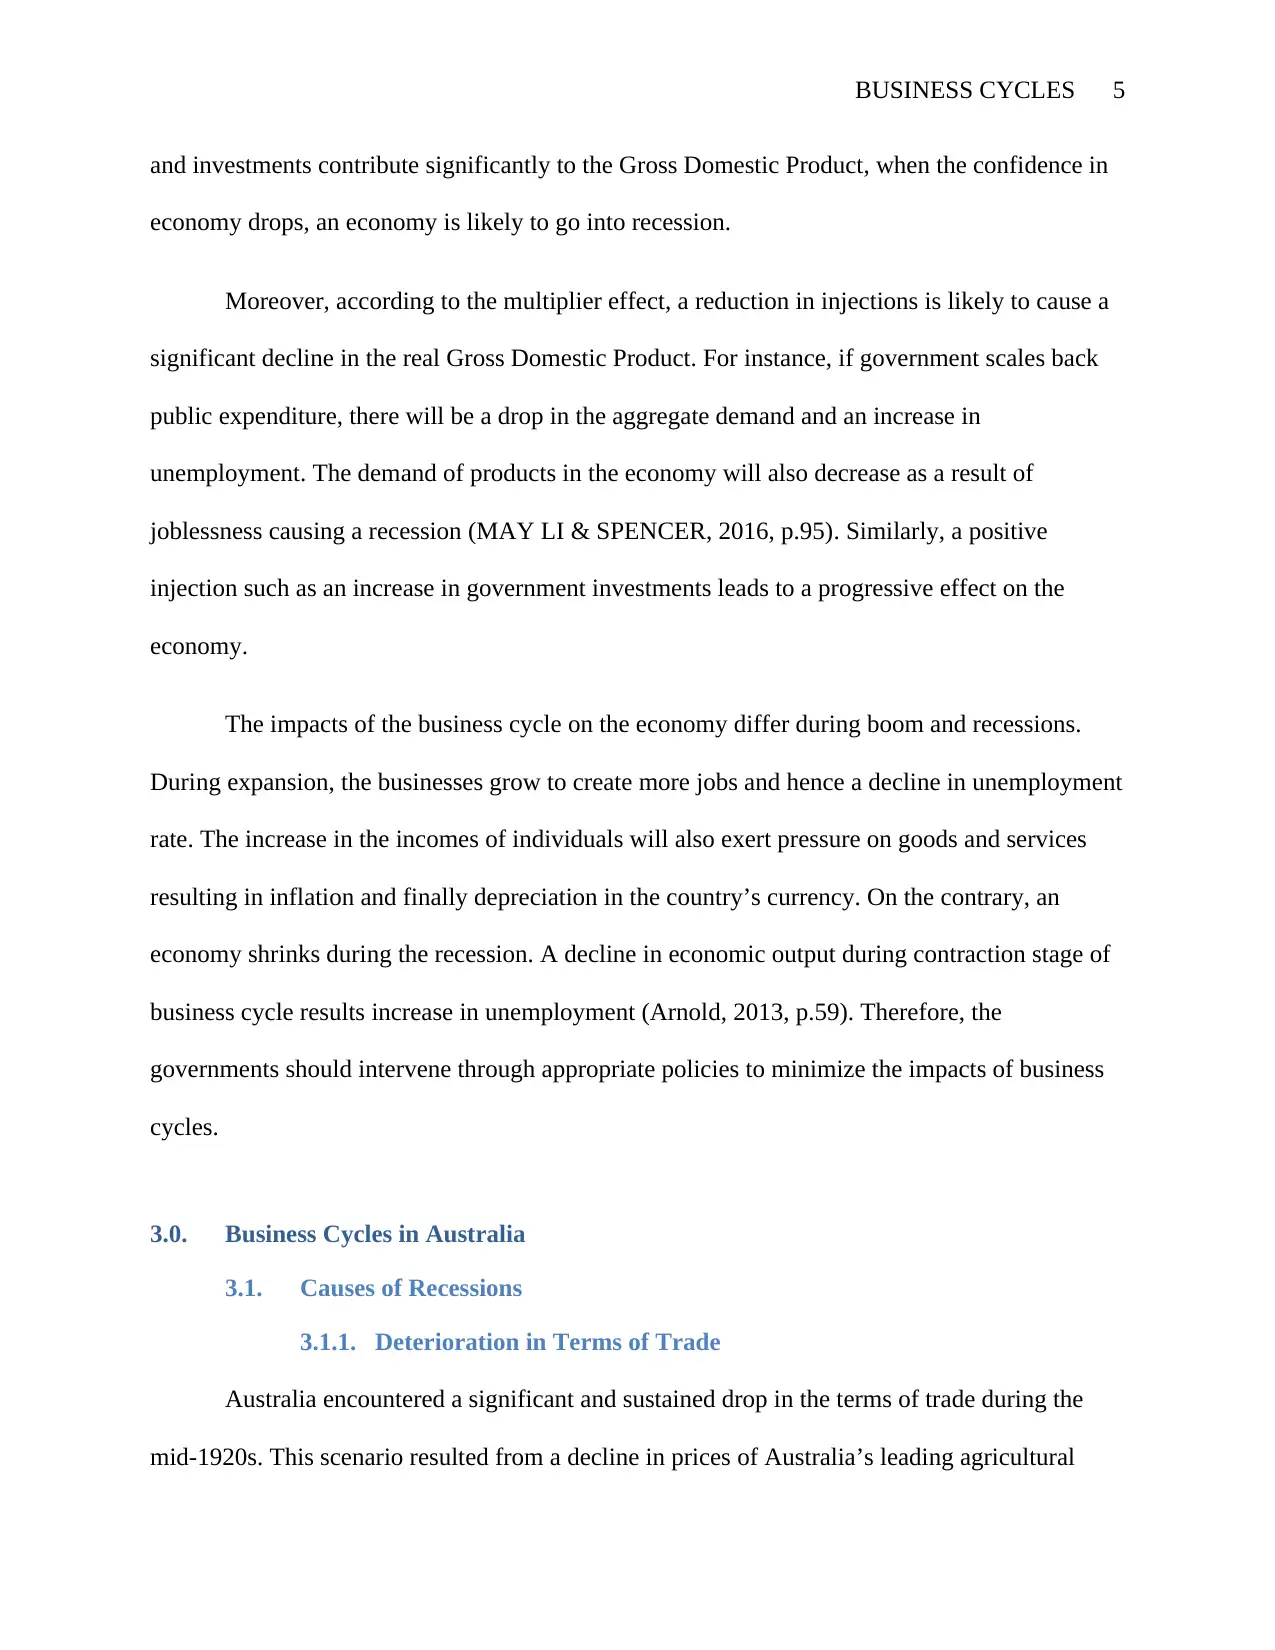
During the Great Depression of the 1930s, Australia responded to the crisis through
contractionary monetary instruments. On the chart below, the real M1 (currency held by
individuals and existing deposits at banks) declined by 12% between 1928/1929 and 1929/1930
(Gruen & Clark, 2009). This situation exhibits that monetary policy employed during this
depression was tragically tight.
1991 1992 1993 1994 1995 1996 1997 1998 1999
-2
0
2
4
6
8
10
12
GDP % and Unemployment
GDP Growth (Annual %)
Unemployment rate
%
Data extracted from the World Bank
4.0. Did the monetary and fiscal instruments interventions of GCF differ from those of
1930s Great Depression?
4.1. Monetary Policy
During the Great Depression of the 1930s, Australia responded to the crisis through
contractionary monetary instruments. On the chart below, the real M1 (currency held by
individuals and existing deposits at banks) declined by 12% between 1928/1929 and 1929/1930
(Gruen & Clark, 2009). This situation exhibits that monetary policy employed during this
depression was tragically tight.
⊘ This is a preview!⊘
Do you want full access?
Subscribe today to unlock all pages.
Trusted by 1+ million students worldwide
1 out of 19
Related Documents


Your All-in-One AI-Powered Toolkit for Academic Success.
+13062052269
info@desklib.com
Available 24*7 on WhatsApp / Email
![[object Object]](/_next/static/media/star-bottom.7253800d.svg)
Unlock your academic potential
Copyright © 2020–2026 A2Z Services. All Rights Reserved. Developed and managed by ZUCOL.