Comprehensive Report: Economic Principles and Australian Economy
VerifiedAdded on 2020/12/29
|15
|3141
|119
Report
AI Summary
This report delves into core economic principles, examining elasticity and inelasticity of demand and supply, particularly focusing on crude oil price fluctuations in Australia. It analyzes binding price ceilings and floors and presents various cost measures through a comprehensive table. The report also discusses employment and unemployment, categorizing different types and their causes. Furthermore, it explains the measurement of GDP and its components, providing insights into the Australian economy. Finally, it illustrates expansionary and contractionary monetary policies with graphical representations, offering a detailed overview of key economic concepts and their practical applications within the Australian context.

ECONOMIC PRINCIPLES
Paraphrase This Document
Need a fresh take? Get an instant paraphrase of this document with our AI Paraphraser

Table of Contents
INTRODUCTION...........................................................................................................................1
MAIN BODY...................................................................................................................................1
Q.1 Elasticity and inelasticity of demand and supply.................................................................1
Q.2 Binding price ceiling and binding price floor......................................................................3
Q.3 Various measures of cost by completing the table...............................................................4
Q.4 Discussion on employment and different type of unemployment and its causes.................5
Q.5 Measurement of GDP and its components...........................................................................7
Q.6 Graphical presentation of expansionary monetary policy and contractionary monetary
policy...........................................................................................................................................8
CONCLUSION................................................................................................................................9
REFERENCES..............................................................................................................................10
APPENDIX....................................................................................................................................11
INTRODUCTION
Economic principles are considered as standards to elaborate key dynamics of functions
of economy of country (Kilian and Murphy, 2014). Macro and micro economic factors affect the
economical condition of an organisation are critically evaluated and criticize in this report.
Concept of elasticity and in-elasticity of demand are considered with fluctuation of crude oil
prices in Australia. Bidding price, selling price and variations are considered in this report. Type
of costs as fixed, variable and total cost are illustrated with example and maximised profitability
presented in graphical form to different profitable areas. Major economical problem as
unemployment and its reasons also illustrated in this report. Measurement of GDP and its
components are explained briefly. Expansionary monetary policy and contractionary monetary
policy subject to supplied and the interest rates are communicated with diagrams.
MAIN BODY
Q.1 Elasticity and inelasticity of demand and supply
Crude oil and its elasticity
Crude oil is a mixture of naturally occurring hydrocarbons that is refined to make useful
products such as gasoline, diesel, kerosene, jet fuel called petrochemicals. It is extracted through
mining and often called 'black gold'. Elasticity is the degree of change in supply and demand of
crude oil due to change in price (Elasticity of demand in international market, 2012). The
Australian Institute of petroleum (AIP) analyse that Australia's regional market is Asia-Pacific
market where crude oil is traded.
Elasticity of Supply
Supply of crude oil is influenced by many factors such as rate and cost of production, size
of crude oil reserve, extreme weather, war, seasonal factors. Demand for crude oil depends on
number of consumers and rate of consumption. As per the last statistical records the supply of
crude oil in 2016/2017 in Australia was recorded as 8.97 thousand megaliters. These are affected
by income of individual, taxation incentives, level of economic activity, land use pattern, level of
network connectivity.
1
⊘ This is a preview!⊘
Do you want full access?
Subscribe today to unlock all pages.
Trusted by 1+ million students worldwide
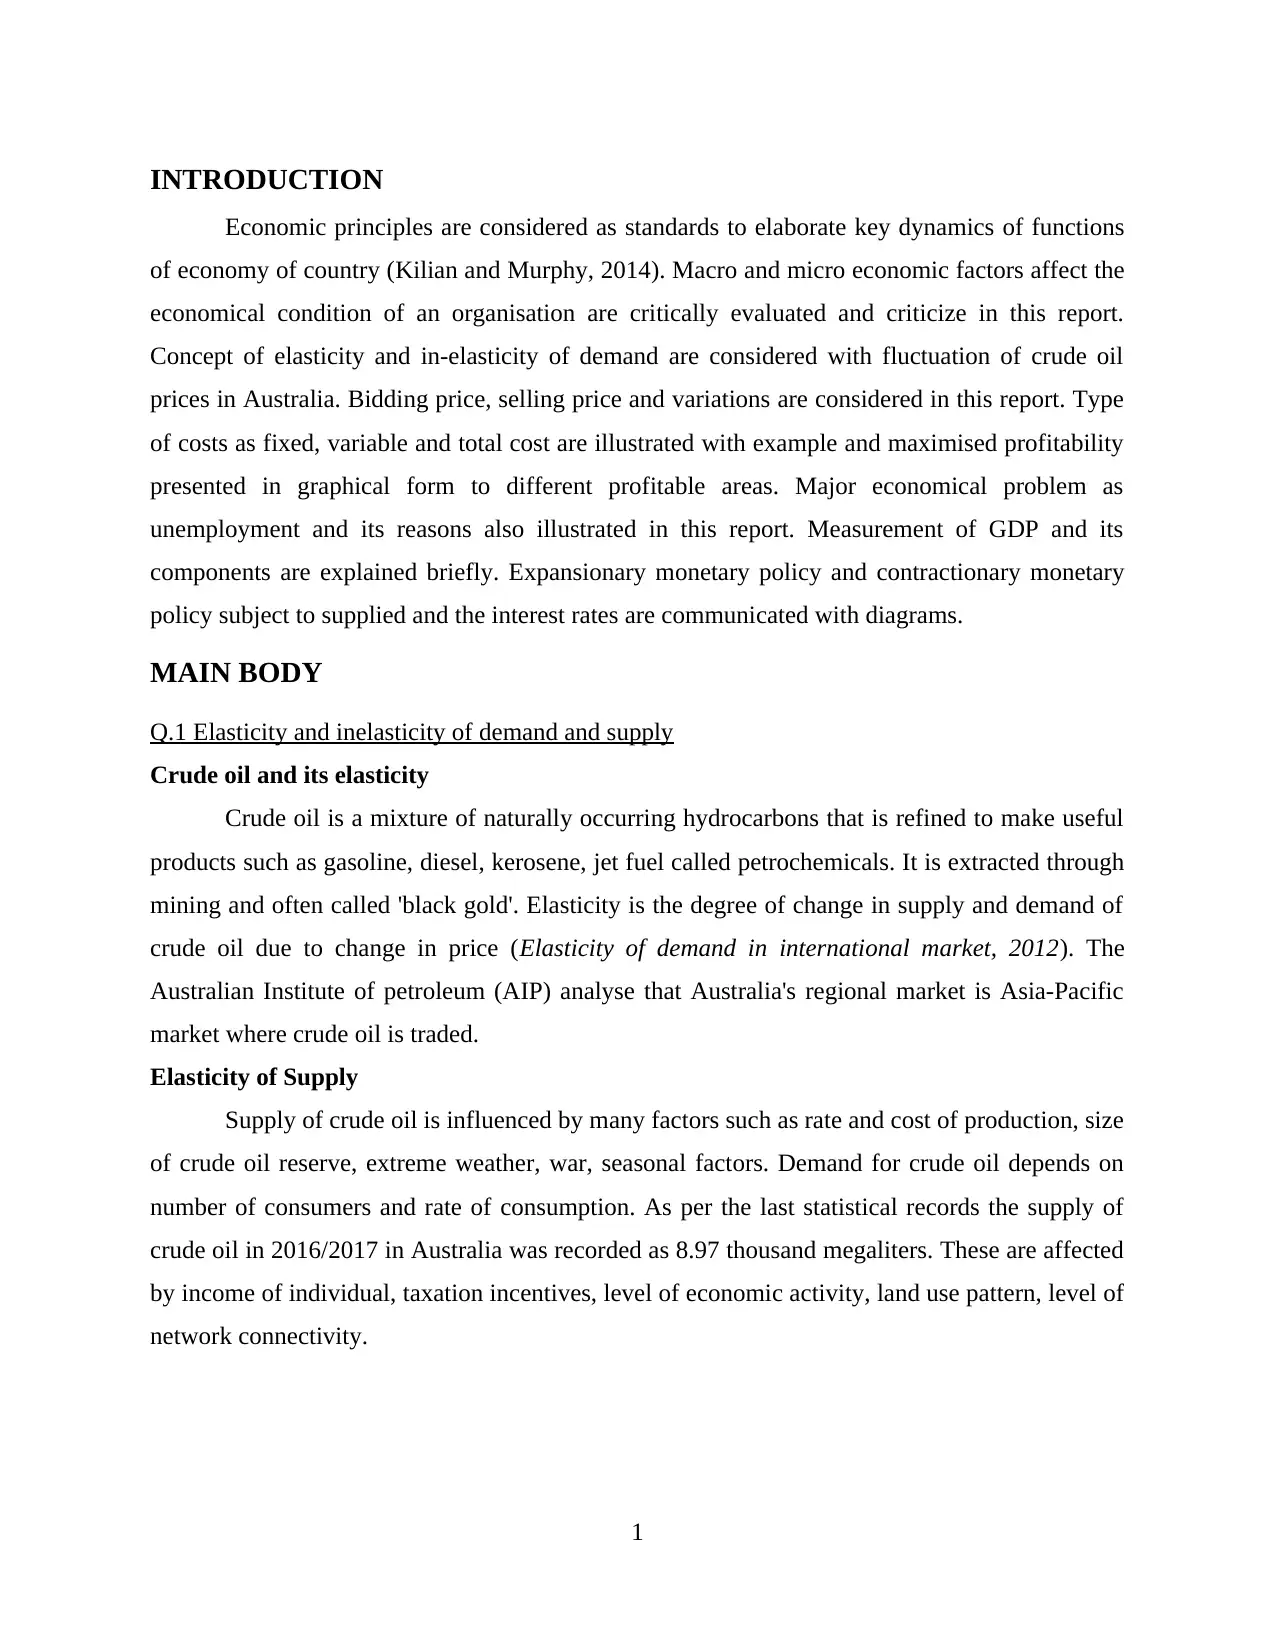
The above graphs shows the price elasticity of crude in Australian market. A discussion
was made on the price fluctuation of crude oil in international market and its impact upon price
and demand in Australia. A theoretical prediction was presented subject to variation in revenues
form sale of crude oil in domestic market and supply of product in Asia pacific and Australian
market. Policies and regulation was introduced subject to reform the pricing structure of crude
oil in Australia that provided short term and long term benefits to organisations.
In Australia, range for both short-run and long-run prices varies between -.022 to-.038. It
implies that crude oil prices are inelastic in Australia. Price elasticity generally ranges below
zero or above zero but income elasticity lies between 0.25 to 1.5. signifies that income elasticity
has moved from inelastic to unit elastic and relative elastic. Australia is a large exporter of
energy resources such as oil, coal and gas. So when prices of crude oil increases, it will bring on
revenue as well as affect domestic consumption.
Crude oil and its inelasticity of demand
2
Paraphrase This Document
Need a fresh take? Get an instant paraphrase of this document with our AI Paraphraser
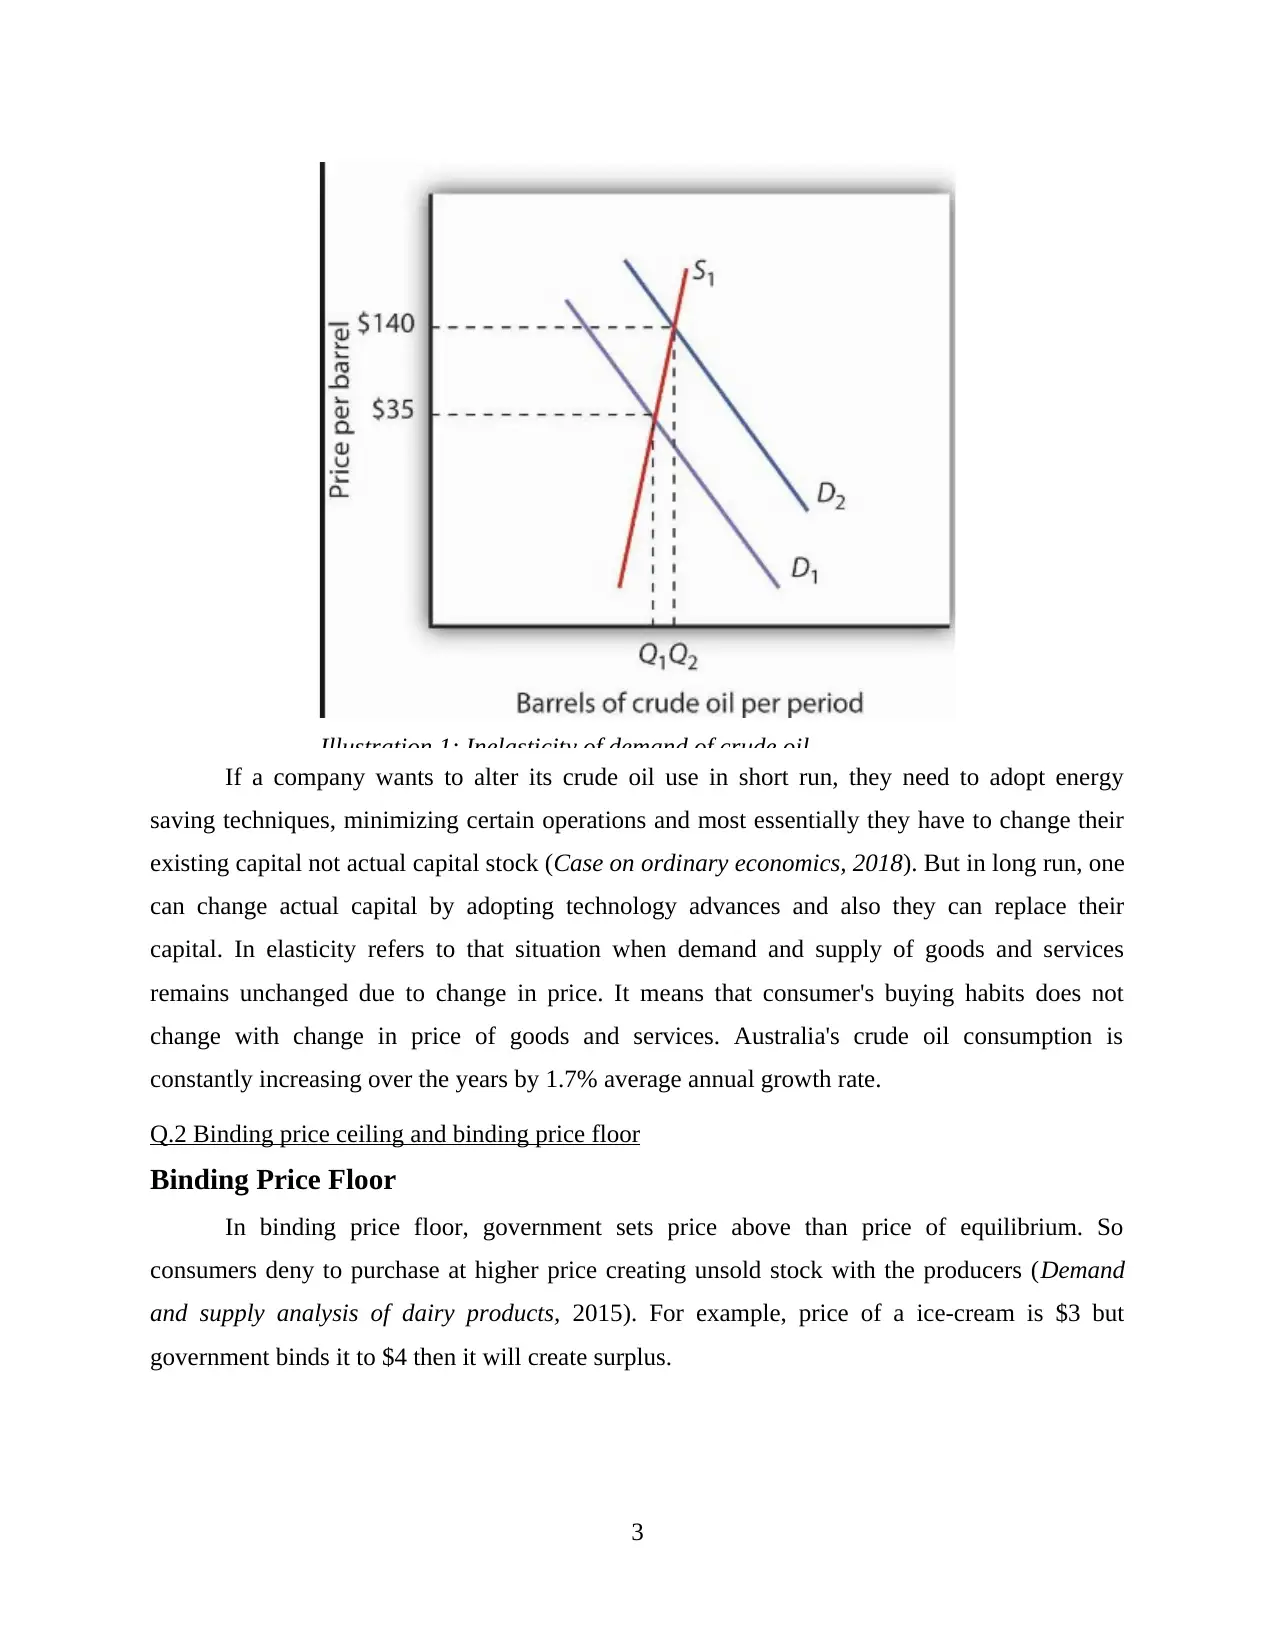
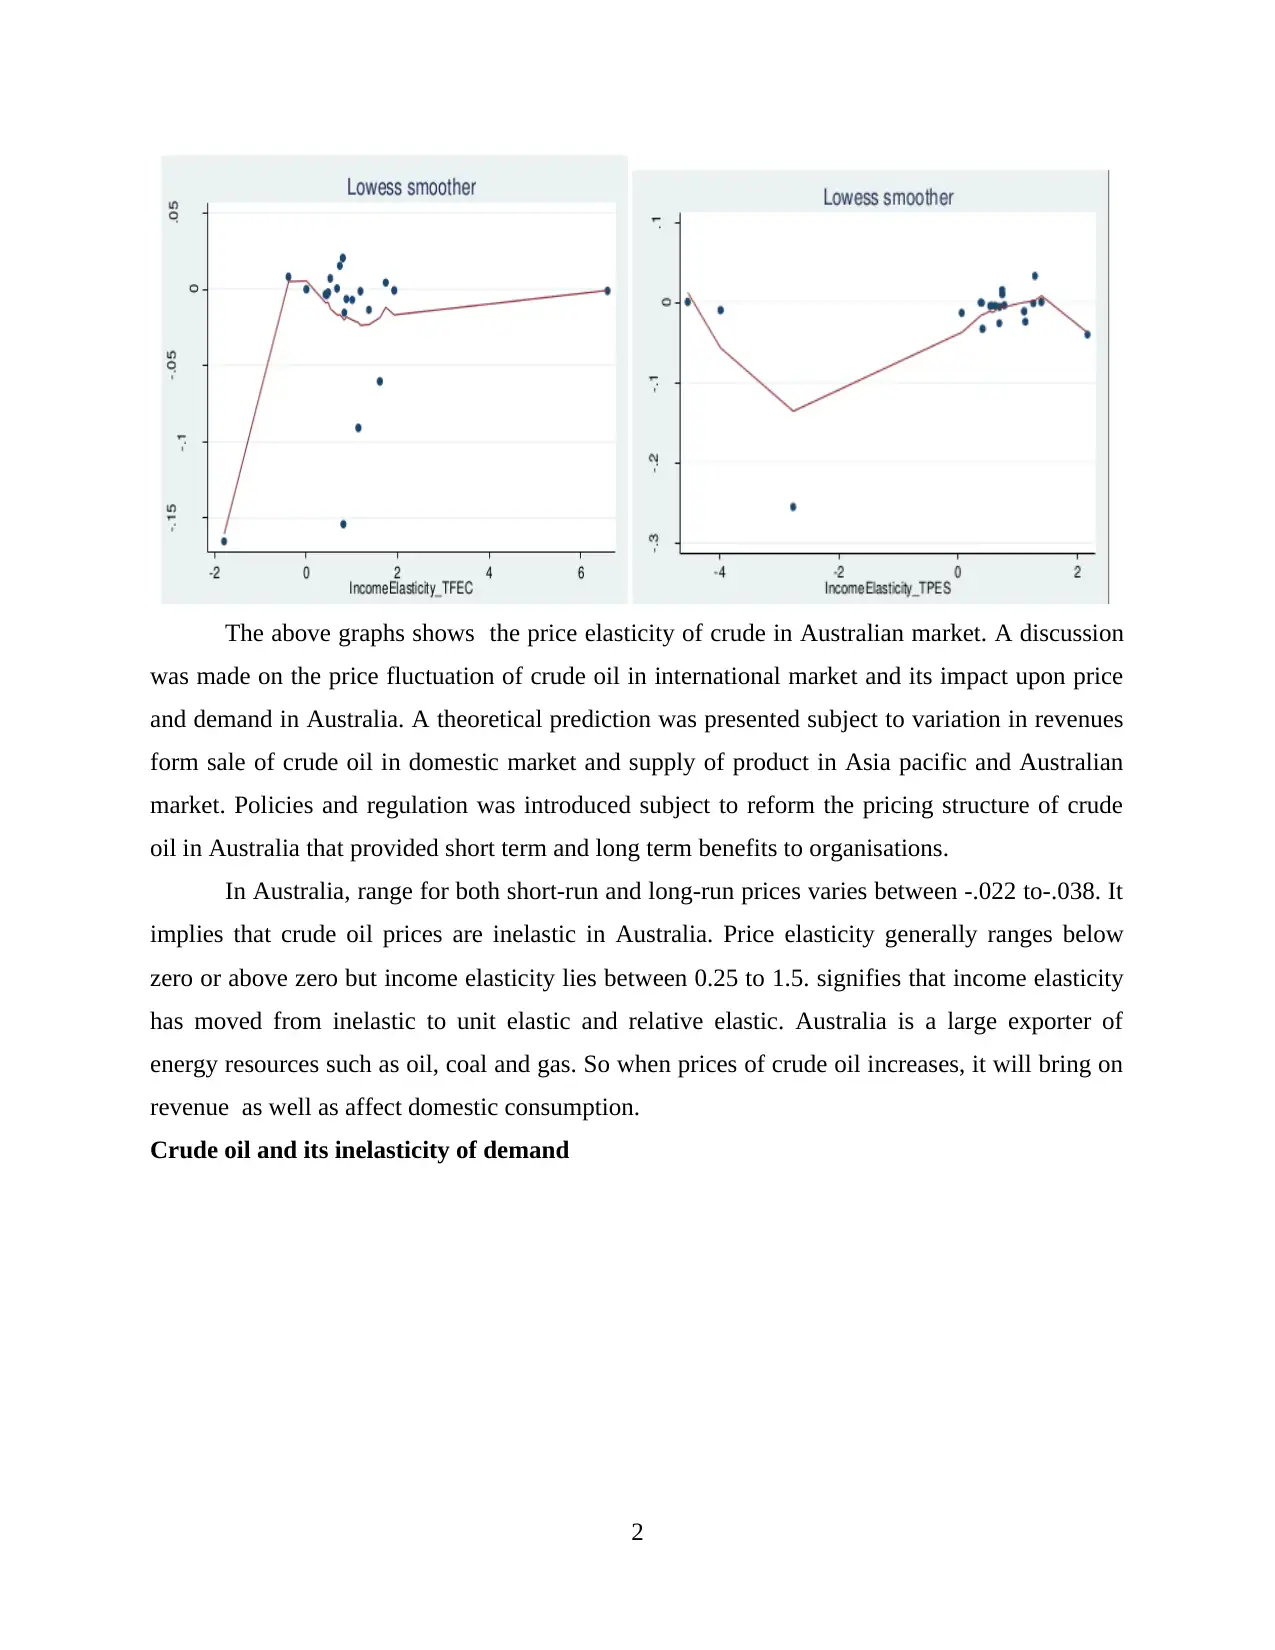
Illustration 1: Inelasticity of demand of crude oil
If a company wants to alter its crude oil use in short run, they need to adopt energy
saving techniques, minimizing certain operations and most essentially they have to change their
existing capital not actual capital stock (Case on ordinary economics, 2018). But in long run, one
can change actual capital by adopting technology advances and also they can replace their
capital. In elasticity refers to that situation when demand and supply of goods and services
remains unchanged due to change in price. It means that consumer's buying habits does not
change with change in price of goods and services. Australia's crude oil consumption is
constantly increasing over the years by 1.7% average annual growth rate.
Q.2 Binding price ceiling and binding price floor
Binding Price Floor
In binding price floor, government sets price above than price of equilibrium. So
consumers deny to purchase at higher price creating unsold stock with the producers (Demand
and supply analysis of dairy products, 2015). For example, price of a ice-cream is $3 but
government binds it to $4 then it will create surplus.
3
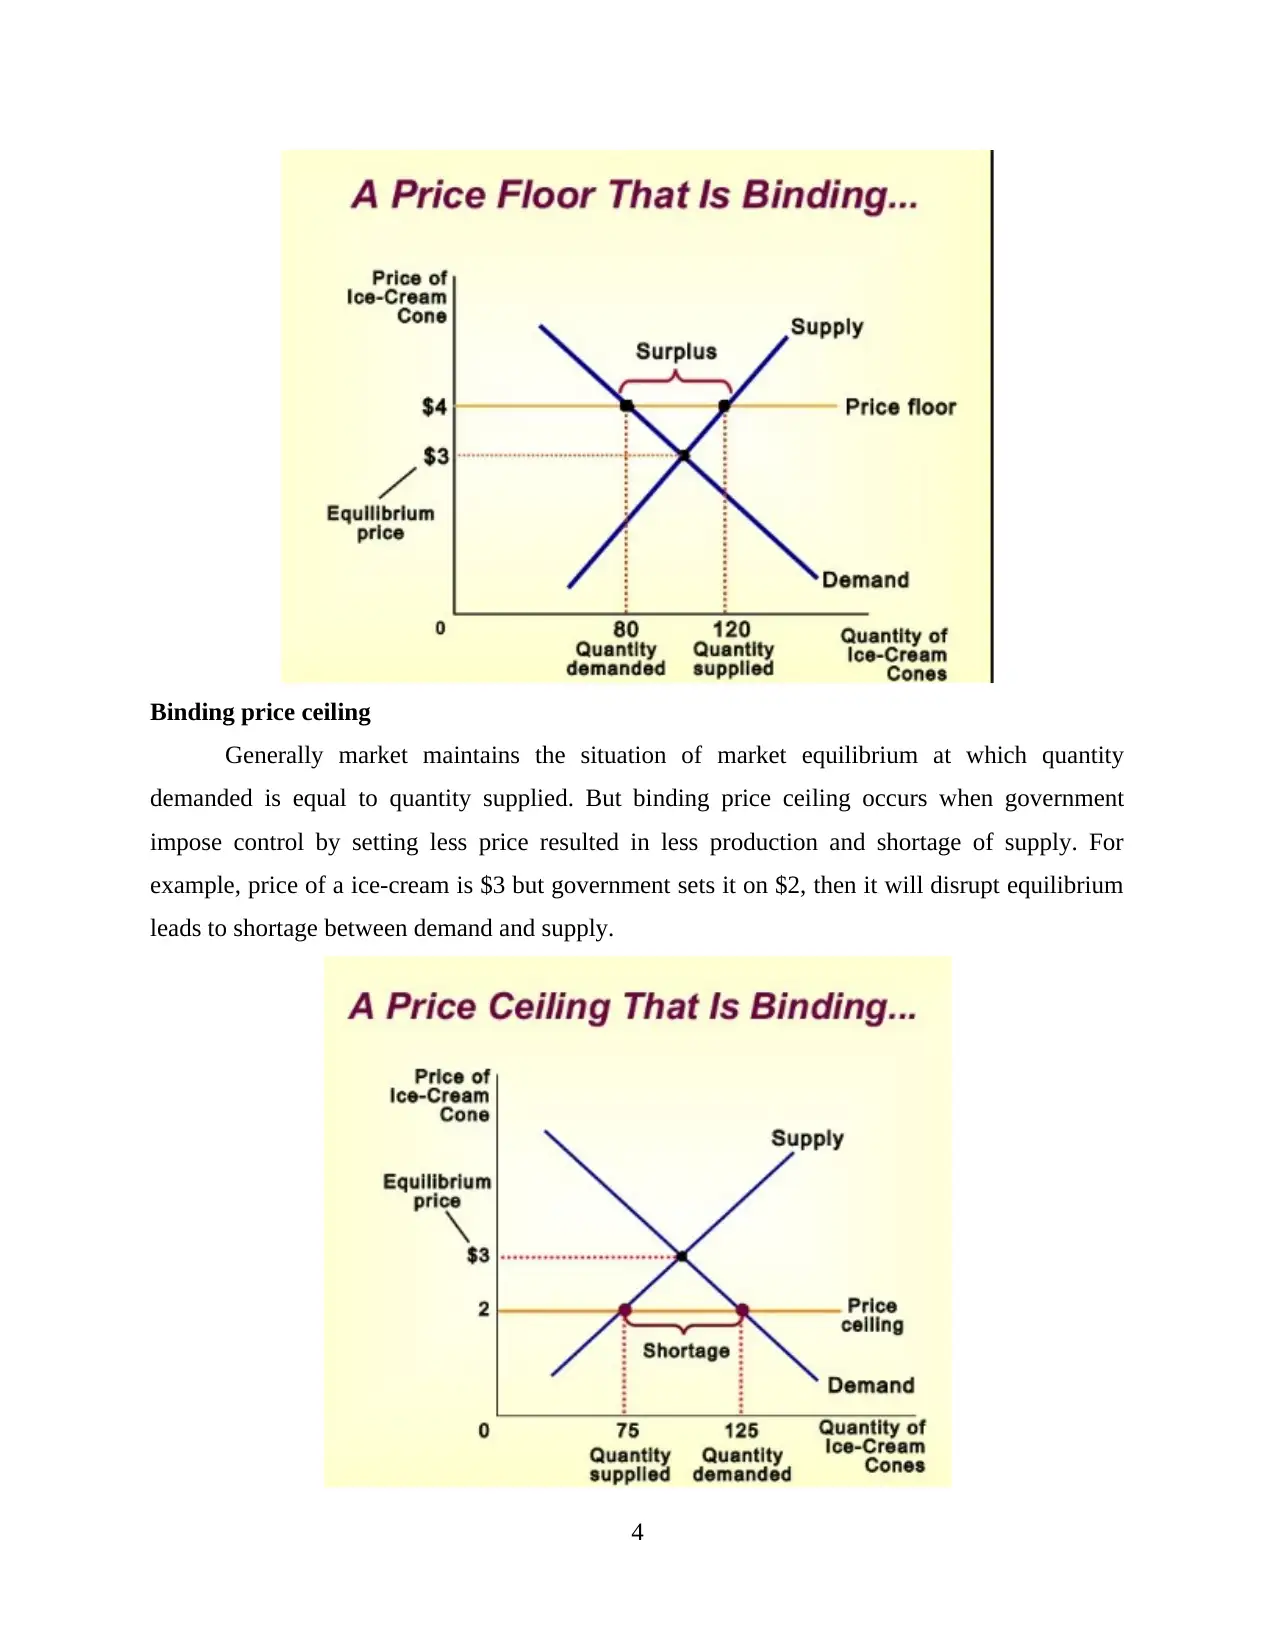
Binding price ceiling
Generally market maintains the situation of market equilibrium at which quantity
demanded is equal to quantity supplied. But binding price ceiling occurs when government
impose control by setting less price resulted in less production and shortage of supply. For
example, price of a ice-cream is $3 but government sets it on $2, then it will disrupt equilibrium
leads to shortage between demand and supply.
4
⊘ This is a preview!⊘
Do you want full access?
Subscribe today to unlock all pages.
Trusted by 1+ million students worldwide
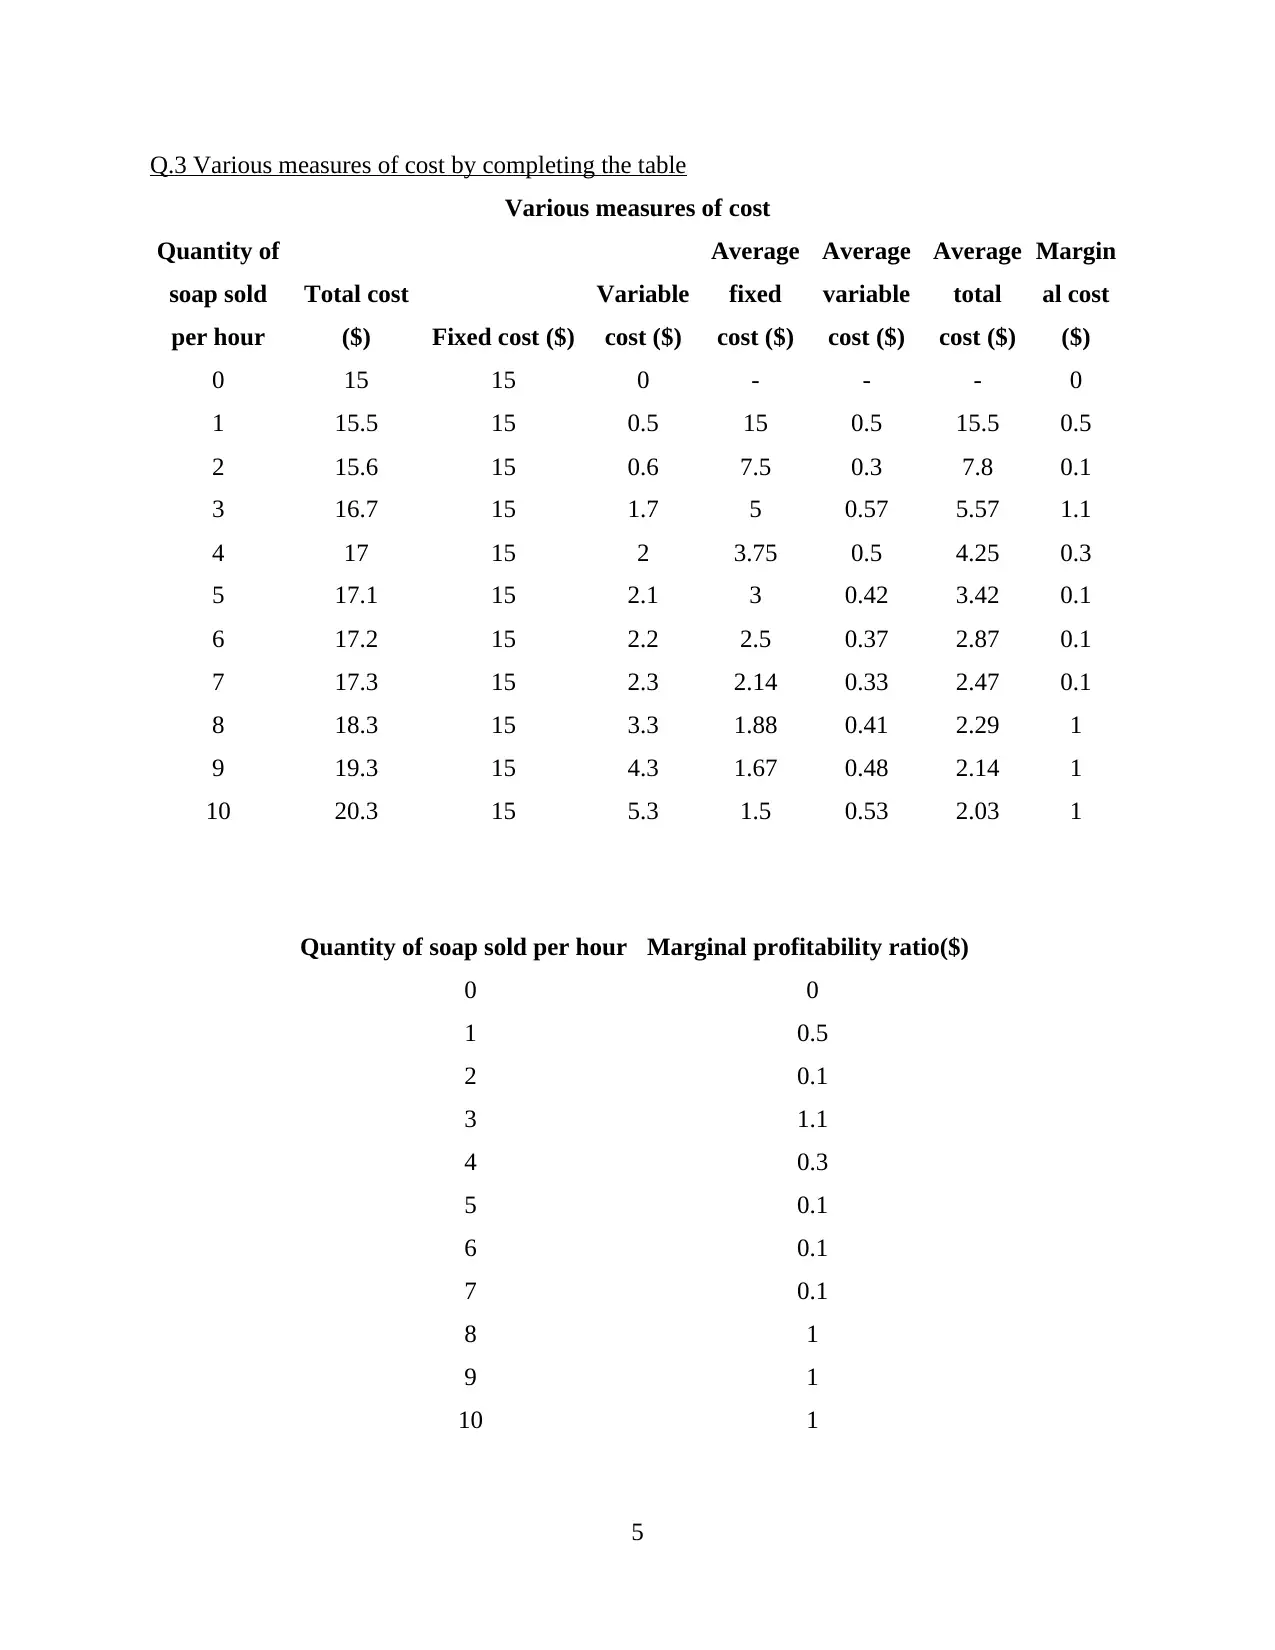
Q.3 Various measures of cost by completing the table
Various measures of cost
Quantity of
soap sold
per hour
Total cost
($) Fixed cost ($)
Variable
cost ($)
Average
fixed
cost ($)
Average
variable
cost ($)
Average
total
cost ($)
Margin
al cost
($)
0 15 15 0 - - - 0
1 15.5 15 0.5 15 0.5 15.5 0.5
2 15.6 15 0.6 7.5 0.3 7.8 0.1
3 16.7 15 1.7 5 0.57 5.57 1.1
4 17 15 2 3.75 0.5 4.25 0.3
5 17.1 15 2.1 3 0.42 3.42 0.1
6 17.2 15 2.2 2.5 0.37 2.87 0.1
7 17.3 15 2.3 2.14 0.33 2.47 0.1
8 18.3 15 3.3 1.88 0.41 2.29 1
9 19.3 15 4.3 1.67 0.48 2.14 1
10 20.3 15 5.3 1.5 0.53 2.03 1
Quantity of soap sold per hour Marginal profitability ratio($)
0 0
1 0.5
2 0.1
3 1.1
4 0.3
5 0.1
6 0.1
7 0.1
8 1
9 1
10 1
5
Paraphrase This Document
Need a fresh take? Get an instant paraphrase of this document with our AI Paraphraser
1 2 3 4 5 6 7 8 9 10 11
0
2
4
6
8
10
12
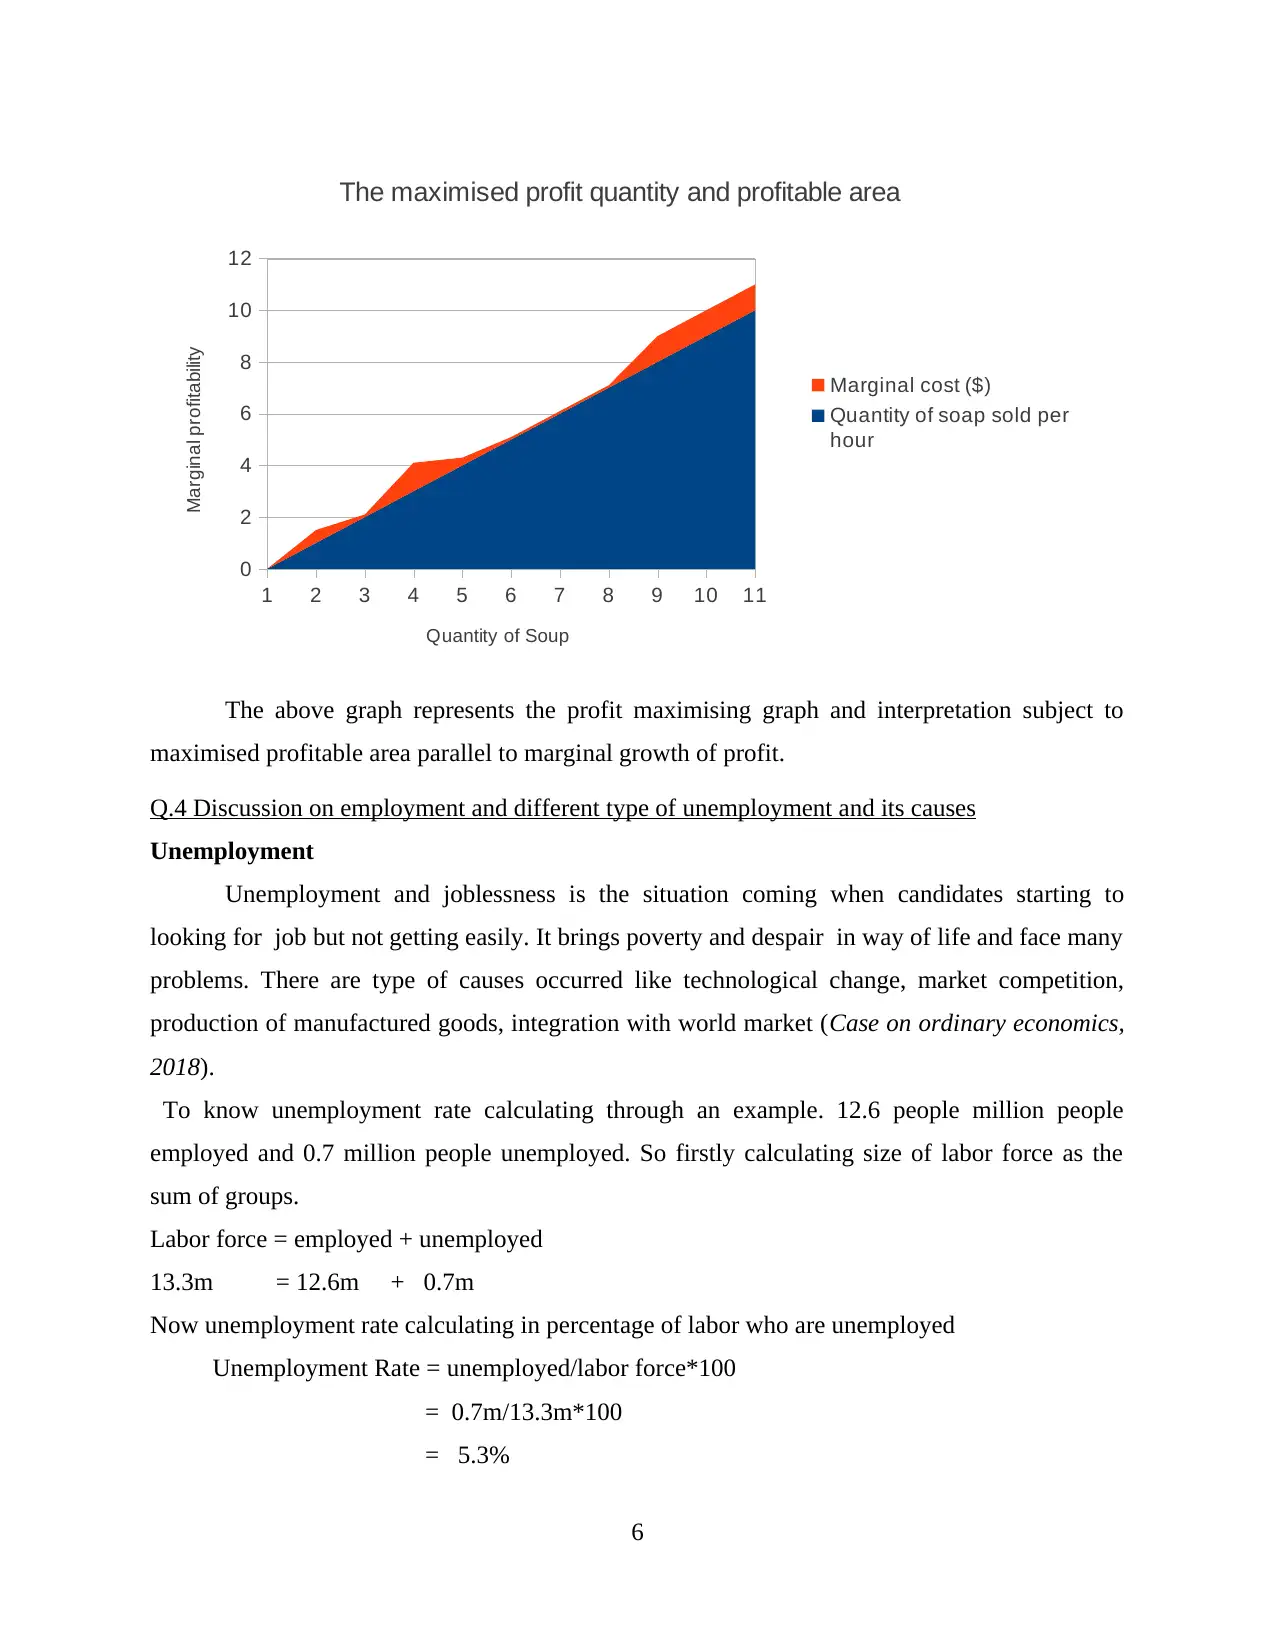
The maximised profit quantity and profitable area
Marginal cost ($)
Quantity of soap sold per
hour
Quantity of Soup
Marginal profitability
The above graph represents the profit maximising graph and interpretation subject to
maximised profitable area parallel to marginal growth of profit.
Q.4 Discussion on employment and different type of unemployment and its causes
Unemployment
Unemployment and joblessness is the situation coming when candidates starting to
looking for job but not getting easily. It brings poverty and despair in way of life and face many
problems. There are type of causes occurred like technological change, market competition,
production of manufactured goods, integration with world market (Case on ordinary economics,
2018).
To know unemployment rate calculating through an example. 12.6 people million people
employed and 0.7 million people unemployed. So firstly calculating size of labor force as the
sum of groups.
Labor force = employed + unemployed
13.3m = 12.6m + 0.7m
Now unemployment rate calculating in percentage of labor who are unemployed
Unemployment Rate = unemployed/labor force*100
= 0.7m/13.3m*100
= 5.3%
6
0
2
4
6
8
10
12
The maximised profit quantity and profitable area
Marginal cost ($)
Quantity of soap sold per
hour
Quantity of Soup
Marginal profitability
The above graph represents the profit maximising graph and interpretation subject to
maximised profitable area parallel to marginal growth of profit.
Q.4 Discussion on employment and different type of unemployment and its causes
Unemployment
Unemployment and joblessness is the situation coming when candidates starting to
looking for job but not getting easily. It brings poverty and despair in way of life and face many
problems. There are type of causes occurred like technological change, market competition,
production of manufactured goods, integration with world market (Case on ordinary economics,
2018).
To know unemployment rate calculating through an example. 12.6 people million people
employed and 0.7 million people unemployed. So firstly calculating size of labor force as the
sum of groups.
Labor force = employed + unemployed
13.3m = 12.6m + 0.7m
Now unemployment rate calculating in percentage of labor who are unemployed
Unemployment Rate = unemployed/labor force*100
= 0.7m/13.3m*100
= 5.3%
6

Types of unemployment and its causes
Cyclical unemployment – Cyclical unemployment happen when changes coming in
economic activity over the business cycle. Main reason of this type that lack of demand of goods
and services. So lack of demand impact on hiring of fewer new workers and for people hard to
find job during to weak demand strength.
Structural unemployment - Structural unemployment happen when people looking for
job but according to job profile they don't have required skills. Or available jobs are a long way
from the people. If they are work in industries so they properly not using his skills and skills will
be automated as a result of large scale. After some time if they try to find another industry so it
will be difficult for them and try to develop new skills according to new industries or move for
new opportunities (Bunting, 2013).
Frictional unemployment- Frictional unemployment happen when labour wants to right
job for that they move between jobs in market. Flexible labour market helps for achieving an
efficient allocation for labour (Croitoru, 2012). Businesses also try to search right candidate for
right job . As a result people who are looking for job they don't matching with required skills.
This type of unemployment less than one month.
Others unemployment
Underemployment – Underemployment happen when people are already employed but
they want to do extra work . These people divide in two types first part time worker and second
who work full time. This type of worker rate high.
Hidden unemployment – Hidden unemployment happen when people not count in
unemployed but they actual want to work. For instance, there is a high number of employees are
working more than the actual requirement at workplace.
Seasonal unemployment – These types worker have different pattern of work. That
pattern affect to their jobs just like ski instructor, fruit pickers and holiday related jobs. ABS
publishes market statistics according to seasonally, which remove data of seasonal patterns. For
instance in agricutltural sector some employees remain unemployement due to farming of
seasonable crops.
Q.5 Measurement of GDP and its components
GDP (Gross Domestic Product) is monetary value of all the goods and services produced
in a country over a specified time period. Since it is a economic measure, so it indicates
7
⊘ This is a preview!⊘
Do you want full access?
Subscribe today to unlock all pages.
Trusted by 1+ million students worldwide
economic wealth as well as standard of living of a country (Kurz,2015). GDP includes all
individuals, public and private companies and can be calculated on annual or quarterly basis.
Components of GDP are:
Personal consumption expenditure: Consumption expenditure comprises of goods and
services purchased by households. Goods are further sub-divided into durable and non-
durable goods. Durable goods such as, cars and furniture. Non-durable goods such as
fuel, food, clothing. Services includes healthcare, transportation, banking, education etc.
Higher outlay on personal consumption appears as a good sign.
Government expenditure: It measures the amount of money government spends in a
period of time. Government can be both central and state either on national defence or
non-defence. But does not includes interest or transfer payments such as payments for
social security or unemployment benefits. Government spendings should not be so much
as it indicates poor management.
Investments: Investment here is capital expenditure which gives benefit in next coming
years. It consists of business fixed investment such as computer software, manufacturing
equipments. Inventory investment such as raw materials, WIP, finished goods.
Residential construction investments such as family homes, town houses. Public
investments by government such as schools, hospitals, bridges.
Exports and Import: Exports are goods and services produced in Australia, purchased
by another countries and imports are goods and services produced by other countries
purchased by Australia. Net exports equal to exports less imports.
GDP= Personal consumption expenditure + Government expenditure + Investments + Exports –
Imports
The Australian Bureau of Statistics (ABS) releases its economy's figures every quarter.
GDP of Australia in second quarter was 356,270 million dollars of 2018 and grew 0.9% as
compared to previous quarter and in second quarter it ranked 13th among 50 countries. Australia
has recorded growth of GDP in past 25 years which is a record set by it, even in the global
recession of 2007-08 it showed positive economic growth. Retail sector of Australia contributed
almost about A$1 billion to GDP and 0.6 percent in growth rate in last quarter than 0.2 percent
in first quarter (Australian growth statistics, 2018).
8
Paraphrase This Document
Need a fresh take? Get an instant paraphrase of this document with our AI Paraphraser
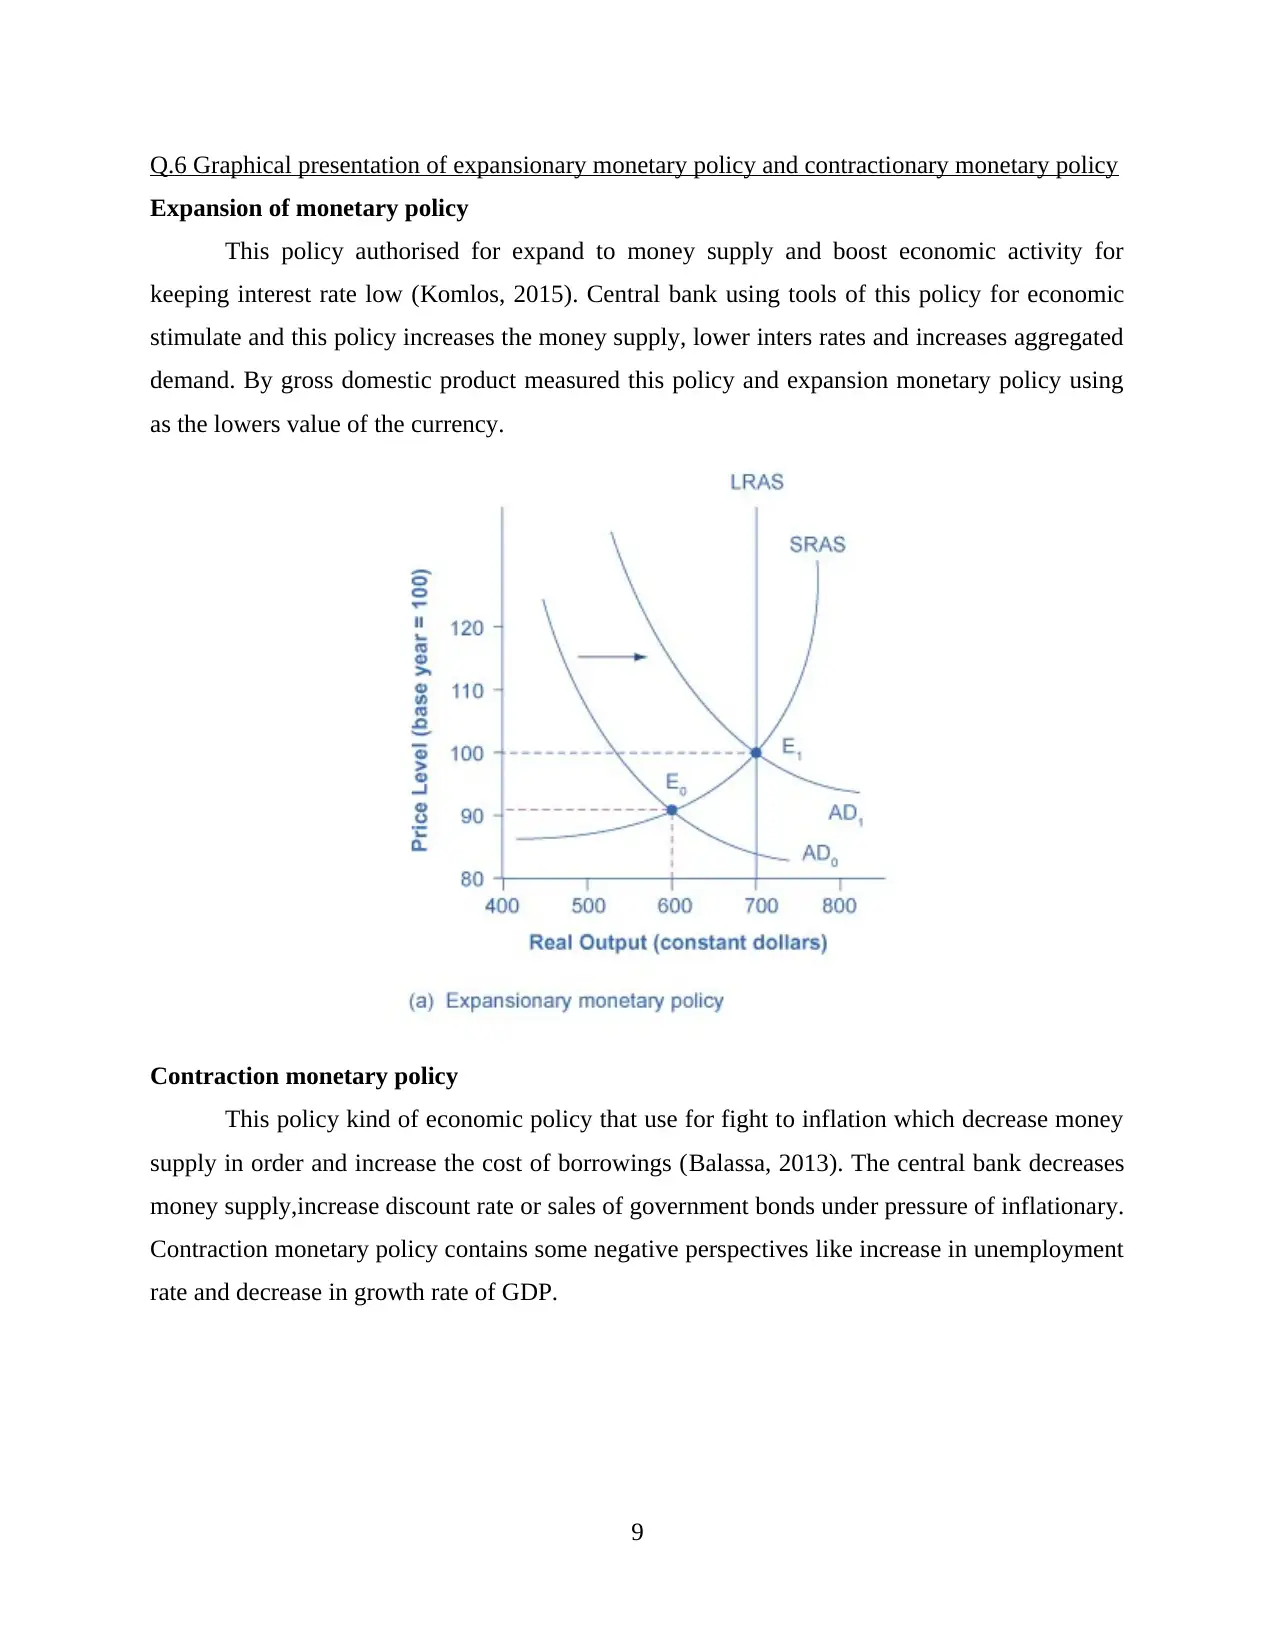
Q.6 Graphical presentation of expansionary monetary policy and contractionary monetary policy
Expansion of monetary policy
This policy authorised for expand to money supply and boost economic activity for
keeping interest rate low (Komlos, 2015). Central bank using tools of this policy for economic
stimulate and this policy increases the money supply, lower inters rates and increases aggregated
demand. By gross domestic product measured this policy and expansion monetary policy using
as the lowers value of the currency.
Contraction monetary policy
This policy kind of economic policy that use for fight to inflation which decrease money
supply in order and increase the cost of borrowings (Balassa, 2013). The central bank decreases
money supply,increase discount rate or sales of government bonds under pressure of inflationary.
Contraction monetary policy contains some negative perspectives like increase in unemployment
rate and decrease in growth rate of GDP.
9

CONCLUSION
The above report summarise the basic economic principles by illustrating the micro and
macro economic factors. Fundamental challenges that affect the economic growth of
organisations are discussed in this report. Graphical representation of flows the information
regarding price elasticity and in-elasticity of demand. A tabular form of cost measures conclude
the profitability of organisation and define the concept of key assumptions and models related to
articles. Importance of economic models and assumptions are discussed in economics.
10
⊘ This is a preview!⊘
Do you want full access?
Subscribe today to unlock all pages.
Trusted by 1+ million students worldwide
1 out of 15
Related Documents


Your All-in-One AI-Powered Toolkit for Academic Success.
+13062052269
info@desklib.com
Available 24*7 on WhatsApp / Email
![[object Object]](/_next/static/media/star-bottom.7253800d.svg)
Unlock your academic potential
Copyright © 2020–2026 A2Z Services. All Rights Reserved. Developed and managed by ZUCOL.