Economics Assignment: Real GDP Growth and Australian Economy Analysis
VerifiedAdded on 2021/05/31
|17
|4117
|70
Report
AI Summary
This economics assignment provides a comprehensive analysis of the Australian economy, focusing on key macroeconomic factors and their interrelationships. The report examines the connection between Real GDP growth and inflation, demonstrating a negative correlation. It also explores the relationship between unemployment and Real GDP, highlighting the impact of economic growth on job creation. The analysis further delves into the business cycle, identifying the expansion stage in the Australian economy. The report investigates the relationship between real exchange rates and net exports, particularly between the USA and Australia, revealing a negative correlation. Additionally, it examines the connotation between cash rates and Fed rates. The report concludes with a macroeconomic outlook for Australia, offering insights into the country's economic trajectory and providing recommendations for fostering stability and growth, particularly in the export sector. The report suggests that to ensure the Australian economy's future stability, it is crucial for the government to implement strategies that support the Australian export market and position it as a leading exporter of natural resources.
Running head: ECONOMICS ASSIGNMENT
Economics Assignment
Name of the student:
Name of the University:
Author note
Economics Assignment
Name of the student:
Name of the University:
Author note
Paraphrase This Document
Need a fresh take? Get an instant paraphrase of this document with our AI Paraphraser
2ECONOMICS ASSIGNMENT
Executive summary:
Australian economy is one of the largest mixed economy around the world that has been growing
through the last three decade by a high rate. Australia has been going through its 27th consecutive year
of growth, which is mainly driven by the robust performance of the agricultural and mining sector.
Though the Australian economy has been rising, however, the Real GDP growth rate of the state has
been falling over the last few years. Under this scenario, this report is aimed to analyse various
macroeconomic factors that are being affected by the change in the Real GDP growth of the
Australian economy. Through this analysis, it will try to provide insight, how the Australian economy
has been growing through the last few years and how the economy will be within next few years.
From the discussion it has been found that the Australian economy is one of the largest mixed
economy in the world where all the sectors of the economy has participated by a large share
in the structuring of the domestic economy. Moving forward the report has found that the
state as of now is going through the growth stage, where its various macroeconomic factors
are expanding by a large extent. The report suggest that in order to gauge the present situation
and make the future of the Australian economy more stable, it is necessary for the Australian
government to bring in strategies that can aid the Australian export market and aid it to
become the largest exporter of the natural resources like coal and others. To conclude it can
be stated that the economy has high potential to become one of the largest economy around
the world with its large amount of domestic market and the favourable trading conditions.
3ECONOMICS ASSIGNMENT
Table of Contents
Introduction:...............................................................................................................................4
Connection between inflation rates along with Australia’s Real GDP growth rate:..................4
Unemployment and Real GDP growth rate connection:............................................................6
Evidence of the business cycle:..................................................................................................7
Relationship between Real exchange rates and net exports of the USA and Australia:............8
Connotation between Cash rates and the Fed rates:.................................................................10
How movements in the Federal Reserve Fund’s rates drive movements in the Cash rates:....11
Macroeconomic outlook of Australia:.....................................................................................12
Conclusion:..............................................................................................................................13
Reference:................................................................................................................................15
Appendix:.................................................................................................................................17
⊘ This is a preview!⊘
Do you want full access?
Subscribe today to unlock all pages.
Trusted by 1+ million students worldwide
4ECONOMICS ASSIGNMENT
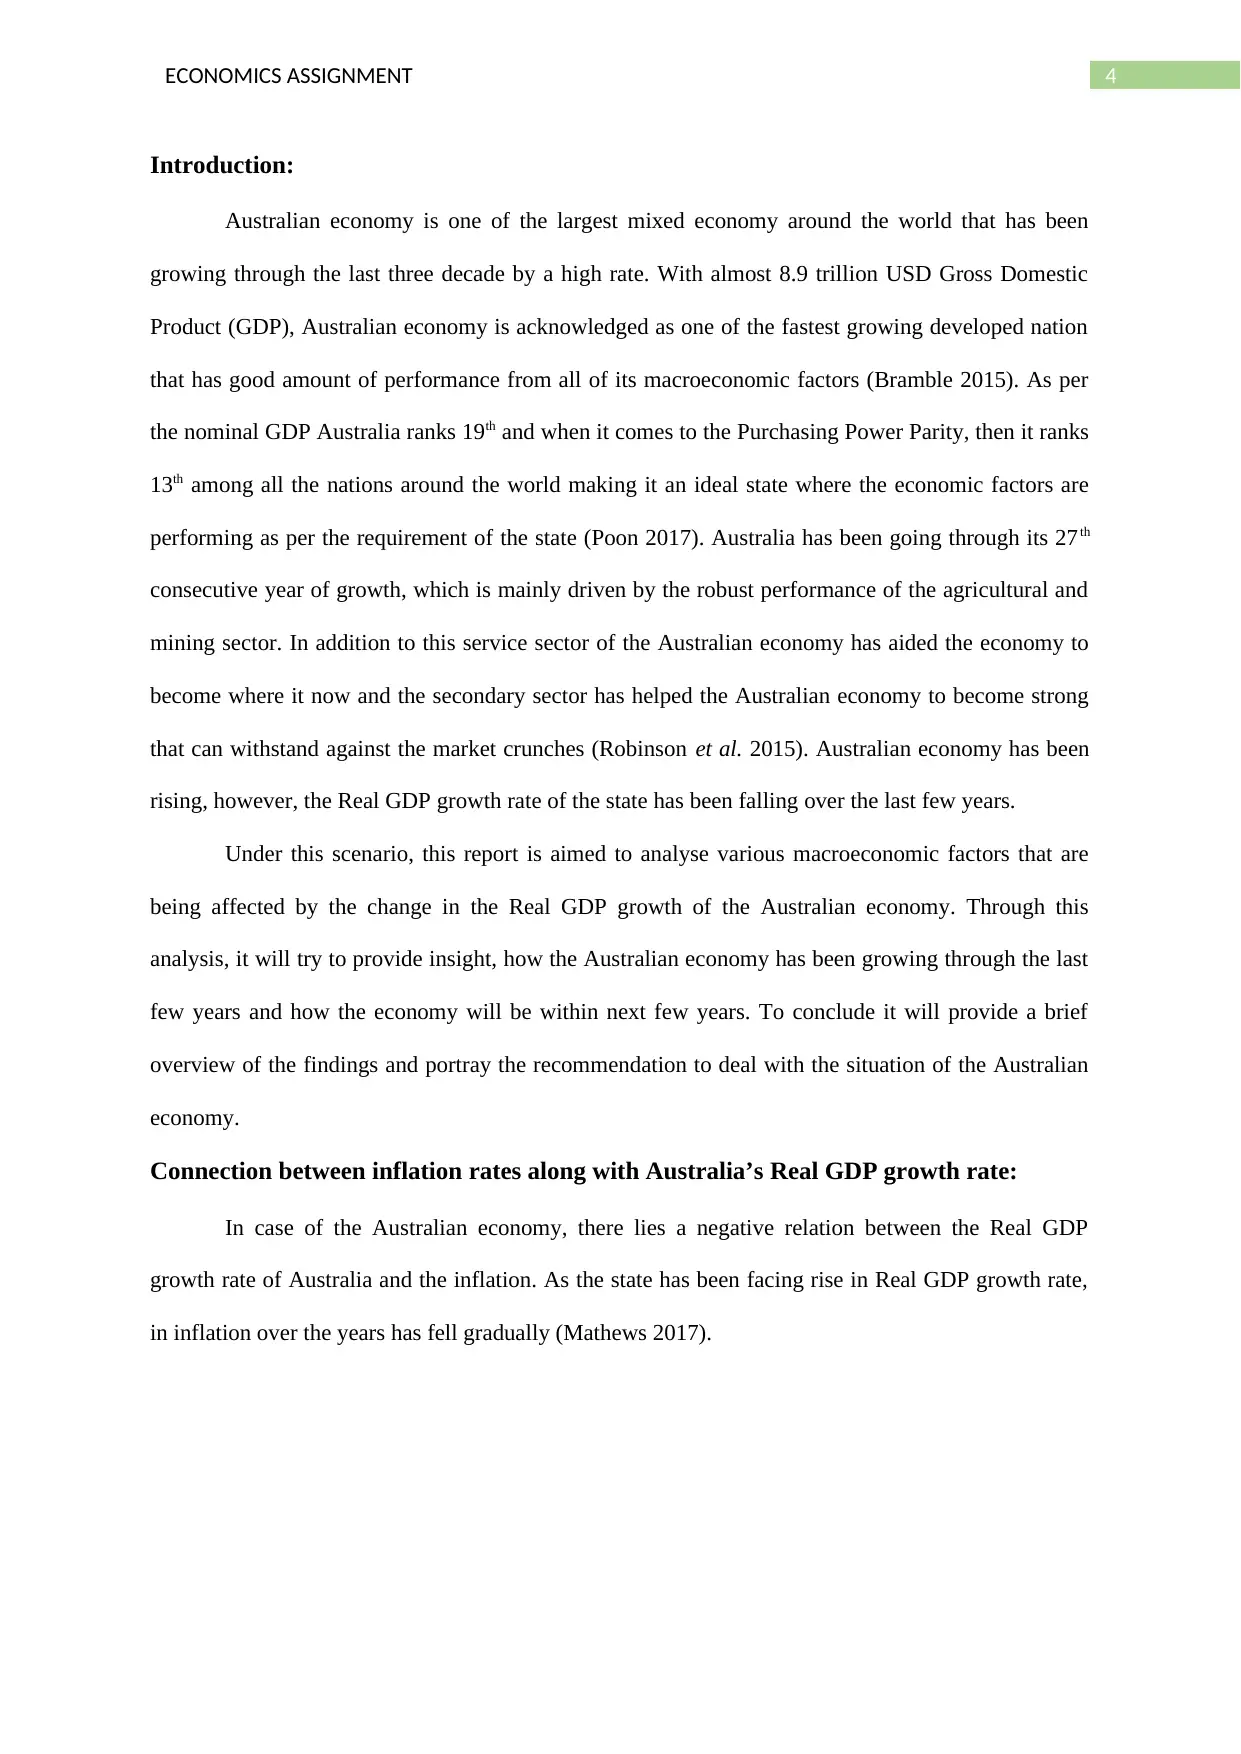
Introduction:
Australian economy is one of the largest mixed economy around the world that has been
growing through the last three decade by a high rate. With almost 8.9 trillion USD Gross Domestic
Product (GDP), Australian economy is acknowledged as one of the fastest growing developed nation
that has good amount of performance from all of its macroeconomic factors (Bramble 2015). As per
the nominal GDP Australia ranks 19th and when it comes to the Purchasing Power Parity, then it ranks
13th among all the nations around the world making it an ideal state where the economic factors are
performing as per the requirement of the state (Poon 2017). Australia has been going through its 27th
consecutive year of growth, which is mainly driven by the robust performance of the agricultural and
mining sector. In addition to this service sector of the Australian economy has aided the economy to
become where it now and the secondary sector has helped the Australian economy to become strong
that can withstand against the market crunches (Robinson et al. 2015). Australian economy has been
rising, however, the Real GDP growth rate of the state has been falling over the last few years.
Under this scenario, this report is aimed to analyse various macroeconomic factors that are
being affected by the change in the Real GDP growth of the Australian economy. Through this
analysis, it will try to provide insight, how the Australian economy has been growing through the last
few years and how the economy will be within next few years. To conclude it will provide a brief
overview of the findings and portray the recommendation to deal with the situation of the Australian
economy.
Connection between inflation rates along with Australia’s Real GDP growth rate:
In case of the Australian economy, there lies a negative relation between the Real GDP
growth rate of Australia and the inflation. As the state has been facing rise in Real GDP growth rate,
in inflation over the years has fell gradually (Mathews 2017).
Paraphrase This Document
Need a fresh take? Get an instant paraphrase of this document with our AI Paraphraser
5ECONOMICS ASSIGNMENT
1990
1991
1992
1993
1994
1995
1996
1997
1998
1999
2000
2001
2002
2003
2004
2005
2006
2007
2008
2009
2010
2011
2012
2013
2014
2015
-1.00
0.00
1.00
2.00
3.00
4.00
5.00
6.00
7.00
8.00
GDP growth rate v/s Inflation
Real GDP growth rate Inflation
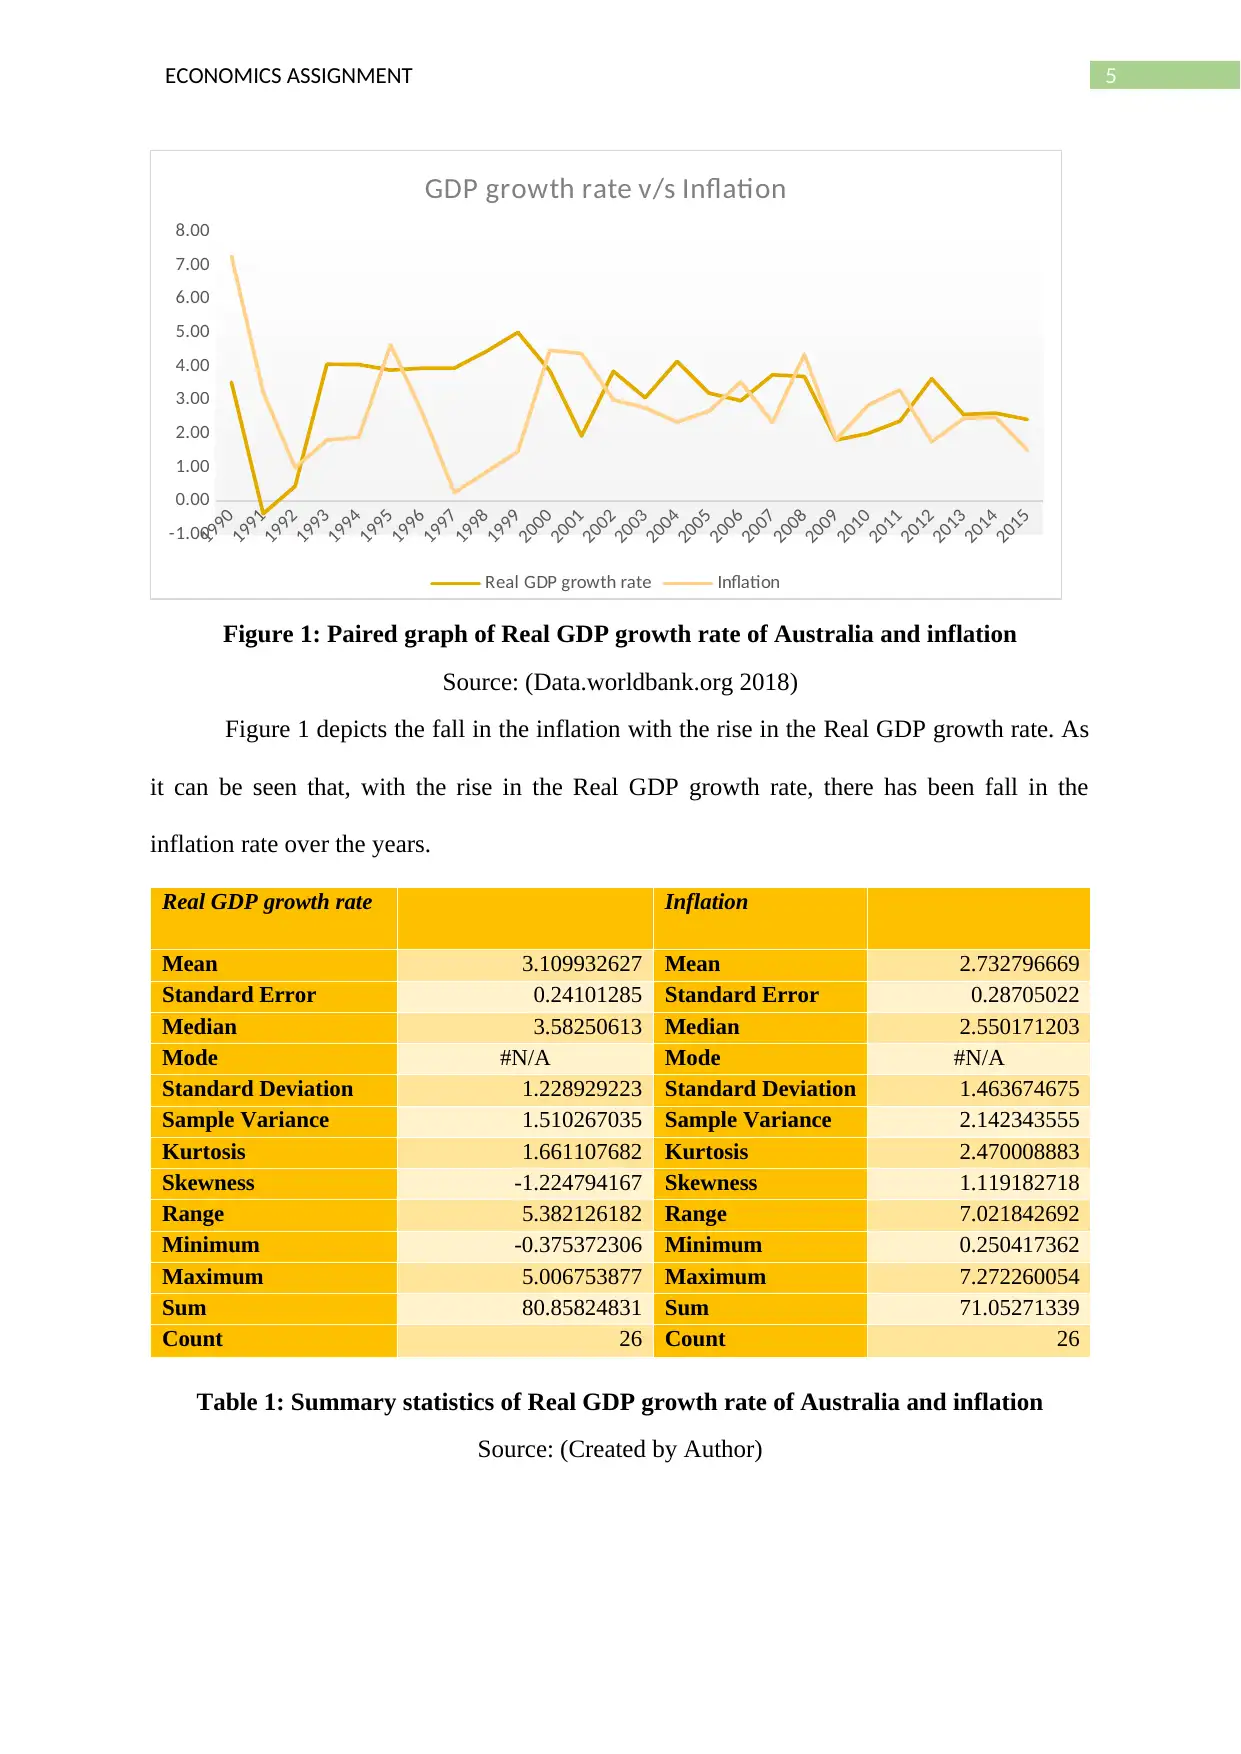
Figure 1: Paired graph of Real GDP growth rate of Australia and inflation
Source: (Data.worldbank.org 2018)
Figure 1 depicts the fall in the inflation with the rise in the Real GDP growth rate. As
it can be seen that, with the rise in the Real GDP growth rate, there has been fall in the
inflation rate over the years.
Real GDP growth rate Inflation
Mean 3.109932627 Mean 2.732796669
Standard Error 0.24101285 Standard Error 0.28705022
Median 3.58250613 Median 2.550171203
Mode #N/A Mode #N/A
Standard Deviation 1.228929223 Standard Deviation 1.463674675
Sample Variance 1.510267035 Sample Variance 2.142343555
Kurtosis 1.661107682 Kurtosis 2.470008883
Skewness -1.224794167 Skewness 1.119182718
Range 5.382126182 Range 7.021842692
Minimum -0.375372306 Minimum 0.250417362
Maximum 5.006753877 Maximum 7.272260054
Sum 80.85824831 Sum 71.05271339
Count 26 Count 26
Table 1: Summary statistics of Real GDP growth rate of Australia and inflation
Source: (Created by Author)
1990
1991
1992
1993
1994
1995
1996
1997
1998
1999
2000
2001
2002
2003
2004
2005
2006
2007
2008
2009
2010
2011
2012
2013
2014
2015
-1.00
0.00
1.00
2.00
3.00
4.00
5.00
6.00
7.00
8.00
GDP growth rate v/s Inflation
Real GDP growth rate Inflation
Figure 1: Paired graph of Real GDP growth rate of Australia and inflation
Source: (Data.worldbank.org 2018)
Figure 1 depicts the fall in the inflation with the rise in the Real GDP growth rate. As
it can be seen that, with the rise in the Real GDP growth rate, there has been fall in the
inflation rate over the years.
Real GDP growth rate Inflation
Mean 3.109932627 Mean 2.732796669
Standard Error 0.24101285 Standard Error 0.28705022
Median 3.58250613 Median 2.550171203
Mode #N/A Mode #N/A
Standard Deviation 1.228929223 Standard Deviation 1.463674675
Sample Variance 1.510267035 Sample Variance 2.142343555
Kurtosis 1.661107682 Kurtosis 2.470008883
Skewness -1.224794167 Skewness 1.119182718
Range 5.382126182 Range 7.021842692
Minimum -0.375372306 Minimum 0.250417362
Maximum 5.006753877 Maximum 7.272260054
Sum 80.85824831 Sum 71.05271339
Count 26 Count 26
Table 1: Summary statistics of Real GDP growth rate of Australia and inflation
Source: (Created by Author)
6ECONOMICS ASSIGNMENT
Table 1 and 2 highlights the phenomenon that with the rise in the Real GDP, there has
been fall in the inflation as the price of the goods and services eventually fell with the rise in
the potential of production of the Australian economy (Tung and Thanh 2015).
Real GDP growth rate Inflation
Real GDP growth rate 1
Inflation -0.030813091 1
Table 2: Correlation between the Real GDP growth rate of Australia and inflation
Source: (Created by Author)
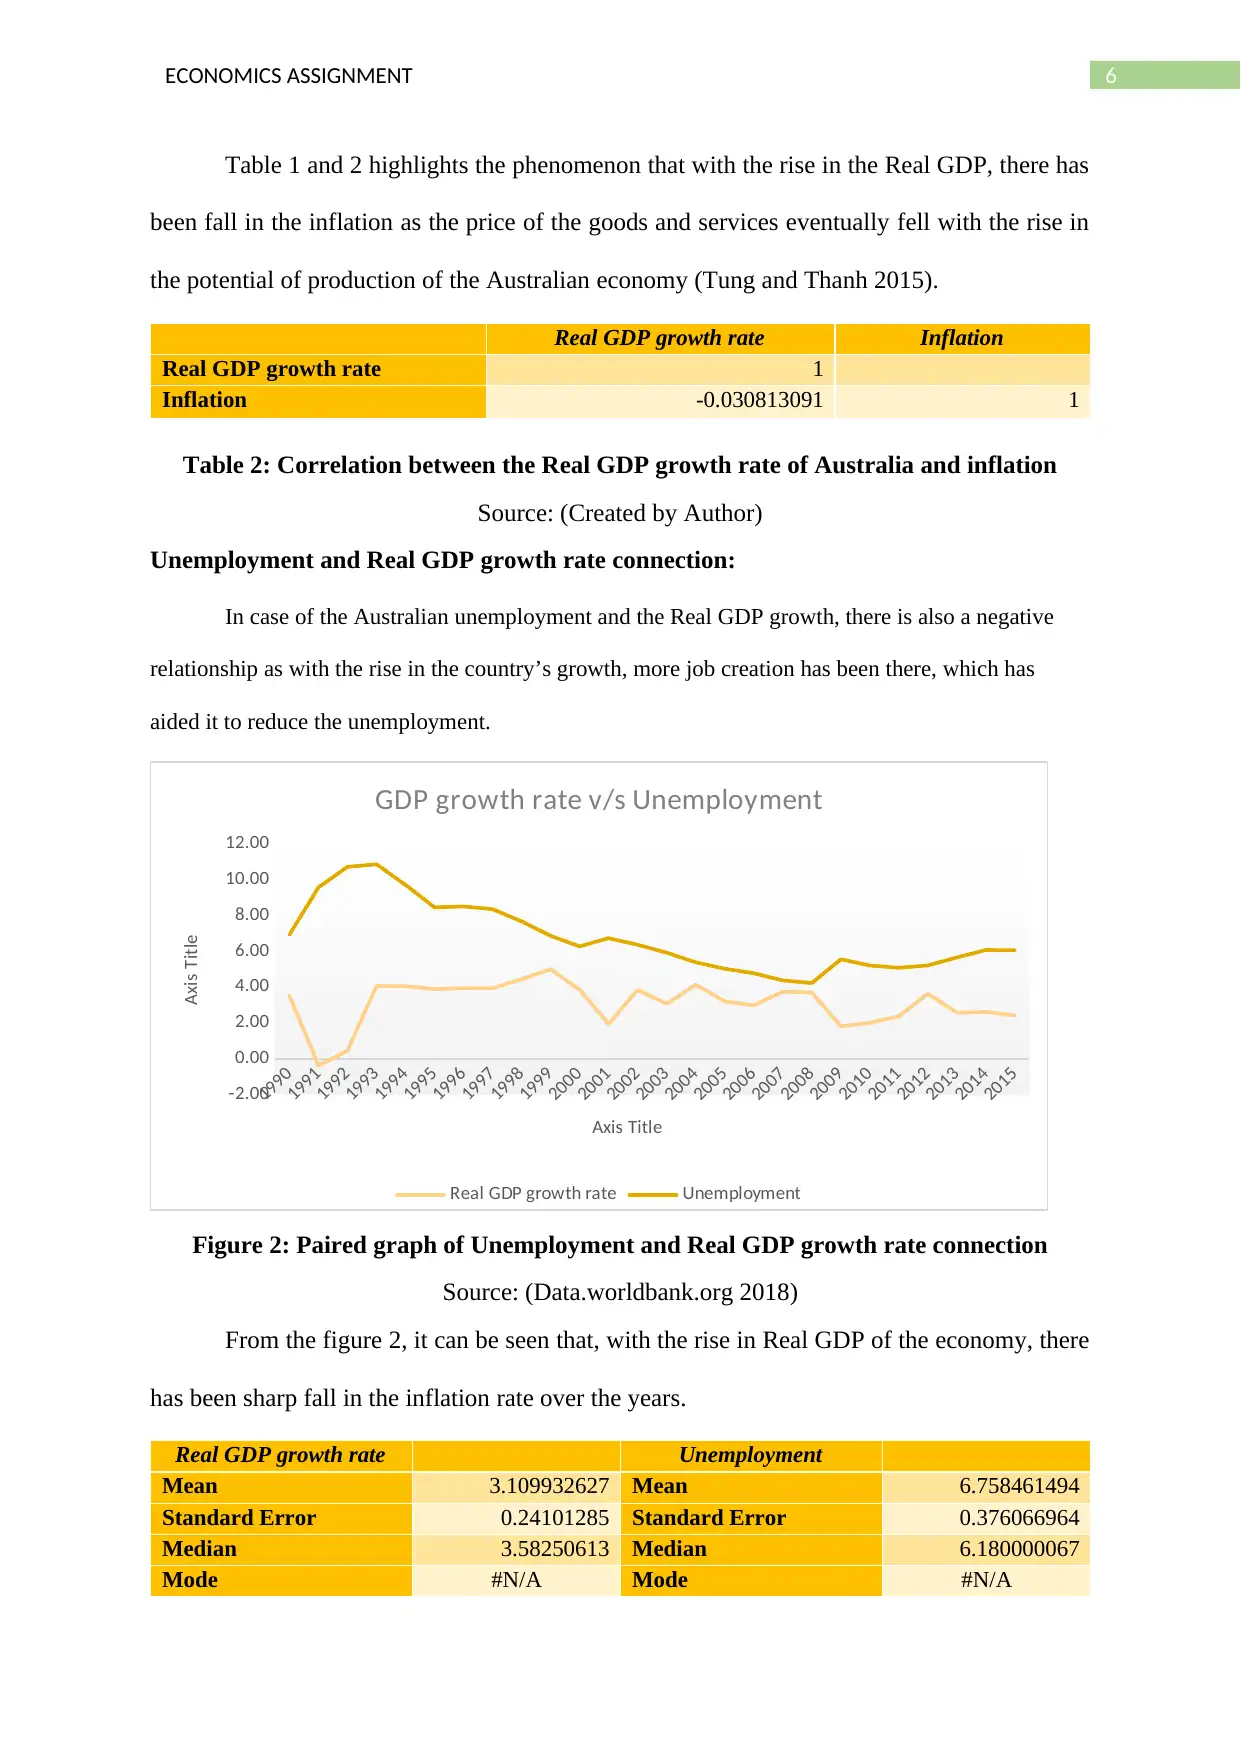
Unemployment and Real GDP growth rate connection:
In case of the Australian unemployment and the Real GDP growth, there is also a negative
relationship as with the rise in the country’s growth, more job creation has been there, which has
aided it to reduce the unemployment.
1990
1991
1992
1993
1994
1995
1996
1997
1998
1999
2000
2001
2002
2003
2004
2005
2006
2007
2008
2009
2010
2011
2012
2013
2014
2015
-2.00
0.00
2.00
4.00
6.00
8.00
10.00
12.00
GDP growth rate v/s Unemployment
Real GDP growth rate Unemployment
Axis Title
Axis Title
Figure 2: Paired graph of Unemployment and Real GDP growth rate connection
Source: (Data.worldbank.org 2018)
From the figure 2, it can be seen that, with the rise in Real GDP of the economy, there
has been sharp fall in the inflation rate over the years.
Real GDP growth rate Unemployment
Mean 3.109932627 Mean 6.758461494
Standard Error 0.24101285 Standard Error 0.376066964
Median 3.58250613 Median 6.180000067
Mode #N/A Mode #N/A
Table 1 and 2 highlights the phenomenon that with the rise in the Real GDP, there has
been fall in the inflation as the price of the goods and services eventually fell with the rise in
the potential of production of the Australian economy (Tung and Thanh 2015).
Real GDP growth rate Inflation
Real GDP growth rate 1
Inflation -0.030813091 1
Table 2: Correlation between the Real GDP growth rate of Australia and inflation
Source: (Created by Author)
Unemployment and Real GDP growth rate connection:
In case of the Australian unemployment and the Real GDP growth, there is also a negative
relationship as with the rise in the country’s growth, more job creation has been there, which has
aided it to reduce the unemployment.
1990
1991
1992
1993
1994
1995
1996
1997
1998
1999
2000
2001
2002
2003
2004
2005
2006
2007
2008
2009
2010
2011
2012
2013
2014
2015
-2.00
0.00
2.00
4.00
6.00
8.00
10.00
12.00
GDP growth rate v/s Unemployment
Real GDP growth rate Unemployment
Axis Title
Axis Title
Figure 2: Paired graph of Unemployment and Real GDP growth rate connection
Source: (Data.worldbank.org 2018)
From the figure 2, it can be seen that, with the rise in Real GDP of the economy, there
has been sharp fall in the inflation rate over the years.
Real GDP growth rate Unemployment
Mean 3.109932627 Mean 6.758461494
Standard Error 0.24101285 Standard Error 0.376066964
Median 3.58250613 Median 6.180000067
Mode #N/A Mode #N/A
⊘ This is a preview!⊘
Do you want full access?
Subscribe today to unlock all pages.
Trusted by 1+ million students worldwide
7ECONOMICS ASSIGNMENT
Standard Deviation 1.228929223 Standard Deviation 1.917572789
Sample Variance 1.510267035 Sample Variance 3.677085402
Kurtosis 1.661107682 Kurtosis -0.294397285
Skewness -1.22479417 Skewness 0.82510807
Range 5.382126182 Range 6.639999866
Minimum -0.37537231 Minimum 4.230000019
Maximum 5.006753877 Maximum 10.86999989
Sum 80.85824831 Sum 175.7199988
Count 26 Count 26
Table 3: Summary statistics of Unemployment and Real GDP growth rate connection
Source: (Created by Author)
From the figure 3 and 4, it can be found that Australian economy has been facing
negative relationship between the Real GDP growth rate and the unemployment rate. As the
economy moves forward, more job has been created leading to fall in the unemployment rate
(Mathews 2017).
Real GDP growth
rate
Unemployment
Real GDP growth rate 1
Unemployment -0.13421 1
Table 4: Correlation between Unemployment and Real GDP growth rate connection
Source: (Created by Author)
Evidence of the business cycle:
Business cycle is one of the essential macroeconomic ideas that provides ability to deal with
the unexpected market crunches. As per the theory of the business cycle, there are five stages in the
growth path of an economy, which are expansion, peak, recession, contraction and tough period
(Kydland et al. 2016). In the cyclical manner these five phases tends to appear in all the economies
and following the trend, policymakers can keep themselves well aware of the phenomenon. Under the
business cycle theory, expansion stage comes into action, when the state is rising and it reaches peak,
when all the economic factors are performing at their best. Post the peak period, there comes the
recession, when the price of the good and services start to rise. Flowing this comes the contraction,
when the productivity of the economy falls and lastly there is tough period, where the productivity
Paraphrase This Document
Need a fresh take? Get an instant paraphrase of this document with our AI Paraphraser
8ECONOMICS ASSIGNMENT
falls to its lowest point and other macroeconomic variables like unemployment, inflation reaches to
their max point (Vegh and Vuletin 2015).
1990
1991
1992
1993
1994
1995
1996
1997
1998
1999
2000
2001
2002
2003
2004
2005
2006
2007
2008
2009
2010
2011
2012
2013
2014
2015
-1.00
0.00
1.00
2.00
3.00
4.00
5.00
6.00
Real GDP growth rate
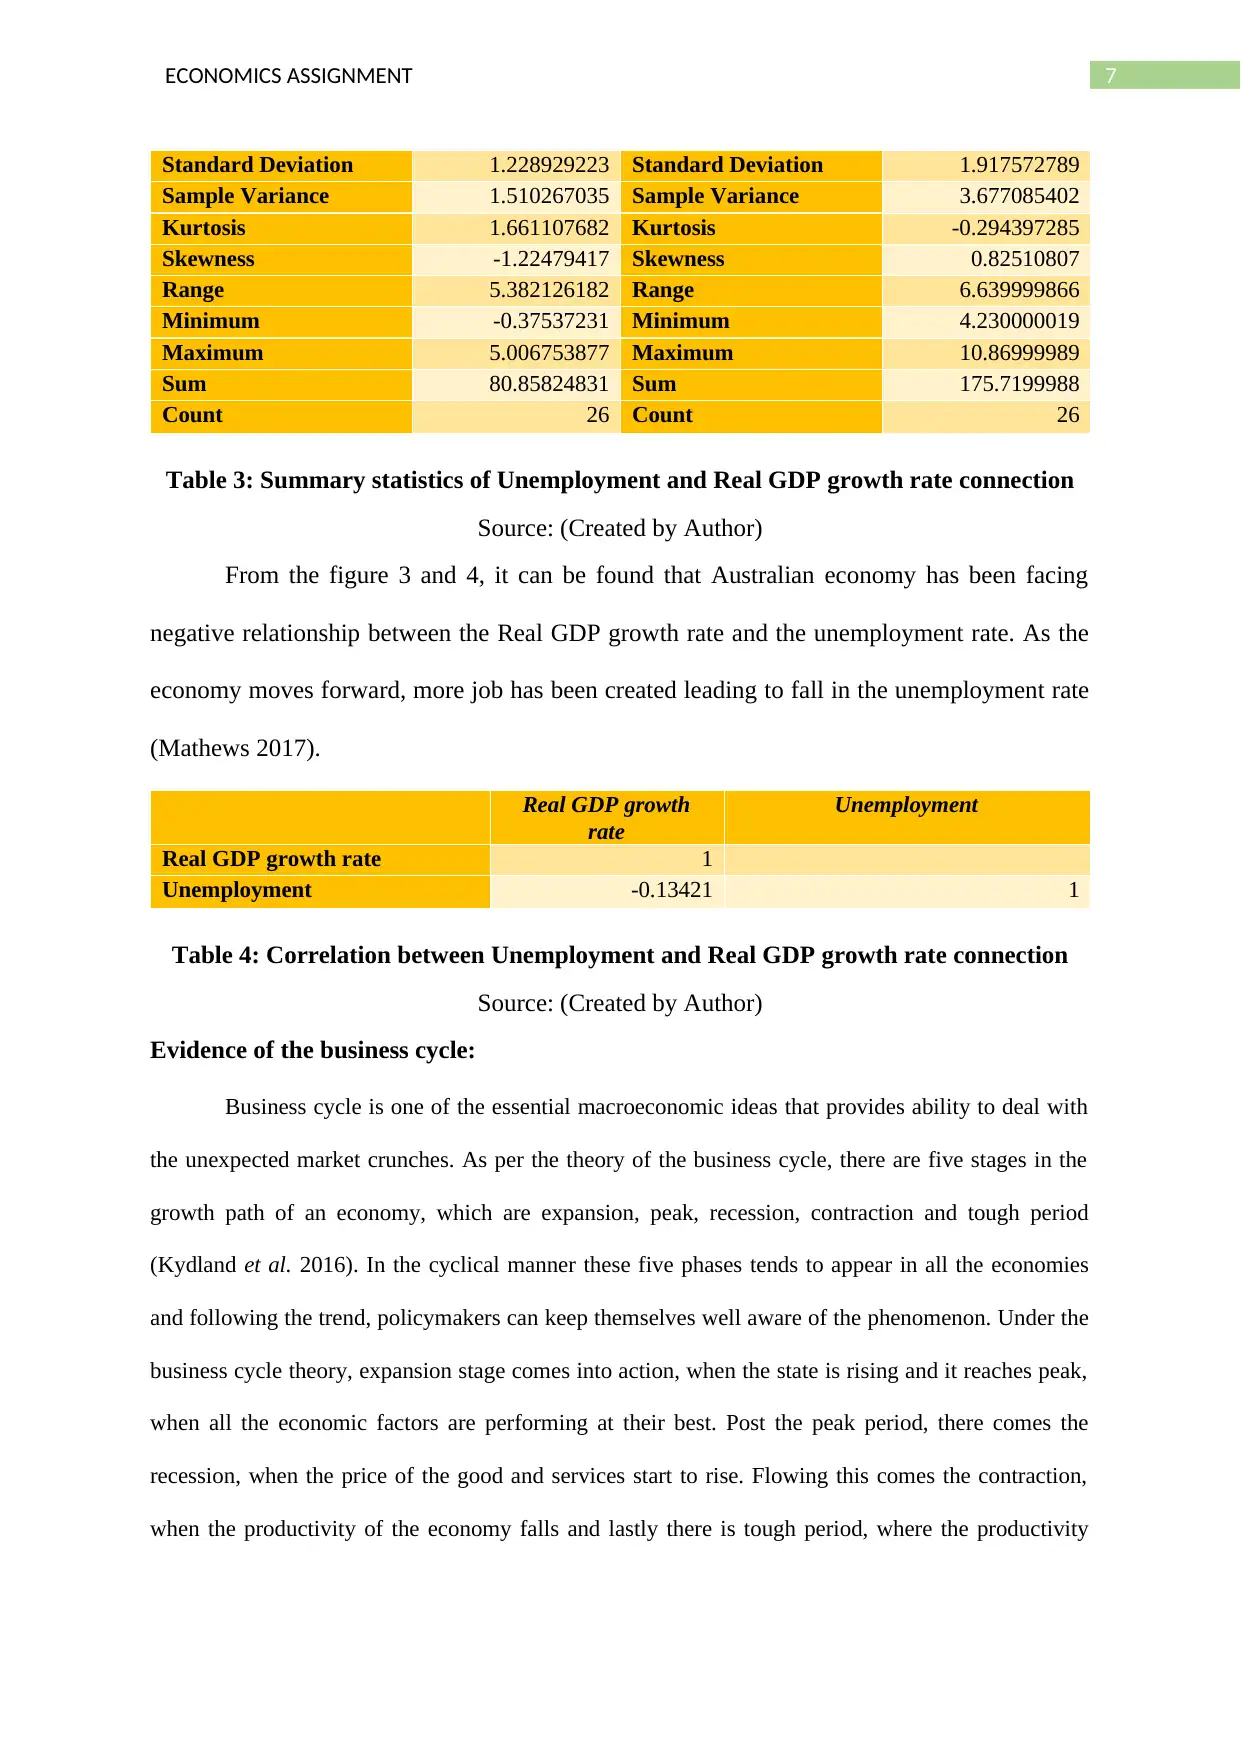
Figure 3: Real GDP growth rate of Australia
Source: (Data.worldbank.org 2018)
Considering these phenomenon it can be said that Australian economy has been going
through the expansion stage as the economy has been facing large amount of shift in its GDP
rate. As the figure 3 depicts, Real GDP of the economy has been increasing at a moderate rate
highlighting the fact that it has been going through the growth stage, where the
macroeconomic factors like export, employment has been rising contrary to the fall in the
unemployment rate and the inflation (Murray 2017).
Relationship between Real exchange rates and net exports of the USA and Australia:
In case of the Real exchange rates and net exports of the USA and Australia, there lies a
negative relationship. As the real exchange rate of Australia rises it leads to fall in the net export
owing to the fall in the demand of the Australian goods and services in the US market (Nevile 2016).
falls to its lowest point and other macroeconomic variables like unemployment, inflation reaches to
their max point (Vegh and Vuletin 2015).
1990
1991
1992
1993
1994
1995
1996
1997
1998
1999
2000
2001
2002
2003
2004
2005
2006
2007
2008
2009
2010
2011
2012
2013
2014
2015
-1.00
0.00
1.00
2.00
3.00
4.00
5.00
6.00
Real GDP growth rate
Figure 3: Real GDP growth rate of Australia
Source: (Data.worldbank.org 2018)
Considering these phenomenon it can be said that Australian economy has been going
through the expansion stage as the economy has been facing large amount of shift in its GDP
rate. As the figure 3 depicts, Real GDP of the economy has been increasing at a moderate rate
highlighting the fact that it has been going through the growth stage, where the
macroeconomic factors like export, employment has been rising contrary to the fall in the
unemployment rate and the inflation (Murray 2017).
Relationship between Real exchange rates and net exports of the USA and Australia:
In case of the Real exchange rates and net exports of the USA and Australia, there lies a
negative relationship. As the real exchange rate of Australia rises it leads to fall in the net export
owing to the fall in the demand of the Australian goods and services in the US market (Nevile 2016).
9ECONOMICS ASSIGNMENT
1990
1991
1992
1993
1994
1995
1996
1997
1998
1999
2000
2001
2002
2003
2004
2005
2006
2007
2008
2009
2010
2011
2012
2013
2014
2015
-720.00
-640.00
-560.00
-480.00
-400.00
-320.00
-240.00
-160.00
-80.00
0.00
80.00
160.00
240.00
320.00
Net export v/s Reac exchange rate
Net export Real exchange rate
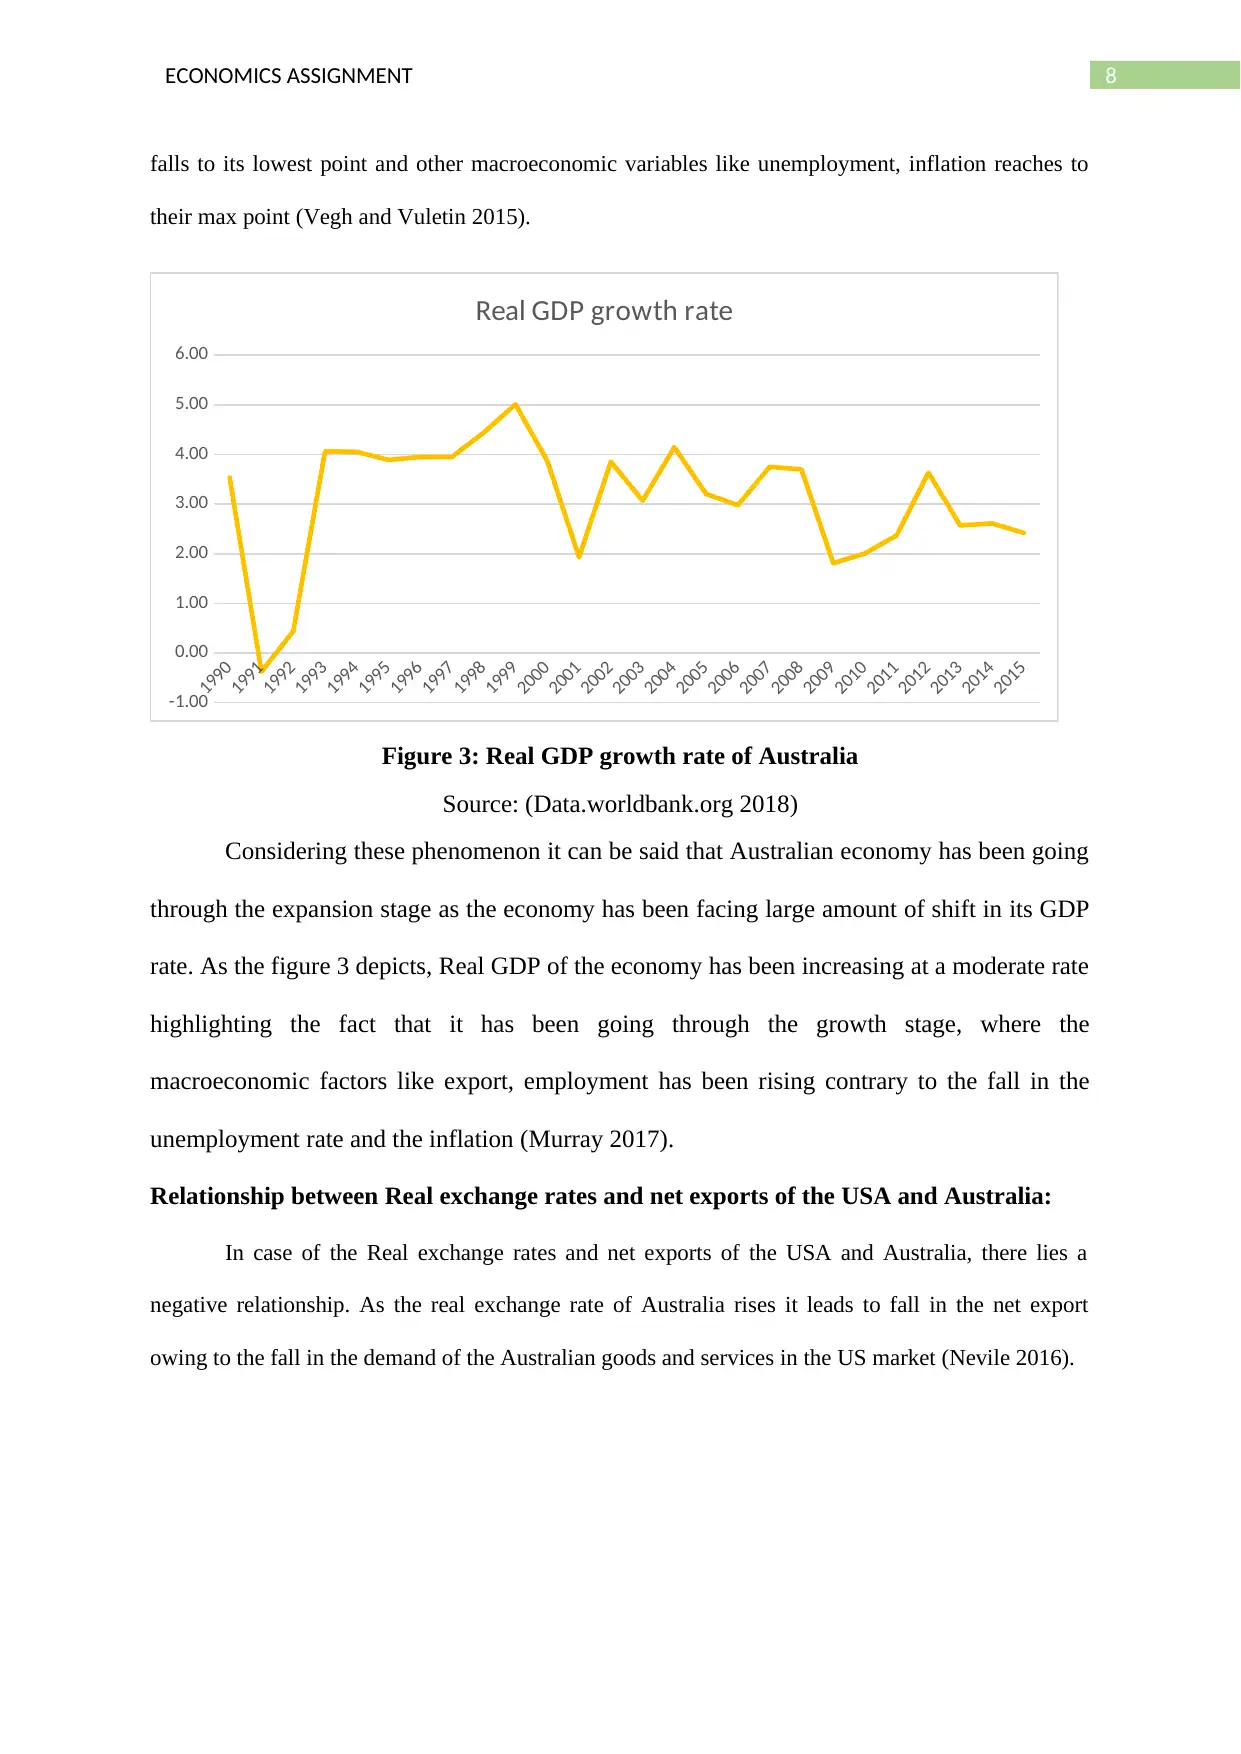
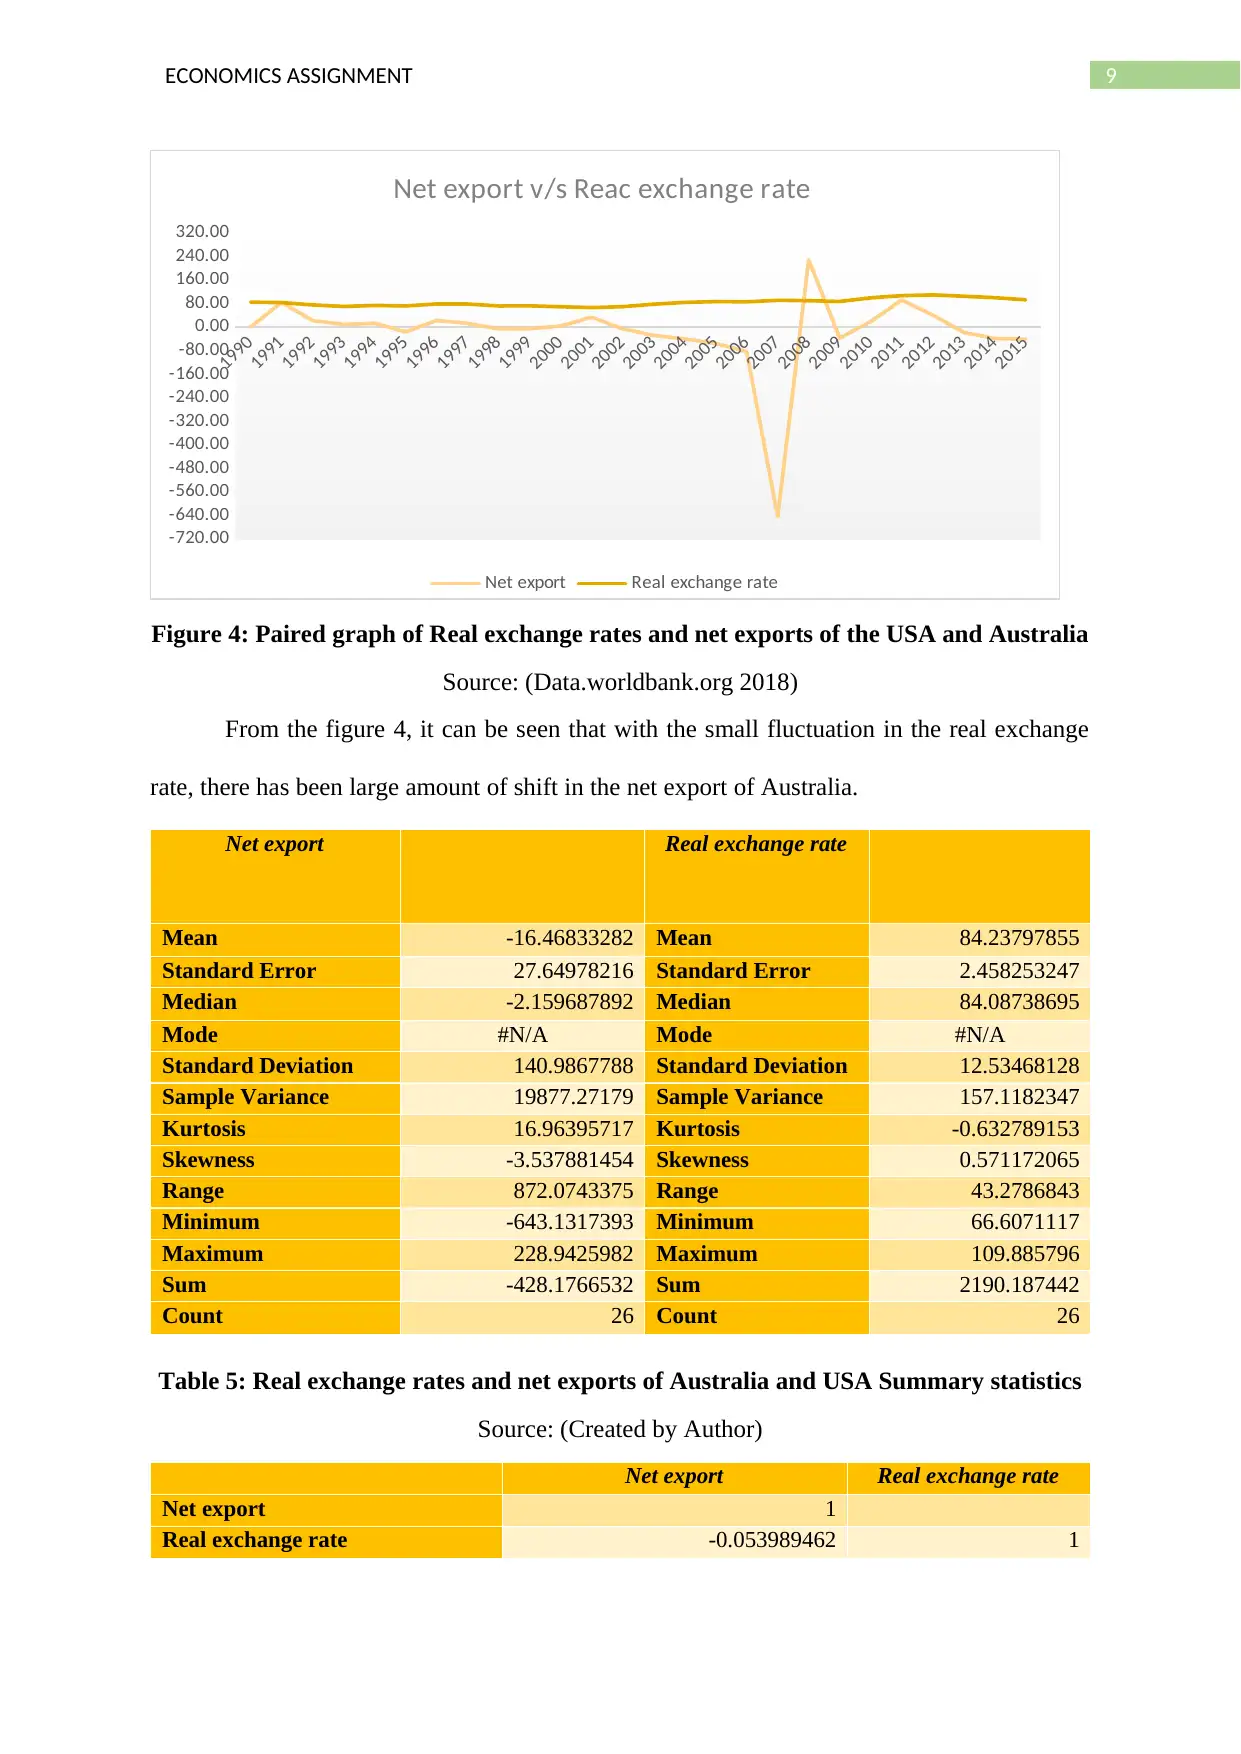
Figure 4: Paired graph of Real exchange rates and net exports of the USA and Australia
Source: (Data.worldbank.org 2018)
From the figure 4, it can be seen that with the small fluctuation in the real exchange
rate, there has been large amount of shift in the net export of Australia.
Net export Real exchange rate
Mean -16.46833282 Mean 84.23797855
Standard Error 27.64978216 Standard Error 2.458253247
Median -2.159687892 Median 84.08738695
Mode #N/A Mode #N/A
Standard Deviation 140.9867788 Standard Deviation 12.53468128
Sample Variance 19877.27179 Sample Variance 157.1182347
Kurtosis 16.96395717 Kurtosis -0.632789153
Skewness -3.537881454 Skewness 0.571172065
Range 872.0743375 Range 43.2786843
Minimum -643.1317393 Minimum 66.6071117
Maximum 228.9425982 Maximum 109.885796
Sum -428.1766532 Sum 2190.187442
Count 26 Count 26
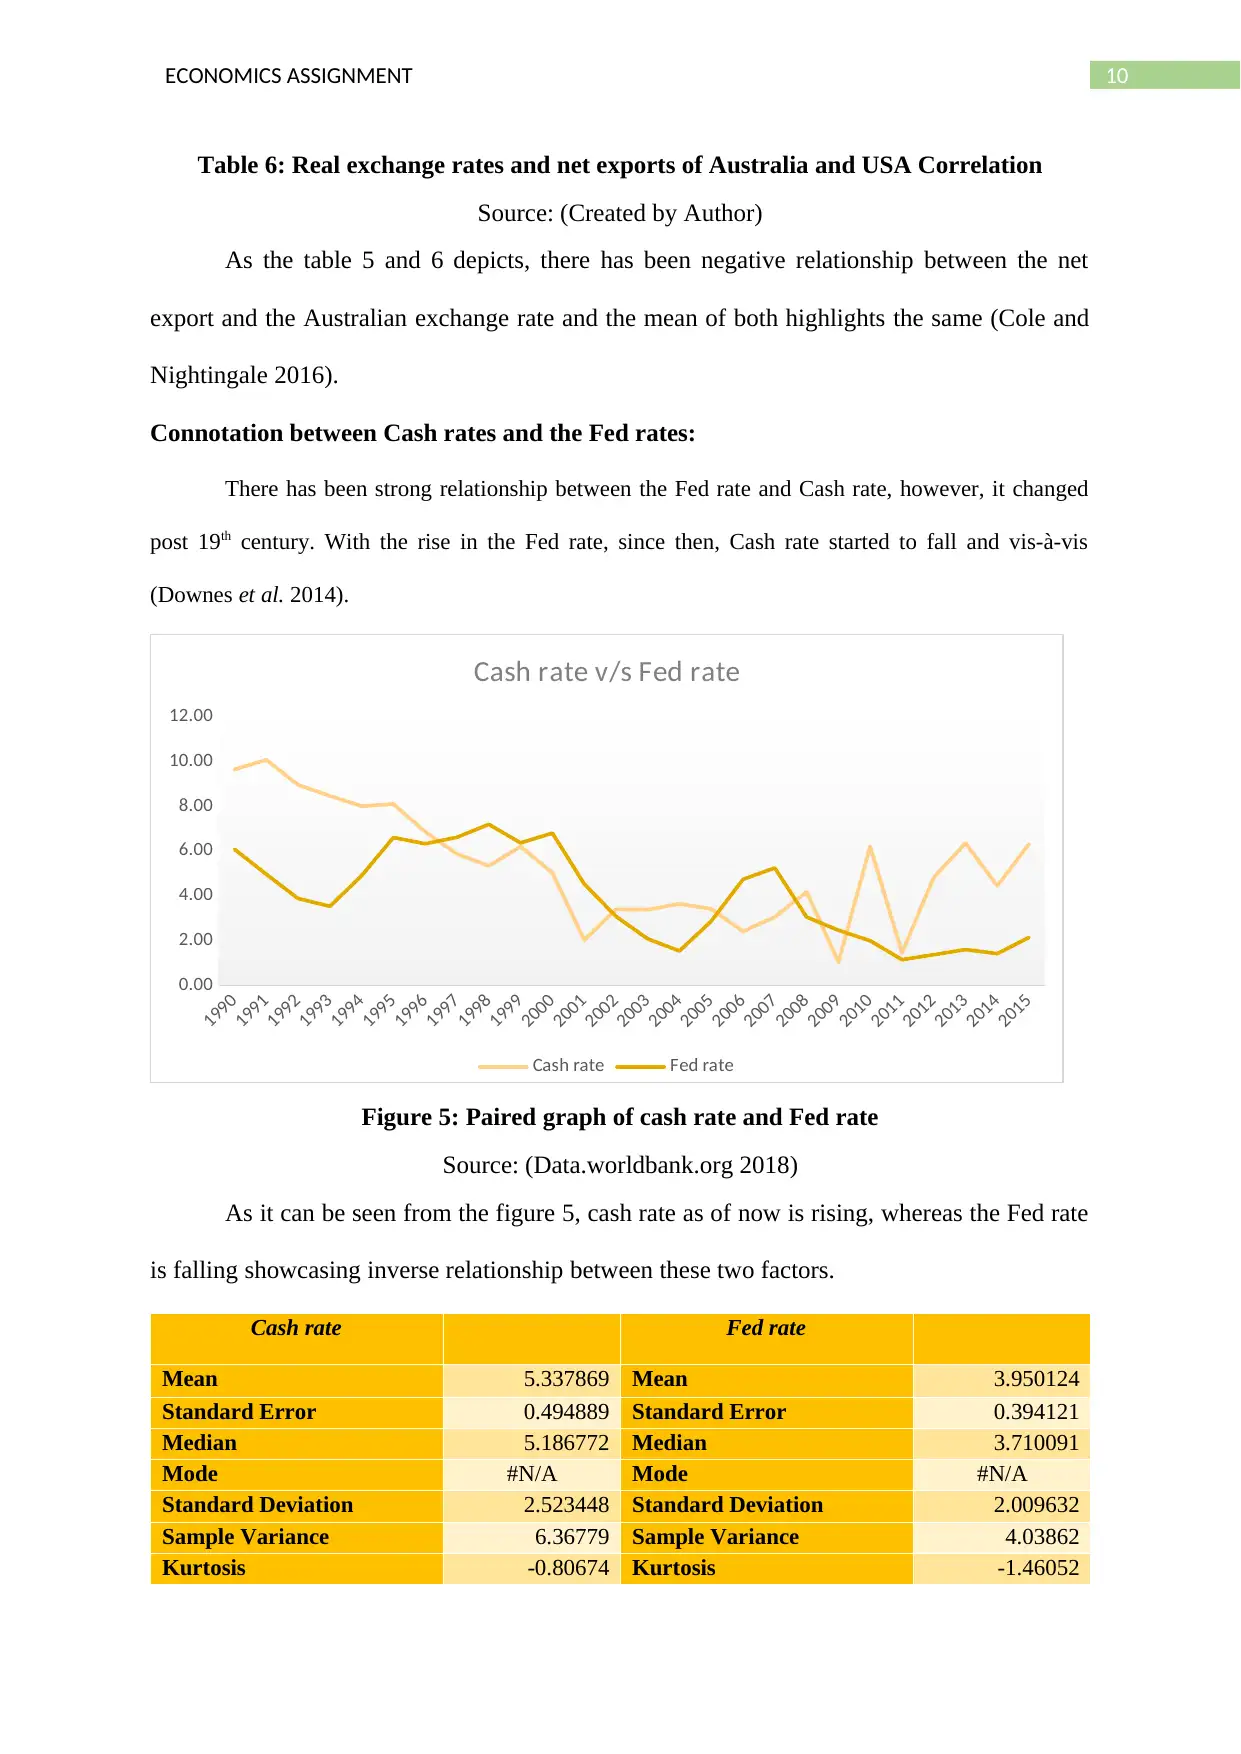
Table 5: Real exchange rates and net exports of Australia and USA Summary statistics
Source: (Created by Author)
Net export Real exchange rate
Net export 1
Real exchange rate -0.053989462 1
1990
1991
1992
1993
1994
1995
1996
1997
1998
1999
2000
2001
2002
2003
2004
2005
2006
2007
2008
2009
2010
2011
2012
2013
2014
2015
-720.00
-640.00
-560.00
-480.00
-400.00
-320.00
-240.00
-160.00
-80.00
0.00
80.00
160.00
240.00
320.00
Net export v/s Reac exchange rate
Net export Real exchange rate
Figure 4: Paired graph of Real exchange rates and net exports of the USA and Australia
Source: (Data.worldbank.org 2018)
From the figure 4, it can be seen that with the small fluctuation in the real exchange
rate, there has been large amount of shift in the net export of Australia.
Net export Real exchange rate
Mean -16.46833282 Mean 84.23797855
Standard Error 27.64978216 Standard Error 2.458253247
Median -2.159687892 Median 84.08738695
Mode #N/A Mode #N/A
Standard Deviation 140.9867788 Standard Deviation 12.53468128
Sample Variance 19877.27179 Sample Variance 157.1182347
Kurtosis 16.96395717 Kurtosis -0.632789153
Skewness -3.537881454 Skewness 0.571172065
Range 872.0743375 Range 43.2786843
Minimum -643.1317393 Minimum 66.6071117
Maximum 228.9425982 Maximum 109.885796
Sum -428.1766532 Sum 2190.187442
Count 26 Count 26
Table 5: Real exchange rates and net exports of Australia and USA Summary statistics
Source: (Created by Author)
Net export Real exchange rate
Net export 1
Real exchange rate -0.053989462 1
⊘ This is a preview!⊘
Do you want full access?
Subscribe today to unlock all pages.
Trusted by 1+ million students worldwide
10ECONOMICS ASSIGNMENT
Table 6: Real exchange rates and net exports of Australia and USA Correlation
Source: (Created by Author)
As the table 5 and 6 depicts, there has been negative relationship between the net
export and the Australian exchange rate and the mean of both highlights the same (Cole and
Nightingale 2016).
Connotation between Cash rates and the Fed rates:
There has been strong relationship between the Fed rate and Cash rate, however, it changed
post 19th century. With the rise in the Fed rate, since then, Cash rate started to fall and vis-à-vis
(Downes et al. 2014).
1990
1991
1992
1993
1994
1995
1996
1997
1998
1999
2000
2001
2002
2003
2004
2005
2006
2007
2008
2009
2010
2011
2012
2013
2014
2015
0.00
2.00
4.00
6.00
8.00
10.00
12.00
Cash rate v/s Fed rate
Cash rate Fed rate
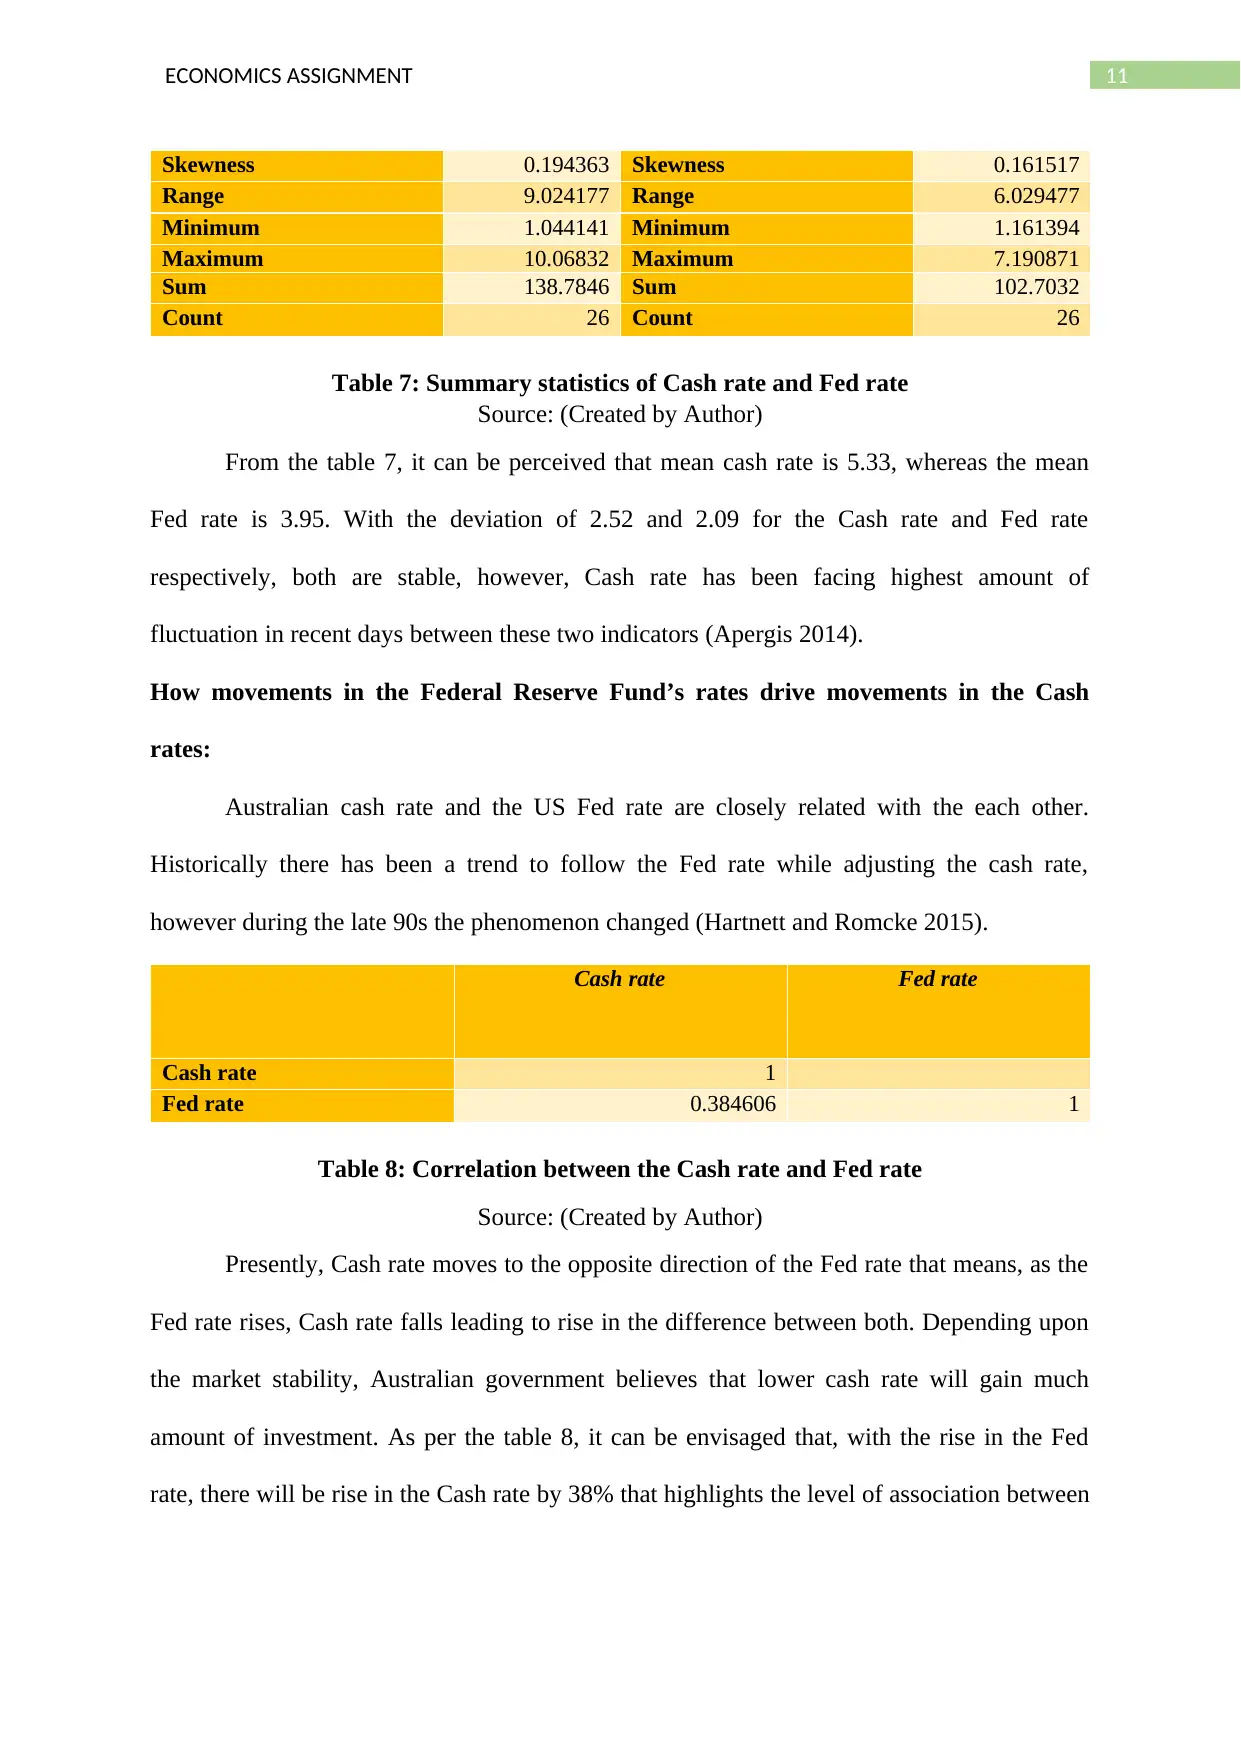
Figure 5: Paired graph of cash rate and Fed rate
Source: (Data.worldbank.org 2018)
As it can be seen from the figure 5, cash rate as of now is rising, whereas the Fed rate
is falling showcasing inverse relationship between these two factors.
Cash rate Fed rate
Mean 5.337869 Mean 3.950124
Standard Error 0.494889 Standard Error 0.394121
Median 5.186772 Median 3.710091
Mode #N/A Mode #N/A
Standard Deviation 2.523448 Standard Deviation 2.009632
Sample Variance 6.36779 Sample Variance 4.03862
Kurtosis -0.80674 Kurtosis -1.46052
Table 6: Real exchange rates and net exports of Australia and USA Correlation
Source: (Created by Author)
As the table 5 and 6 depicts, there has been negative relationship between the net
export and the Australian exchange rate and the mean of both highlights the same (Cole and
Nightingale 2016).
Connotation between Cash rates and the Fed rates:
There has been strong relationship between the Fed rate and Cash rate, however, it changed
post 19th century. With the rise in the Fed rate, since then, Cash rate started to fall and vis-à-vis
(Downes et al. 2014).
1990
1991
1992
1993
1994
1995
1996
1997
1998
1999
2000
2001
2002
2003
2004
2005
2006
2007
2008
2009
2010
2011
2012
2013
2014
2015
0.00
2.00
4.00
6.00
8.00
10.00
12.00
Cash rate v/s Fed rate
Cash rate Fed rate
Figure 5: Paired graph of cash rate and Fed rate
Source: (Data.worldbank.org 2018)
As it can be seen from the figure 5, cash rate as of now is rising, whereas the Fed rate
is falling showcasing inverse relationship between these two factors.
Cash rate Fed rate
Mean 5.337869 Mean 3.950124
Standard Error 0.494889 Standard Error 0.394121
Median 5.186772 Median 3.710091
Mode #N/A Mode #N/A
Standard Deviation 2.523448 Standard Deviation 2.009632
Sample Variance 6.36779 Sample Variance 4.03862
Kurtosis -0.80674 Kurtosis -1.46052
Paraphrase This Document
Need a fresh take? Get an instant paraphrase of this document with our AI Paraphraser
11ECONOMICS ASSIGNMENT
Skewness 0.194363 Skewness 0.161517
Range 9.024177 Range 6.029477
Minimum 1.044141 Minimum 1.161394
Maximum 10.06832 Maximum 7.190871
Sum 138.7846 Sum 102.7032
Count 26 Count 26
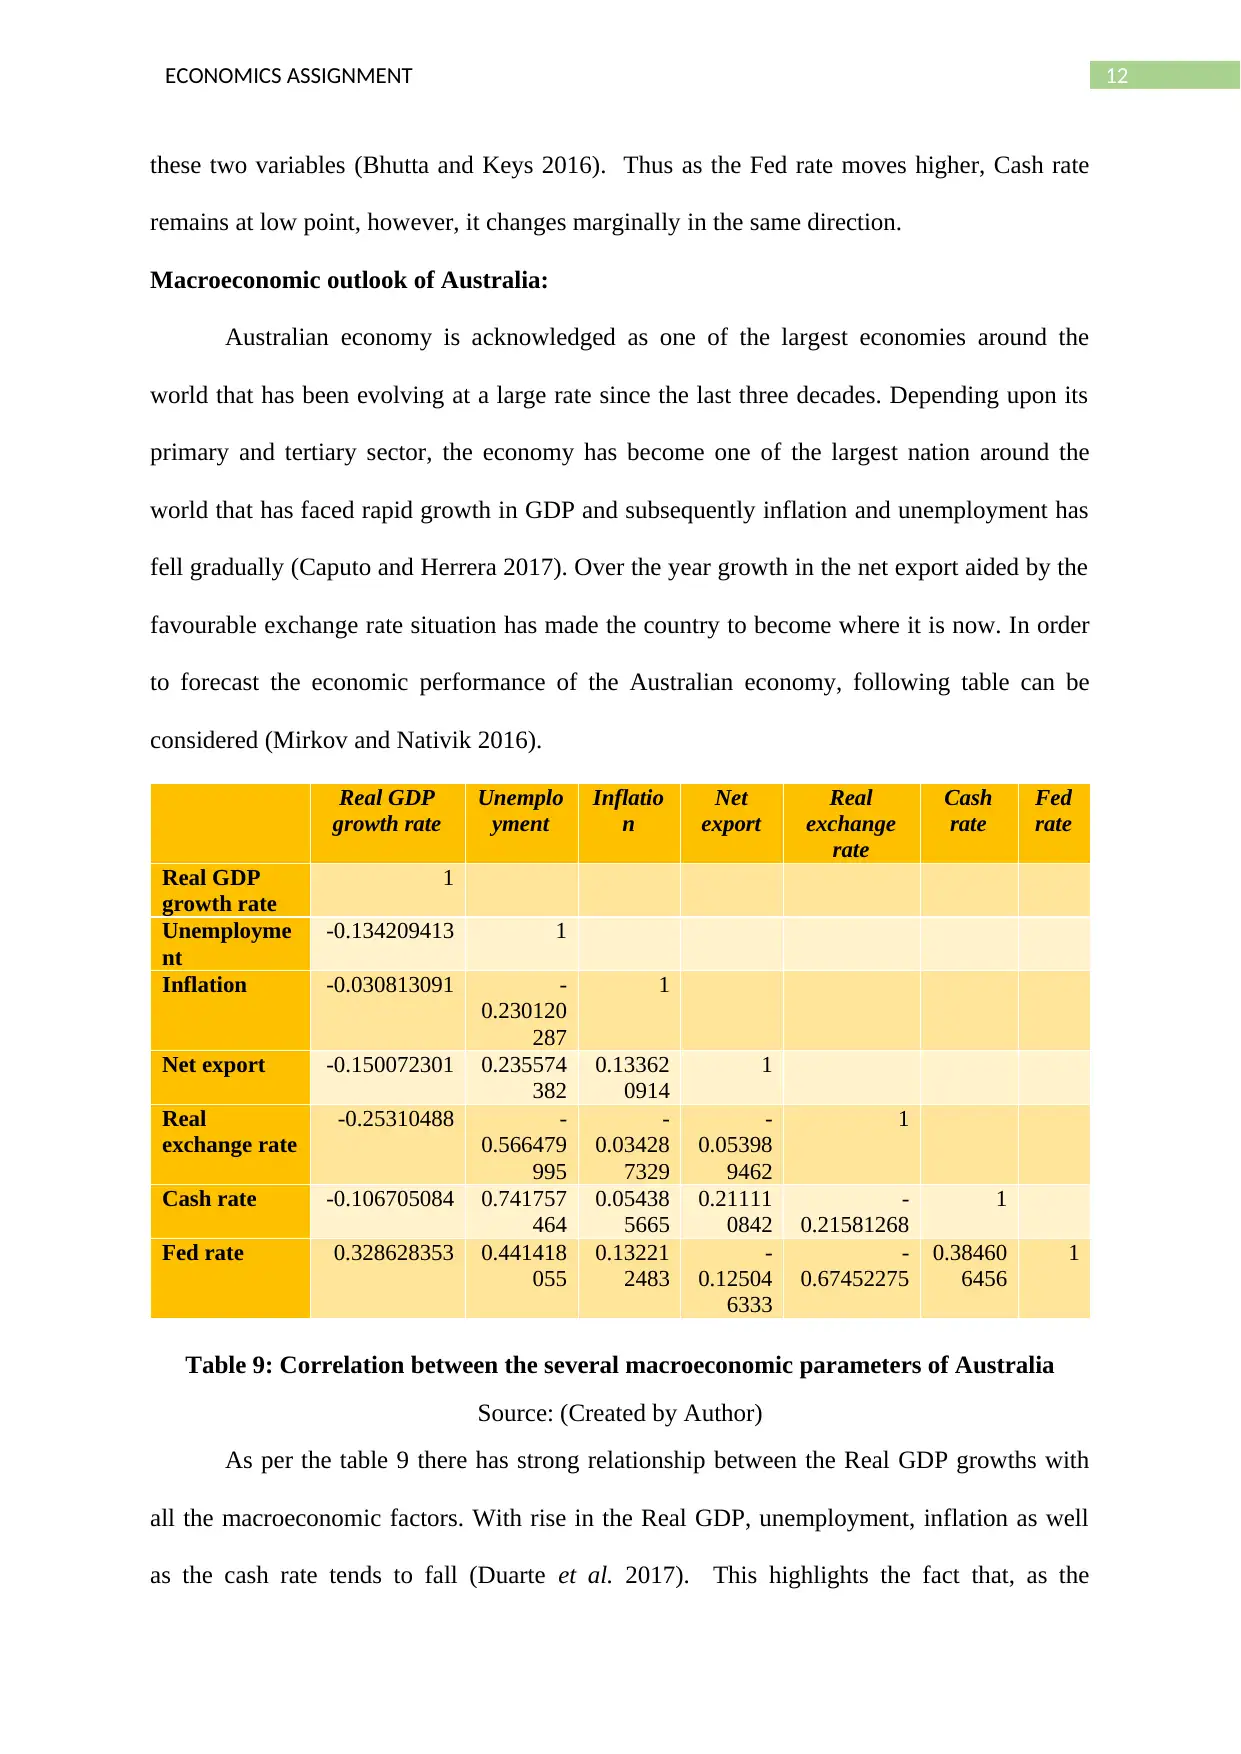
Table 7: Summary statistics of Cash rate and Fed rate
Source: (Created by Author)
From the table 7, it can be perceived that mean cash rate is 5.33, whereas the mean
Fed rate is 3.95. With the deviation of 2.52 and 2.09 for the Cash rate and Fed rate
respectively, both are stable, however, Cash rate has been facing highest amount of
fluctuation in recent days between these two indicators (Apergis 2014).
How movements in the Federal Reserve Fund’s rates drive movements in the Cash
rates:
Australian cash rate and the US Fed rate are closely related with the each other.
Historically there has been a trend to follow the Fed rate while adjusting the cash rate,
however during the late 90s the phenomenon changed (Hartnett and Romcke 2015).
Cash rate Fed rate
Cash rate 1
Fed rate 0.384606 1
Table 8: Correlation between the Cash rate and Fed rate
Source: (Created by Author)
Presently, Cash rate moves to the opposite direction of the Fed rate that means, as the
Fed rate rises, Cash rate falls leading to rise in the difference between both. Depending upon
the market stability, Australian government believes that lower cash rate will gain much
amount of investment. As per the table 8, it can be envisaged that, with the rise in the Fed
rate, there will be rise in the Cash rate by 38% that highlights the level of association between
Skewness 0.194363 Skewness 0.161517
Range 9.024177 Range 6.029477
Minimum 1.044141 Minimum 1.161394
Maximum 10.06832 Maximum 7.190871
Sum 138.7846 Sum 102.7032
Count 26 Count 26
Table 7: Summary statistics of Cash rate and Fed rate
Source: (Created by Author)
From the table 7, it can be perceived that mean cash rate is 5.33, whereas the mean
Fed rate is 3.95. With the deviation of 2.52 and 2.09 for the Cash rate and Fed rate
respectively, both are stable, however, Cash rate has been facing highest amount of
fluctuation in recent days between these two indicators (Apergis 2014).
How movements in the Federal Reserve Fund’s rates drive movements in the Cash
rates:
Australian cash rate and the US Fed rate are closely related with the each other.
Historically there has been a trend to follow the Fed rate while adjusting the cash rate,
however during the late 90s the phenomenon changed (Hartnett and Romcke 2015).
Cash rate Fed rate
Cash rate 1
Fed rate 0.384606 1
Table 8: Correlation between the Cash rate and Fed rate
Source: (Created by Author)
Presently, Cash rate moves to the opposite direction of the Fed rate that means, as the
Fed rate rises, Cash rate falls leading to rise in the difference between both. Depending upon
the market stability, Australian government believes that lower cash rate will gain much
amount of investment. As per the table 8, it can be envisaged that, with the rise in the Fed
rate, there will be rise in the Cash rate by 38% that highlights the level of association between
12ECONOMICS ASSIGNMENT
these two variables (Bhutta and Keys 2016). Thus as the Fed rate moves higher, Cash rate
remains at low point, however, it changes marginally in the same direction.
Macroeconomic outlook of Australia:
Australian economy is acknowledged as one of the largest economies around the
world that has been evolving at a large rate since the last three decades. Depending upon its
primary and tertiary sector, the economy has become one of the largest nation around the
world that has faced rapid growth in GDP and subsequently inflation and unemployment has
fell gradually (Caputo and Herrera 2017). Over the year growth in the net export aided by the
favourable exchange rate situation has made the country to become where it is now. In order
to forecast the economic performance of the Australian economy, following table can be
considered (Mirkov and Nativik 2016).
Real GDP
growth rate
Unemplo
yment
Inflatio
n
Net
export
Real
exchange
rate
Cash
rate
Fed
rate
Real GDP
growth rate
1
Unemployme
nt
-0.134209413 1
Inflation -0.030813091 -
0.230120
287
1
Net export -0.150072301 0.235574
382
0.13362
0914
1
Real
exchange rate
-0.25310488 -
0.566479
995
-
0.03428
7329
-
0.05398
9462
1
Cash rate -0.106705084 0.741757
464
0.05438
5665
0.21111
0842
-
0.21581268
1
Fed rate 0.328628353 0.441418
055
0.13221
2483
-
0.12504
6333
-
0.67452275
0.38460
6456
1
Table 9: Correlation between the several macroeconomic parameters of Australia
Source: (Created by Author)
As per the table 9 there has strong relationship between the Real GDP growths with
all the macroeconomic factors. With rise in the Real GDP, unemployment, inflation as well
as the cash rate tends to fall (Duarte et al. 2017). This highlights the fact that, as the
⊘ This is a preview!⊘
Do you want full access?
Subscribe today to unlock all pages.
Trusted by 1+ million students worldwide
1 out of 17
Related Documents


Your All-in-One AI-Powered Toolkit for Academic Success.
+13062052269
info@desklib.com
Available 24*7 on WhatsApp / Email
![[object Object]](/_next/static/media/star-bottom.7253800d.svg)
Unlock your academic potential
Copyright © 2020–2026 A2Z Services. All Rights Reserved. Developed and managed by ZUCOL.