Economics Report: Analysis of Australia's Economic Performance
VerifiedAdded on 2020/03/04
|15
|2918
|63
Report
AI Summary
This economics report provides a comprehensive analysis of the Australian economy, examining key indicators such as real GDP, GDP growth rate, and GDP per capita to assess production output performance. It delves into the labor market, analyzing unemployment trends, types of unemployment, and government measures to achieve full employment. The report also explores price level analysis, defining inflation, identifying its causes in Australia, and outlining government measures to achieve stable prices. The analysis covers the period up to 2016, providing valuable insights into the country's economic strengths and challenges, along with the government's strategies to manage and improve economic performance. The report highlights the shift away from resource dependence and the impact of government policies on various economic aspects.
Running head: ECONOMICS
Economics
Name of the Student
Name of the University
Authors Note
Course ID
Economics
Name of the Student
Name of the University
Authors Note
Course ID
Paraphrase This Document
Need a fresh take? Get an instant paraphrase of this document with our AI Paraphraser
1ECONOMICS
Table of Contents
Introduction:...............................................................................................................................2
Production Output Performance Analysis:.................................................................................2
Real GDP:..................................................................................................................................2
Real GDP Growth Rate:.............................................................................................................3
Real GDP per capita Analysis:...................................................................................................4
Performance trend of the economy:...........................................................................................5
Government measures to achieve production output performance:...........................................6
Labour Market Analysis:............................................................................................................6
Unemployment trend based on unemployment rates:................................................................6
Definition of unemployment and types of unemployment in an economy:...............................7
Types of unemployment:............................................................................................................7
Types of unemployment in Australia:........................................................................................7
Government measures adopted to achieve full employment:....................................................8
Price level analysis:....................................................................................................................8
Definition and typical causes of inflation:.................................................................................9
Causes of inflation in Australia:...............................................................................................10
Government measure to achieve stable price:..........................................................................10
Conclusion:..............................................................................................................................10
Reference List:.........................................................................................................................12
2ECONOMICS
Introduction:
The economy of Australia is considered as one of the developed and largest mixed
economies in the world having a GDP of AUD $1.67 trillion for the year 2016. The total
wealth of Australia is AUD $8.9 trillion for the year ended June 2016 (Taussig, 2013). In the
year 2016, Australia was regarded as the 12th largest economy in terms of the nominal GDP
and regarded as the 19th largest measured by the PPP adjusted GDP standing approximately
around 1.0% of the world economy. Australia is considered as the 25th largest exporter and
20th largest importer.
The economy of Australia is dominated by the service sector consisting of 73% of
GDP. The mining sector on the other hand comprises of 7% of the GDP along with services
to mining and attaining a height of mining boom in the year 2009-10. The total amount of
value added of the mining industry stood 8.4% of the GDP (Frank et al., 2015). The economy
of Australia is mainly reliant on the mining and agriculture sector, which is relative to the
other developed countries as the products are exported to the eastern Asian market. In spite of
the recent decline, the economy of Australia has been resilient and stable since July 1991.
Production Output Performance Analysis:
Real GDP:
Real GDP is understood as the macroeconomic measure of the value of economic
output adjusted for the changing prices. The adjustment transforms the monetary value
measurement and the nominal GDP into the index for the quantity of total output (Sloman et
al., 2013). The real GDP of Australia stood 1204.62 billion US dollars in 2016. The GDP
value of Australia stood 1.94 percent of the world economy. The GDP of Australia averaged
⊘ This is a preview!⊘
Do you want full access?
Subscribe today to unlock all pages.
Trusted by 1+ million students worldwide
3ECONOMICS
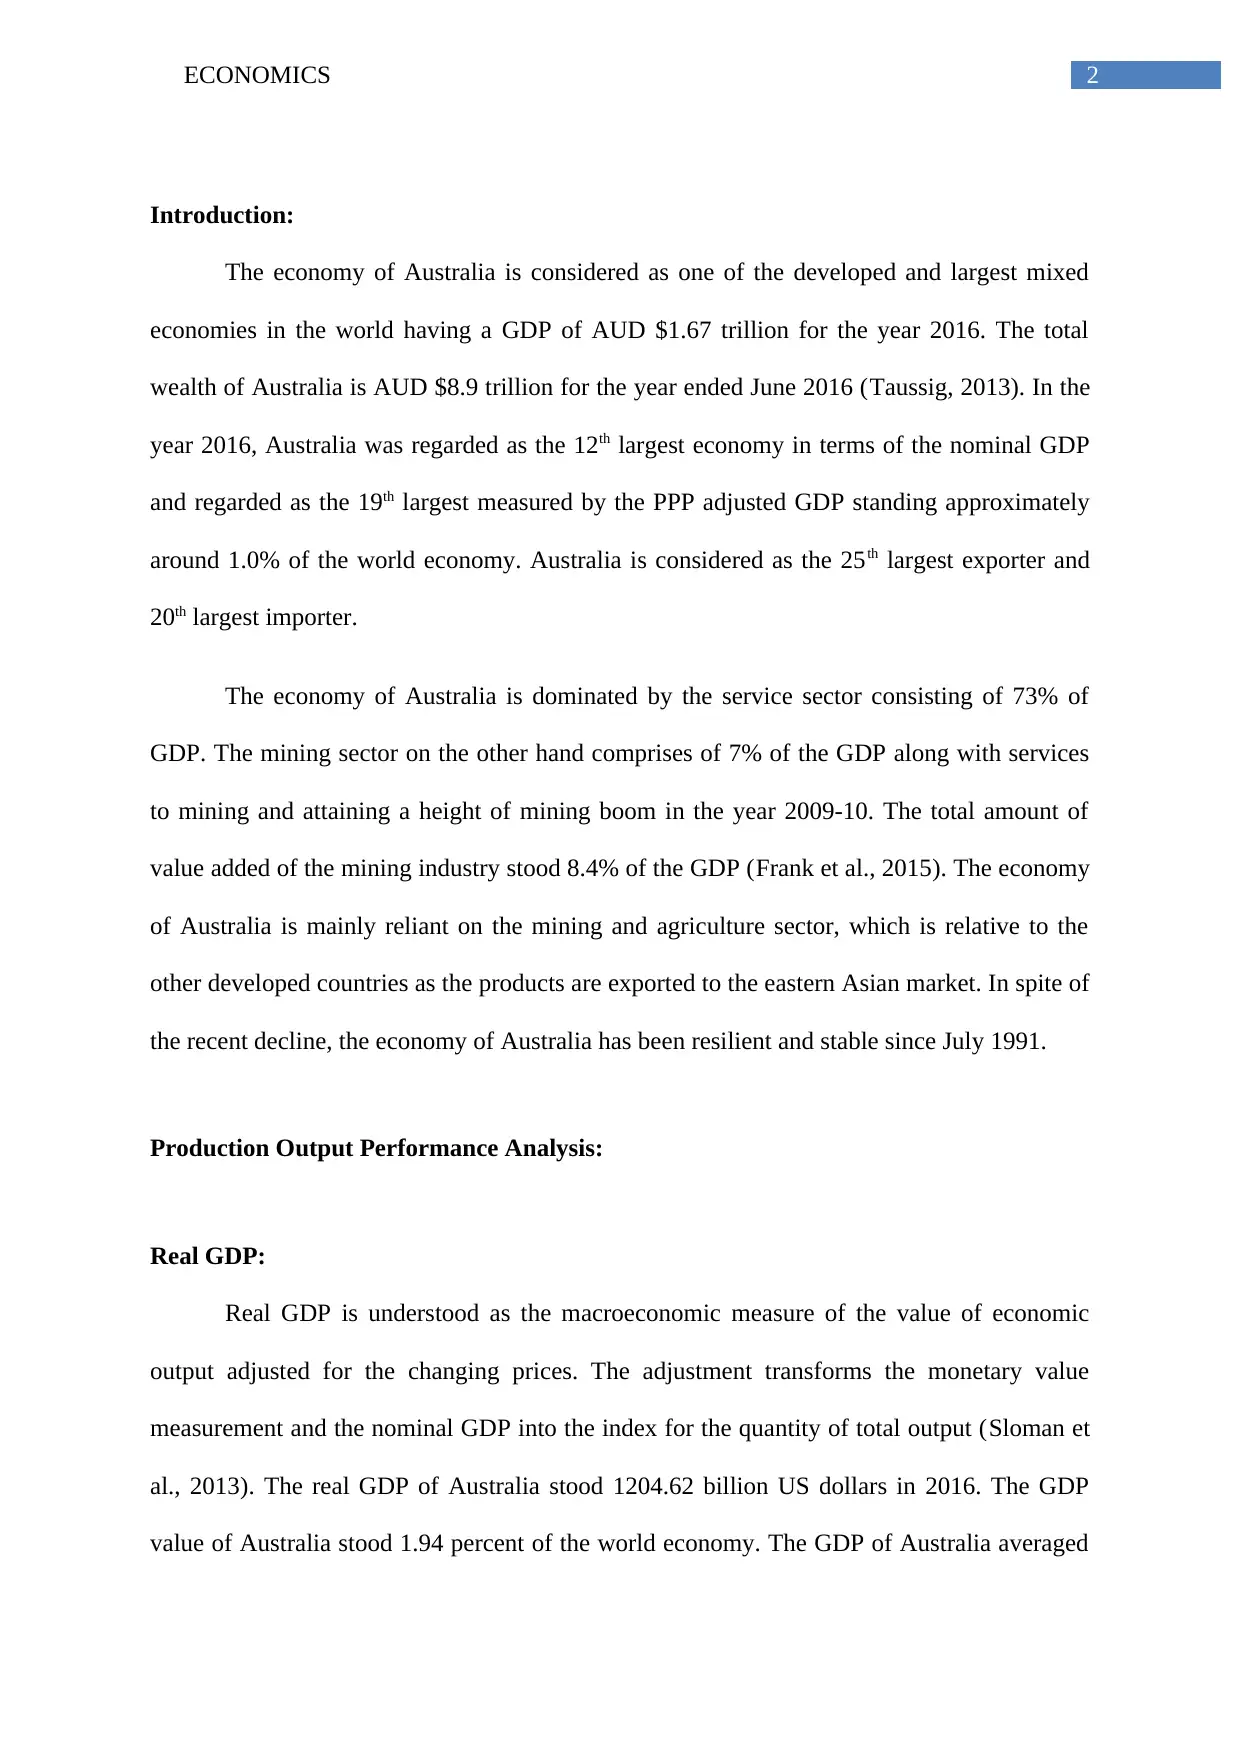
4.1.44 USD Billion from 1960 until 2016 and reached an all time high of 1567.18 USD
billion in the year 2013.
Figure 1: Real GDP of Australia
(Source: Tradingeconomics.com 2017)
Real GDP Growth Rate:
The Real GDP Growth Rate measures the economic growth concerning the gross
domestic product (GDP) from one period of to another period adjusted for inflation
(Bernanke et al., 2015). The Real GDP Growth Rate is expressed in the real opposed to the
nominal terms.
The economy of Australia rose by 0.3 percent in the month of March quarter 2017 in
comparison to the 1.1 percent growth in the quarter of December 2016. Positive assistance
was made from final domestic demand and alterations that were made in the inventory were
unable to counterbalance the feeble net trade and dropped in dwelling investment (Georgellis
et al., 2015). At present Australia has recorded 103 quarters with only two succesive quarters
Paraphrase This Document
Need a fresh take? Get an instant paraphrase of this document with our AI Paraphraser
4ECONOMICS
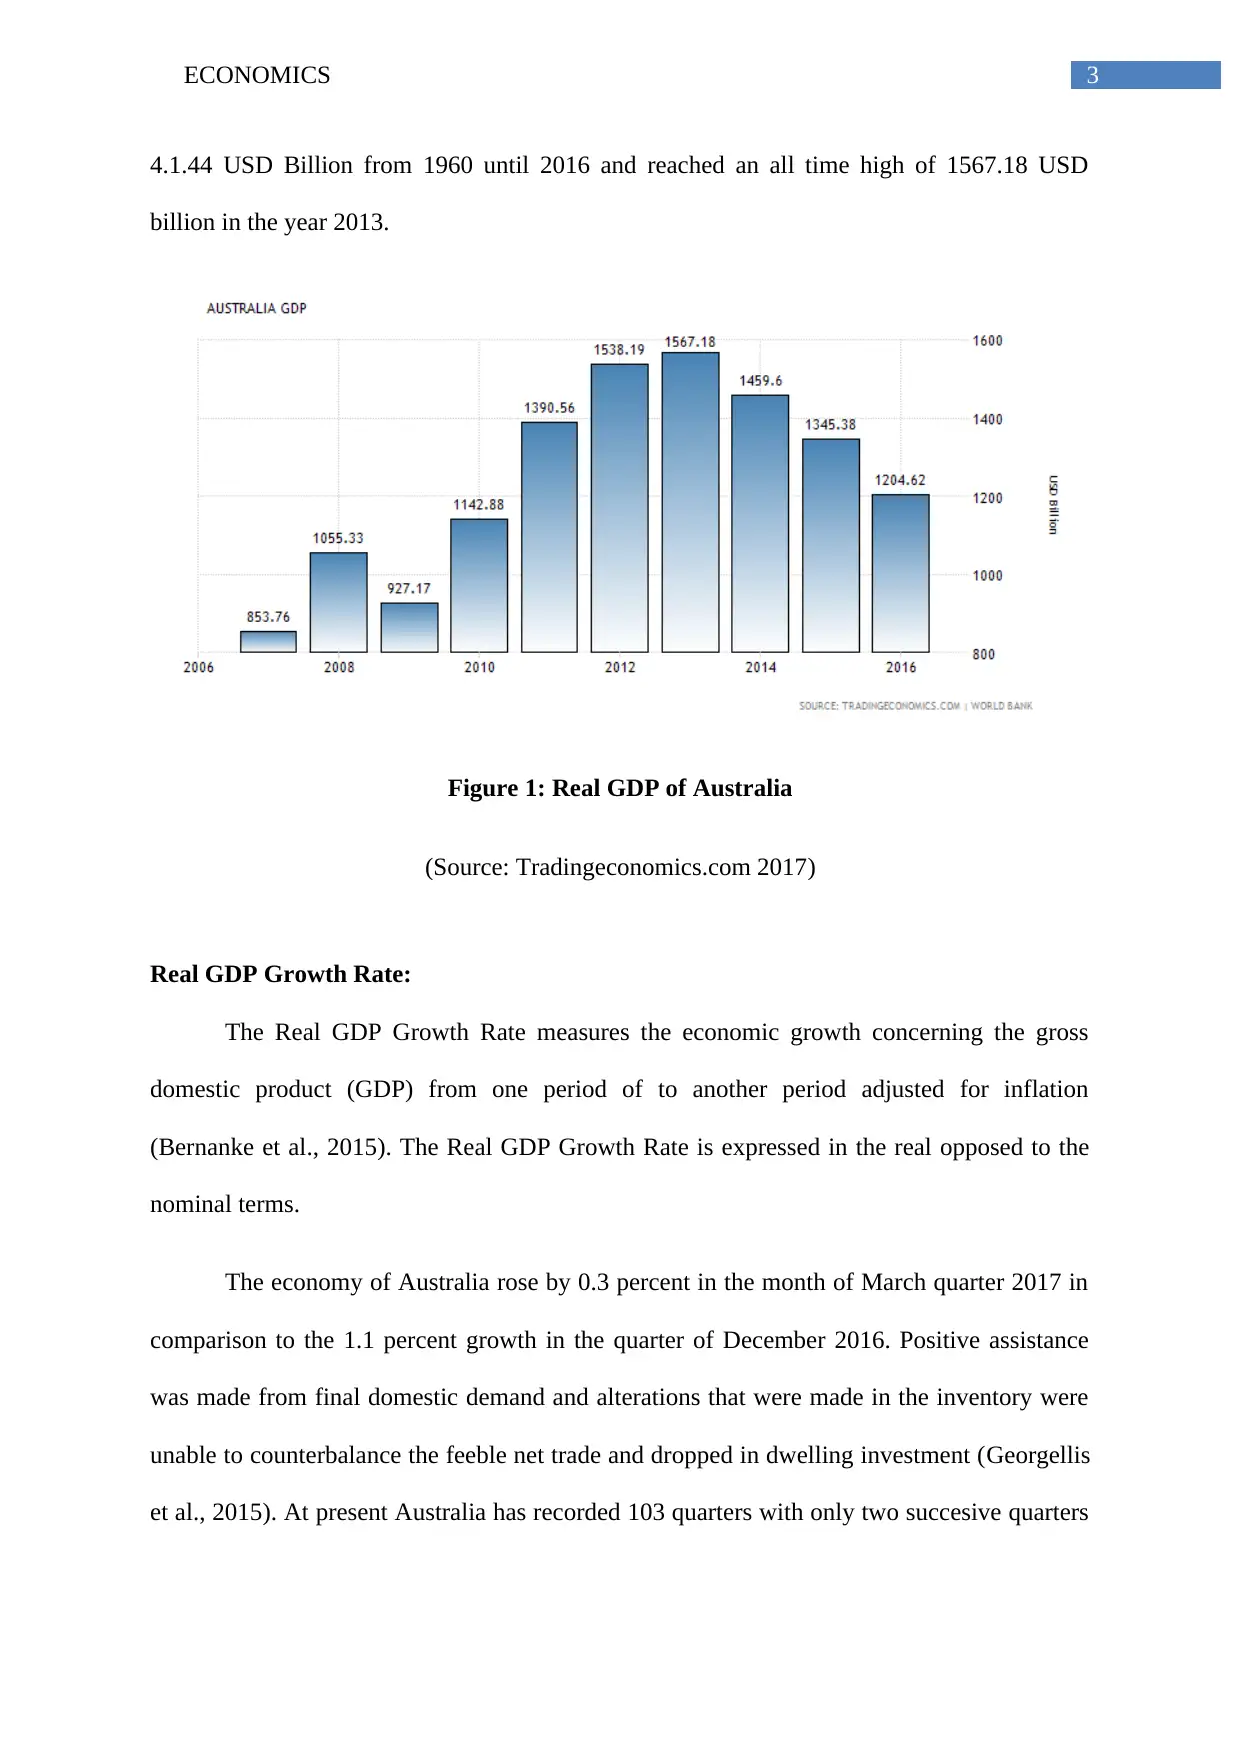
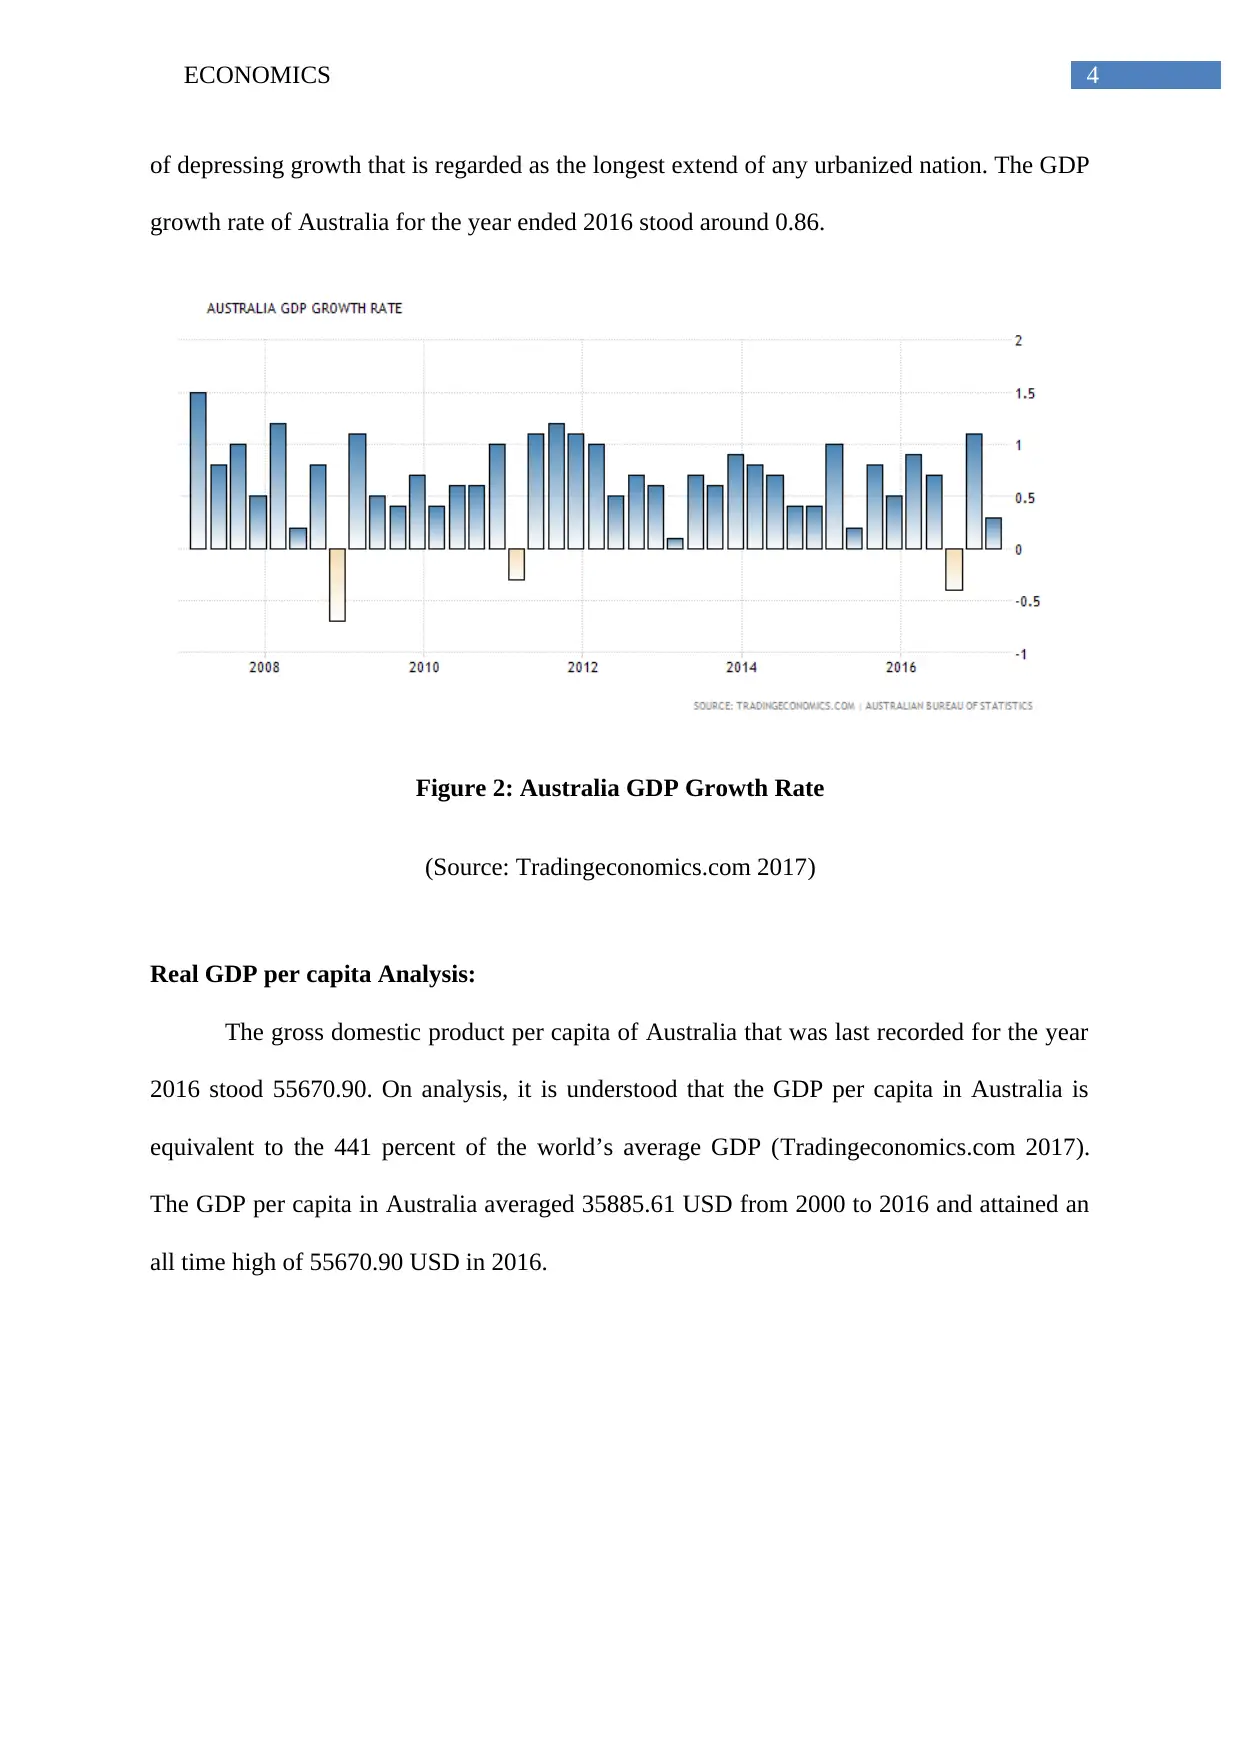
of depressing growth that is regarded as the longest extend of any urbanized nation. The GDP
growth rate of Australia for the year ended 2016 stood around 0.86.
Figure 2: Australia GDP Growth Rate
(Source: Tradingeconomics.com 2017)
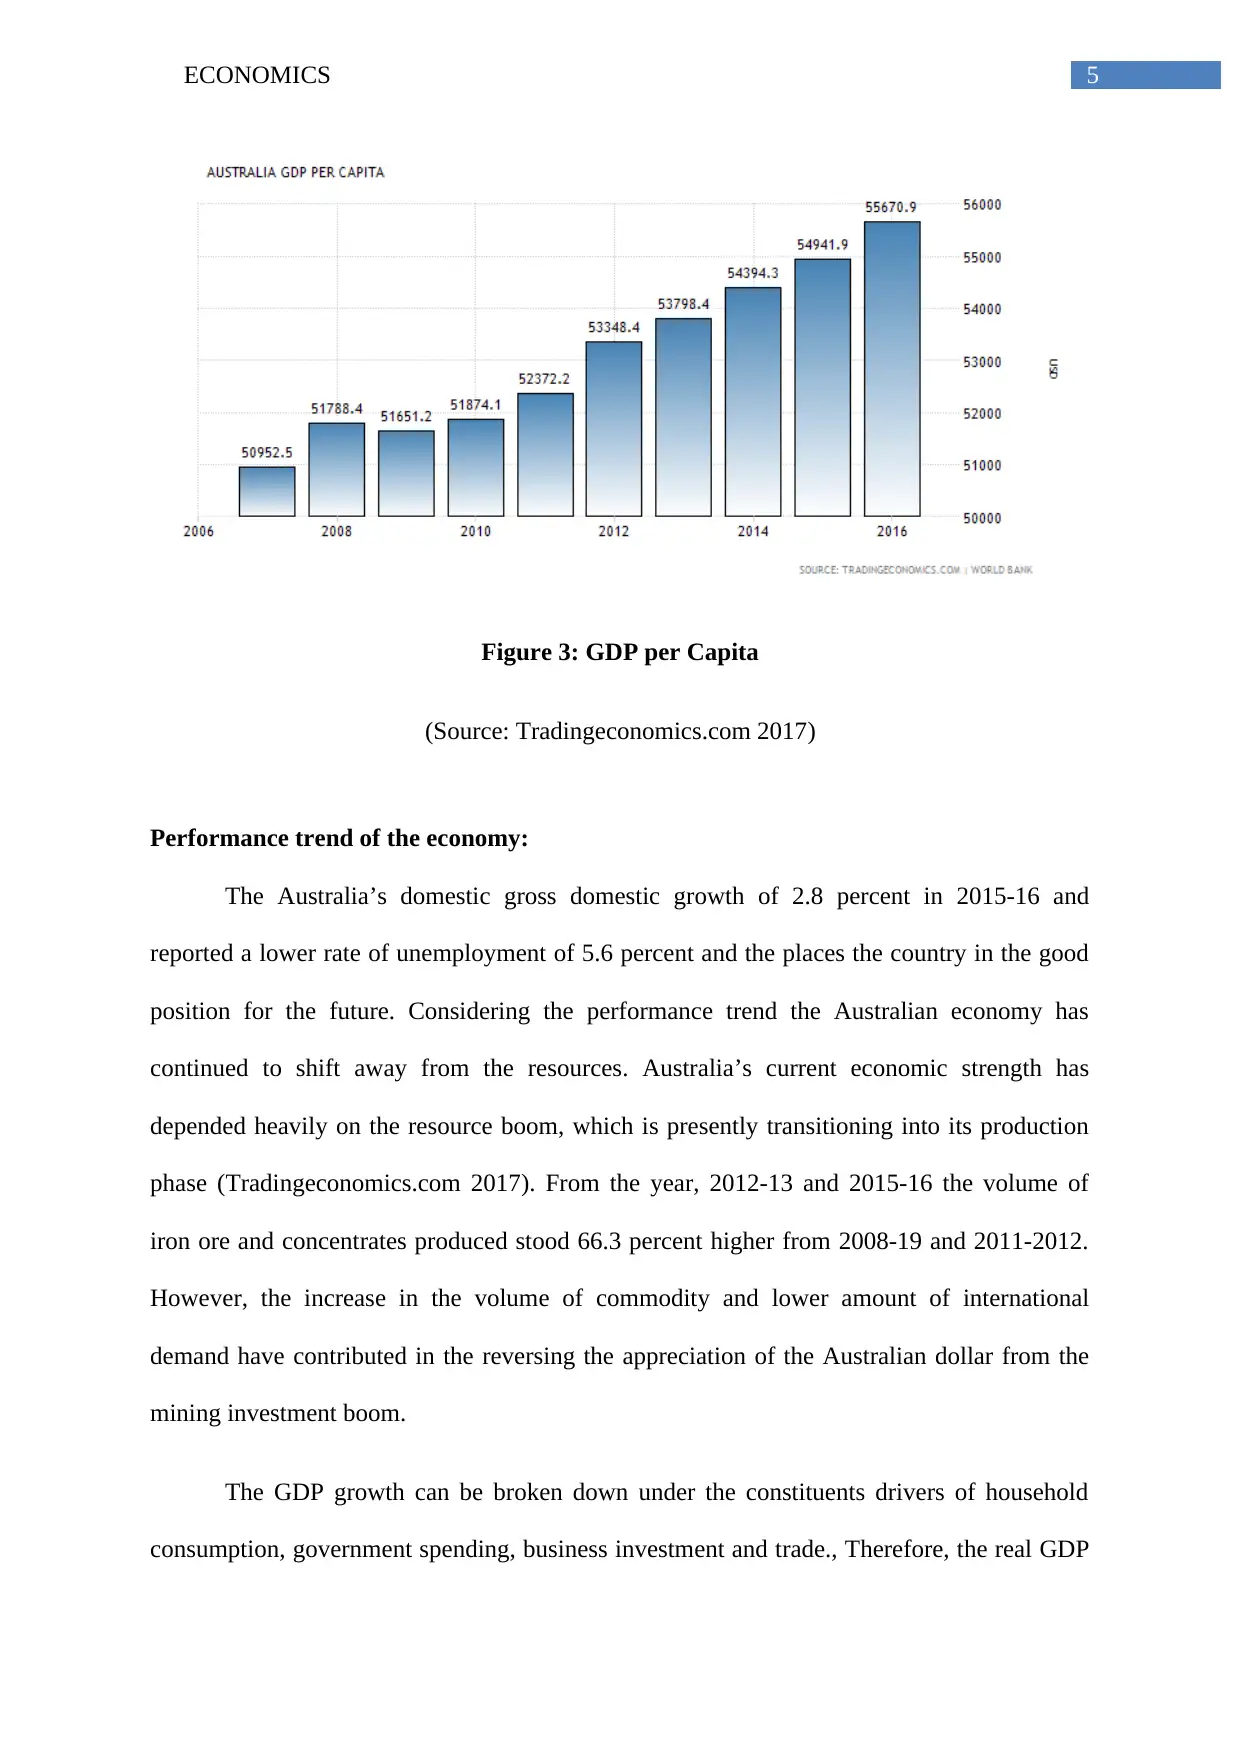
Real GDP per capita Analysis:
The gross domestic product per capita of Australia that was last recorded for the year
2016 stood 55670.90. On analysis, it is understood that the GDP per capita in Australia is
equivalent to the 441 percent of the world’s average GDP (Tradingeconomics.com 2017).
The GDP per capita in Australia averaged 35885.61 USD from 2000 to 2016 and attained an
all time high of 55670.90 USD in 2016.
of depressing growth that is regarded as the longest extend of any urbanized nation. The GDP
growth rate of Australia for the year ended 2016 stood around 0.86.
Figure 2: Australia GDP Growth Rate
(Source: Tradingeconomics.com 2017)
Real GDP per capita Analysis:
The gross domestic product per capita of Australia that was last recorded for the year
2016 stood 55670.90. On analysis, it is understood that the GDP per capita in Australia is
equivalent to the 441 percent of the world’s average GDP (Tradingeconomics.com 2017).
The GDP per capita in Australia averaged 35885.61 USD from 2000 to 2016 and attained an
all time high of 55670.90 USD in 2016.
5ECONOMICS
Figure 3: GDP per Capita
(Source: Tradingeconomics.com 2017)
Performance trend of the economy:
The Australia’s domestic gross domestic growth of 2.8 percent in 2015-16 and
reported a lower rate of unemployment of 5.6 percent and the places the country in the good
position for the future. Considering the performance trend the Australian economy has
continued to shift away from the resources. Australia’s current economic strength has
depended heavily on the resource boom, which is presently transitioning into its production
phase (Tradingeconomics.com 2017). From the year, 2012-13 and 2015-16 the volume of
iron ore and concentrates produced stood 66.3 percent higher from 2008-19 and 2011-2012.
However, the increase in the volume of commodity and lower amount of international
demand have contributed in the reversing the appreciation of the Australian dollar from the
mining investment boom.
The GDP growth can be broken down under the constituents drivers of household
consumption, government spending, business investment and trade., Therefore, the real GDP
⊘ This is a preview!⊘
Do you want full access?
Subscribe today to unlock all pages.
Trusted by 1+ million students worldwide
6ECONOMICS
of Australia rose to 2.8 percent in 2015-16 which was primarily driven by the household
consumption. In contrast to this, the business investment declined by 1.7 percent points from
GDP growth. This was primarily caused by the continuation declining business investment.
Government measures to achieve production output performance:
The Australian government has adopted investment in physical capital with the
objective of improving labour productivity since the capital productivity is relatively slow to
the change. This helps in providing direct link between the physical investment and
production output (Tradingeconomics.com 2017). The Australian government is also
embodied in the capital stock by undertaking initiatives to improve the technological aspects.
The government have adopted measures in the areas of research and development in which
the growth rate of technological progress largely dependent on the present level of
technology on the quantity of resources that is devoted to the generation of new ideas and
inventions. The government makes investment in human capital with the objective of raising
productivity with evident changes in the production process.
Labour Market Analysis:
Unemployment trend based on unemployment rates:
The seasonally adjusted rate of unemployment for Australia remained unaffected at
5.6 percent in June for the year 2016 from an upward modification of 5.6 percent in the
month of May and it is reliable with the marketplace evaluations. The unemployment rate of
Australia remained at the least possible level since the October 2016 as the Australian
economy added 14,000 jobs however the number of unemployed person increased by 13100
(Richardson, 2014). In the month of June, the rate of seasonally adjusted labour force
participation increased to a 17th month high of 65.0 percent from 64.9 percent in the earlier
Paraphrase This Document
Need a fresh take? Get an instant paraphrase of this document with our AI Paraphraser
7ECONOMICS
period that was beyond the market anticipations of 64.9 percent. Employment rose to
12,566,900, which was marginally lower than the market projections of 15,000 increases. The
full time employment increased by 62,000 to 8,356,000 whereas the part time employment
fell down by 48,000 to 3,810,800 (Tradingeconomics.com 2017). Unemployment increased
by 13,100 to 728,100. The total number of unemployed person searching for full time work
rose to 500,600 and the number of unemployed person looking for part time work augmented
to 227500.
Definition of unemployment and types of unemployment in an economy:
Unemployment can be defined as the scenario where number of people willing to
work or able to work is unable to discover work at the prevailing rate of wage.
Types of unemployment:
Cyclical unemployment: Cyclical unemployment occurs when an economy enters in the
phase of recession and with loss of large number of jobs.
Frictional unemployment: Frictional unemployment takes place due to the normal turnover
in the labour market and the time taken by the workers to discover new jobs.
Structural unemployment: Structural unemployment arises due to the absence of the
demand for a certain type of worker. This is particularly due to the mismatches of necessary
skills required by the employers and the skill possessed by the workers. Advancements made
in the technology majorly leads to unemployment.
Types of unemployment in Australia:
The main types of unemployment suffered by the Australian economy are the cyclical
and structural unemployment (Pigou, 2013). The cyclical unemployment in Australia is
8ECONOMICS
caused by the contraction of the economic activity of aggregate demand. With fall in
aggregate demand, the derived demand for labour also falls. These results in loss of jobs and
workers are laid off because of the falling demand of labour. In the year 2006, a shortage of
skill rose because of the mismatch between the required skills by the employers and the skill
offered by the employees. A majority of those rose due to the mining boom states of the
Western Australia and Queensland.
Government measures adopted to achieve full employment:
The Australian government adopted the policies of increasing workforce training and
educations under the Apprenticeships Centre to promote the skills creation of the employees.
The government also implemented the policies of school based apprenticeship systems in
order to develop the apprenticeship skills in school (Argy & Nevile, 2016). Funding related to
vocational and school educations comprised of National Education Framework for School to
increase literacy and the standards of numeracy with the Australian national training authority
to enhance the skill development of Australian workers. To address the long term
unemployment, the government has made several changes in the welfare and system of
taxation with the objective of strengthening the incentive and obligations of welfare
recipients to seek the payment of casual workers.
Price level analysis:
The consumer prices in Australia increased by 1.9 percent in the quarter of June 2017
from 2.1 percent in the first quarter and below the market consensus of 2.2 percent rise. The
rate of inflation edged lower from 2-1/2 high in the first quarter primarily because of the
slowdown in the cost of housing and transport. The annual cost increased at a slower rate for
housing and transport (Ormerod et al., 2013). Cost increased further in the food and non-
alcoholic beverages to 1.9 percent from 1.8 percent. Based on quarterly basis the consumer
⊘ This is a preview!⊘
Do you want full access?
Subscribe today to unlock all pages.
Trusted by 1+ million students worldwide
9ECONOMICS
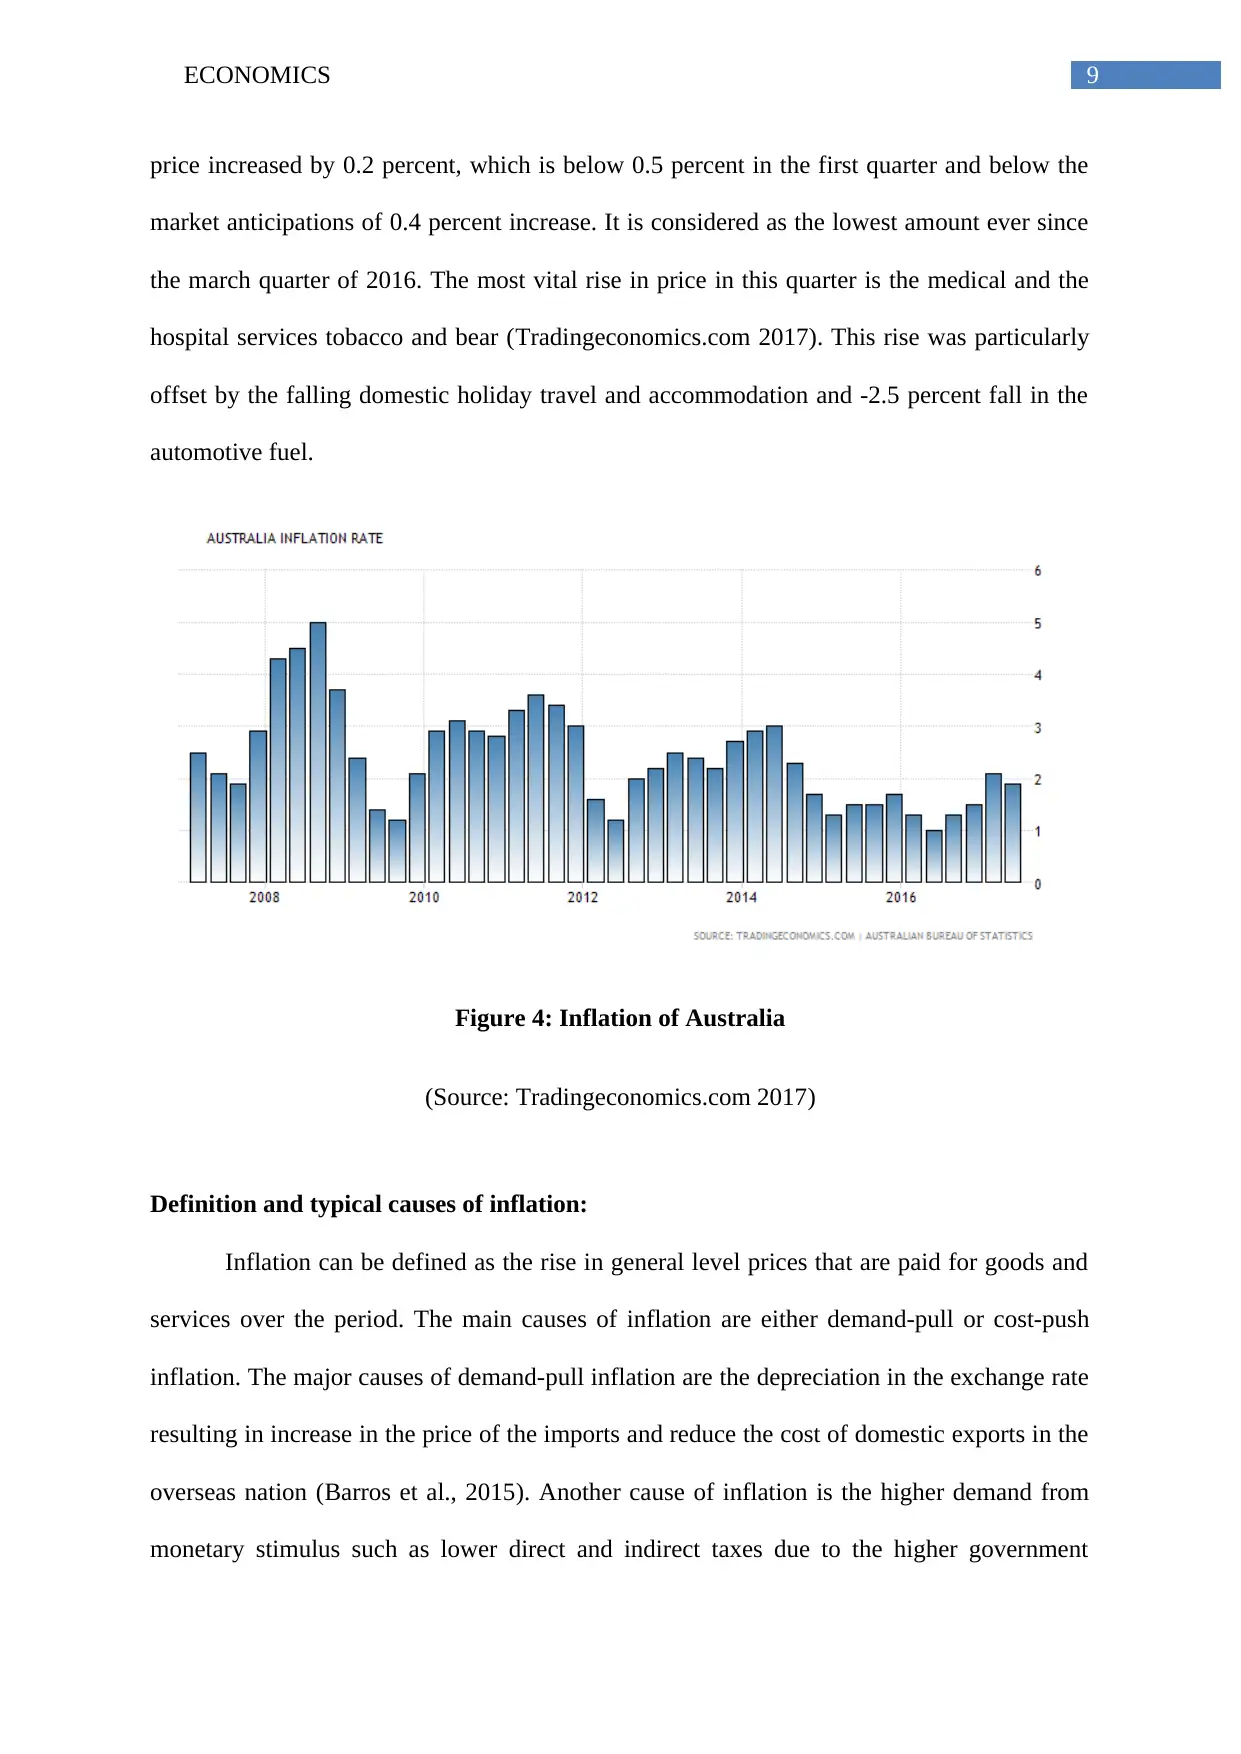
price increased by 0.2 percent, which is below 0.5 percent in the first quarter and below the
market anticipations of 0.4 percent increase. It is considered as the lowest amount ever since
the march quarter of 2016. The most vital rise in price in this quarter is the medical and the
hospital services tobacco and bear (Tradingeconomics.com 2017). This rise was particularly
offset by the falling domestic holiday travel and accommodation and -2.5 percent fall in the
automotive fuel.
Figure 4: Inflation of Australia
(Source: Tradingeconomics.com 2017)
Definition and typical causes of inflation:
Inflation can be defined as the rise in general level prices that are paid for goods and
services over the period. The main causes of inflation are either demand-pull or cost-push
inflation. The major causes of demand-pull inflation are the depreciation in the exchange rate
resulting in increase in the price of the imports and reduce the cost of domestic exports in the
overseas nation (Barros et al., 2015). Another cause of inflation is the higher demand from
monetary stimulus such as lower direct and indirect taxes due to the higher government
Paraphrase This Document
Need a fresh take? Get an instant paraphrase of this document with our AI Paraphraser
10ECONOMICS
spending. Cost-push inflation simultaneously arises due to the increase in the cost of raw
materials and other components. This may be due to the rise in the price of commodity such
as oil and agricultural products. Rising cost of labour is also one of the cause of inflation as
the cost of wages regularly increase when the unemployment is low since skilled workers
become more scarce and this drives higher level of pay.
Causes of inflation in Australia:
The demand side factors have influenced the degree of aggregate demand in the
Australian economy. With national spending running head of the production, wide amount of
shortage in goods and service appears unsold with firms cannot access the additional
resources so that it can lift the total output (Cumming & Johan, 2016). This results in demand
side inflation. The cost-push inflation in Australia has resulted in rise wages paid to the
workers. During the year, 2013 and 2014 under the new enterprise wage agreement has added
cost pressure and ultimately accelerating inflation.
Government measure to achieve stable price:
The Australian government has adopted the policy of contraction that involve higher
rate of taxes by changing the rate of interest as the method of creating an impact on the
degree of national spending or aggregate demand in the economy (Azad et al., 2014).
Furthermore, the Australian government has also adopted the budgetary policy involving
higher taxes and reducing the government outlays. This helps in reducing the spending by
raising income collected from the personal and company taxes.
Conclusion:
To conclude with from the analysis it is found that the Australian economy has
achieved growth at a rapid pace. In spite of the global financial crisis the economy of
11ECONOMICS
Australia has made significant impact with lower degree of recession. The GDP per capita
and GDP has been relatively high which represents that the economy has expanded at a faster
rate. The Australian economy is successfully moving the direction of achieving full
employment since the rate of unemployment has been relatively lower for the economy.
Being an open economy the government of Australia has also attracted foreign direct
investment to attain the economic expansion with successful government policies of reducing
aggregate demand.
⊘ This is a preview!⊘
Do you want full access?
Subscribe today to unlock all pages.
Trusted by 1+ million students worldwide
1 out of 15
Related Documents


Your All-in-One AI-Powered Toolkit for Academic Success.
+13062052269
info@desklib.com
Available 24*7 on WhatsApp / Email
![[object Object]](/_next/static/media/star-bottom.7253800d.svg)
Unlock your academic potential
Copyright © 2020–2026 A2Z Services. All Rights Reserved. Developed and managed by ZUCOL.