Comprehensive Report: State of Australian Economy 2016-2017
VerifiedAdded on 2020/04/07
|12
|2817
|36
Report
AI Summary
This report provides a comprehensive analysis of the Australian economy from August 2016 to September 2017. It examines key economic indicators, including Gross Domestic Product (GDP) growth, inflation rates, and unemployment figures, highlighting the impact of commodity price fluctuations and domestic demand. The report delves into the state of the Australian economy, covering GDP trends, inflation in tradeable and non-tradeable goods, and unemployment rates. Furthermore, it assesses the current account, exchange rates, and net foreign debt, as well as the terms of trade. Growth concerns, such as domestic consumption, international economic uncertainties (particularly those related to China), and labor productivity are also discussed. The report concludes with an outlook for 2018, predicting stronger growth and reduced unemployment, driven by factors like increased wages and favorable international trade conditions. The analysis draws on data from sources such as the Reserve Bank of Australia and the Australian Bureau of Statistics, providing a detailed and insightful overview of the Australian economic landscape during the specified period.
State of the Australian Economy
2016- 2017
2016- 2017
The Australian Economy witnessed a sort of comeback in the period
between August 2016 and September 2017 led by the resurgence of
commodity prices in the international market and strong domestic
demand. This strong growth is expected to continue in the next twelve
months with a few concerns but an overall positive outlook.
2016- 2017
2016- 2017
The Australian Economy witnessed a sort of comeback in the period
between August 2016 and September 2017 led by the resurgence of
commodity prices in the international market and strong domestic
demand. This strong growth is expected to continue in the next twelve
months with a few concerns but an overall positive outlook.
Paraphrase This Document
Need a fresh take? Get an instant paraphrase of this document with our AI Paraphraser
1. Introduction
August 2016 was a time when the Australian economy was witnessing a drag in the GDP growth due to a
slowdown in the global commodity market. This changed considerably during the period of August 2016
and September 2017 as the economy experienced a come back from the lows of the previous quarters
that were largely caused due to the end of a commodity super cycle. (Organization for Economic Co-
operation and Development, 2017) The economy of Australia has seen stability in the period since
August 2016, partly due to the end of the decline in commodity market and partly due to high domestic
consumption.
2. The Current State of Australian Economy
2.1 Gross Domestic Product
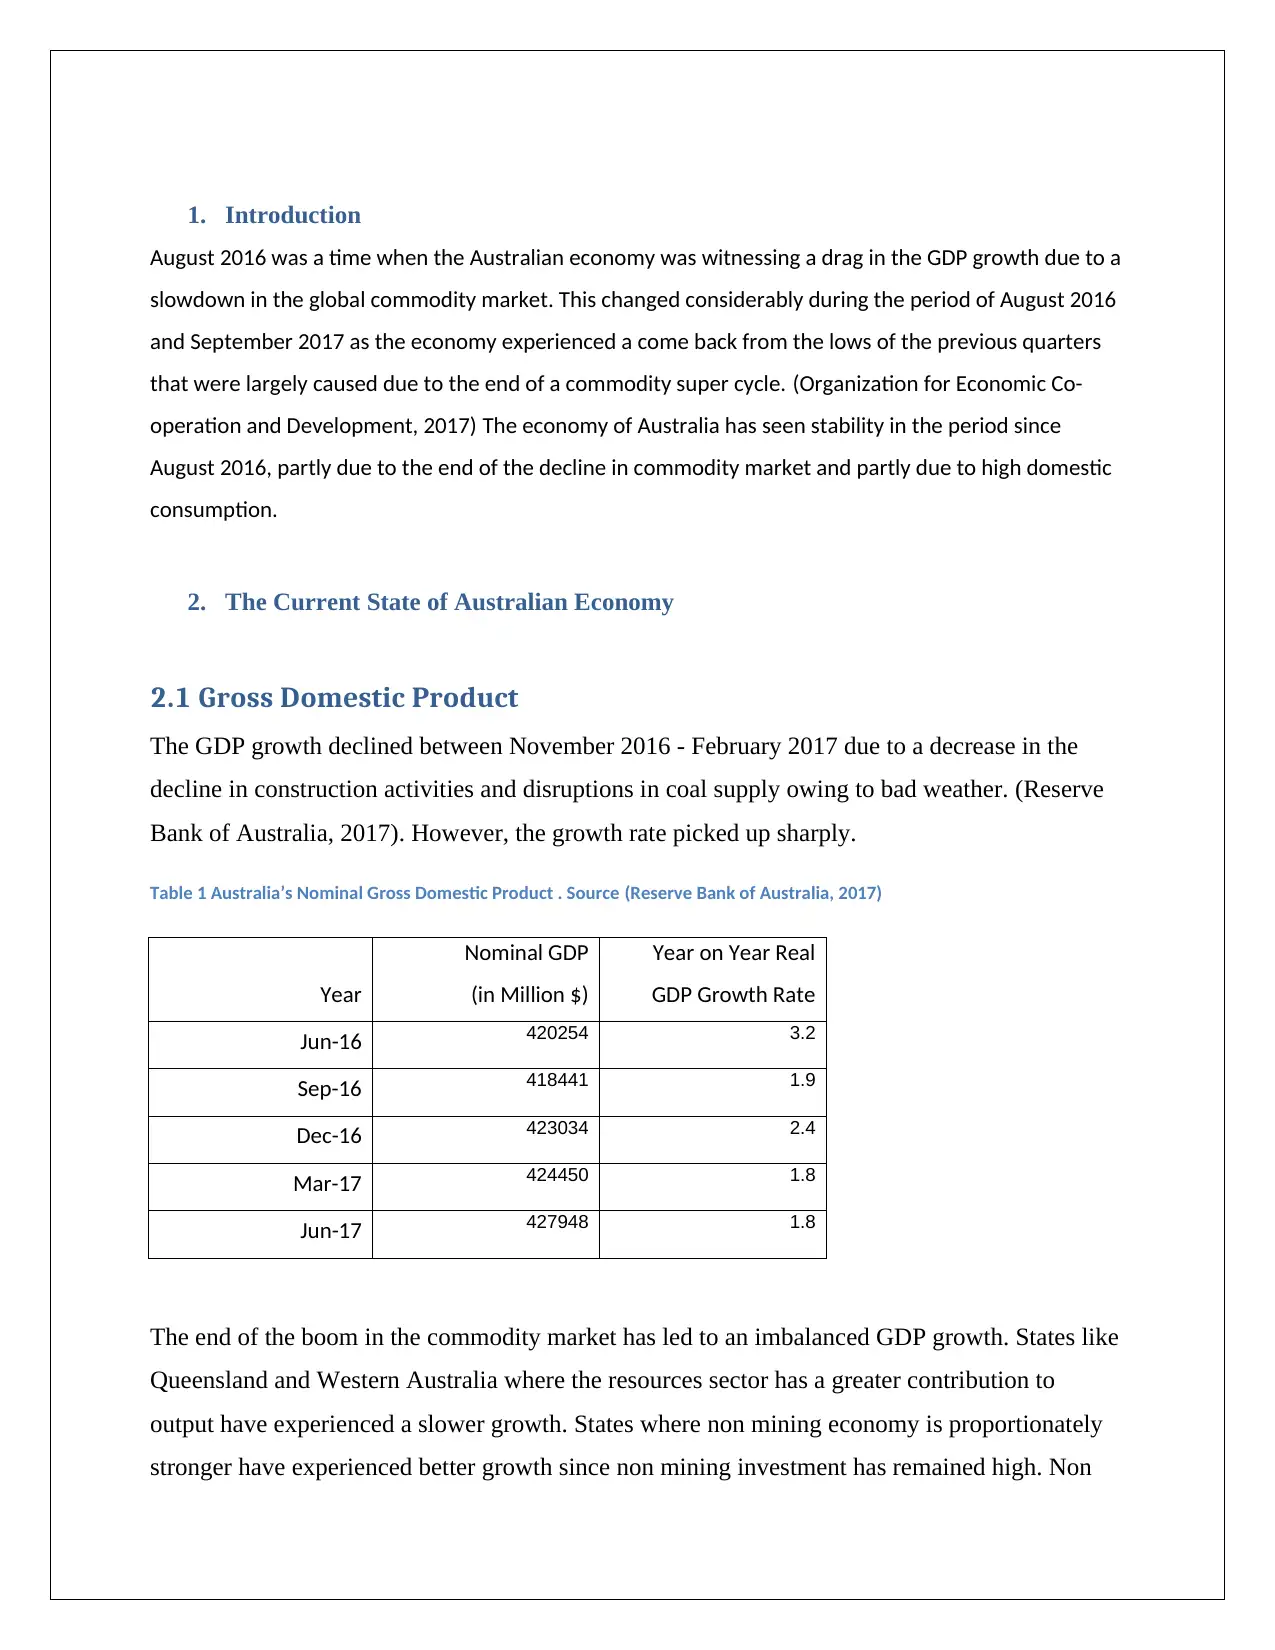
The GDP growth declined between November 2016 - February 2017 due to a decrease in the
decline in construction activities and disruptions in coal supply owing to bad weather. (Reserve
Bank of Australia, 2017). However, the growth rate picked up sharply.
Table 1 Australia’s Nominal Gross Domestic Product . Source (Reserve Bank of Australia, 2017)
Year
Nominal GDP
(in Million $)
Year on Year Real
GDP Growth Rate
Jun-16 420254 3.2
Sep-16 418441 1.9
Dec-16 423034 2.4
Mar-17 424450 1.8
Jun-17 427948 1.8
The end of the boom in the commodity market has led to an imbalanced GDP growth. States like
Queensland and Western Australia where the resources sector has a greater contribution to
output have experienced a slower growth. States where non mining economy is proportionately
stronger have experienced better growth since non mining investment has remained high. Non
August 2016 was a time when the Australian economy was witnessing a drag in the GDP growth due to a
slowdown in the global commodity market. This changed considerably during the period of August 2016
and September 2017 as the economy experienced a come back from the lows of the previous quarters
that were largely caused due to the end of a commodity super cycle. (Organization for Economic Co-
operation and Development, 2017) The economy of Australia has seen stability in the period since
August 2016, partly due to the end of the decline in commodity market and partly due to high domestic
consumption.
2. The Current State of Australian Economy
2.1 Gross Domestic Product
The GDP growth declined between November 2016 - February 2017 due to a decrease in the
decline in construction activities and disruptions in coal supply owing to bad weather. (Reserve
Bank of Australia, 2017). However, the growth rate picked up sharply.
Table 1 Australia’s Nominal Gross Domestic Product . Source (Reserve Bank of Australia, 2017)
Year
Nominal GDP
(in Million $)
Year on Year Real
GDP Growth Rate
Jun-16 420254 3.2
Sep-16 418441 1.9
Dec-16 423034 2.4
Mar-17 424450 1.8
Jun-17 427948 1.8
The end of the boom in the commodity market has led to an imbalanced GDP growth. States like
Queensland and Western Australia where the resources sector has a greater contribution to
output have experienced a slower growth. States where non mining economy is proportionately
stronger have experienced better growth since non mining investment has remained high. Non
mining investment remained high in the states of Victoria and New South Wales. (Australian
Bureau of Statistics, 2017) (Reserve Bank of Australia, 2017)
However, in spite of the decline in mining investment the GDP growth has not slowed down and
a reason for this could be domestic consumption. The low rates of interest, and household
perceptions of their finances helped the sales in the retail sector to remain high. (Reserve Bank of
Australia, 2017) (Organization for Economic Co-operation and Development, 2017)
Table 2: Australia GDP Growth and GDP Growth Forecasts . Source Reserve Bank of Australia (2016)
Year-ended
Dec 2016 Jun 2017 Dec 2017 Jun 2018 Dec 2018
GDP growth 2½–3½ 2½–3½ 2½–3½ 2½–3½ 3–4
CPI inflation 1½ 1½–2½ 1½–2½ 1½–2½ 1½–2½
Underlying inflation 1½ 1½–2½ 1½–2½ 1½–2½ 1½–2½
2016 2016/17 2017 2017/18 2018
GDP growth 2½–3½ 2½–3½ 2½–3½ 2½–3½ 2½–3½
2.2 Inflation
The Reserve Bank of Australia sets an inflation target between 2-3 % (Reserve Bank of
Australia, 2017) and the inflation remained within target throughout the year.
⊘ This is a preview!⊘
Do you want full access?
Subscribe today to unlock all pages.
Trusted by 1+ million students worldwide
Jun-16
Jul-16
Aug-16
Sep-16
Oct-16
Nov-16
Dec-16
Jan-17
Feb-17
Mar-17
Apr-17
May-17
Jun-17
0
0.5
1
1.5
2
2.5
Chart Title
Year Ended Inflation
Change
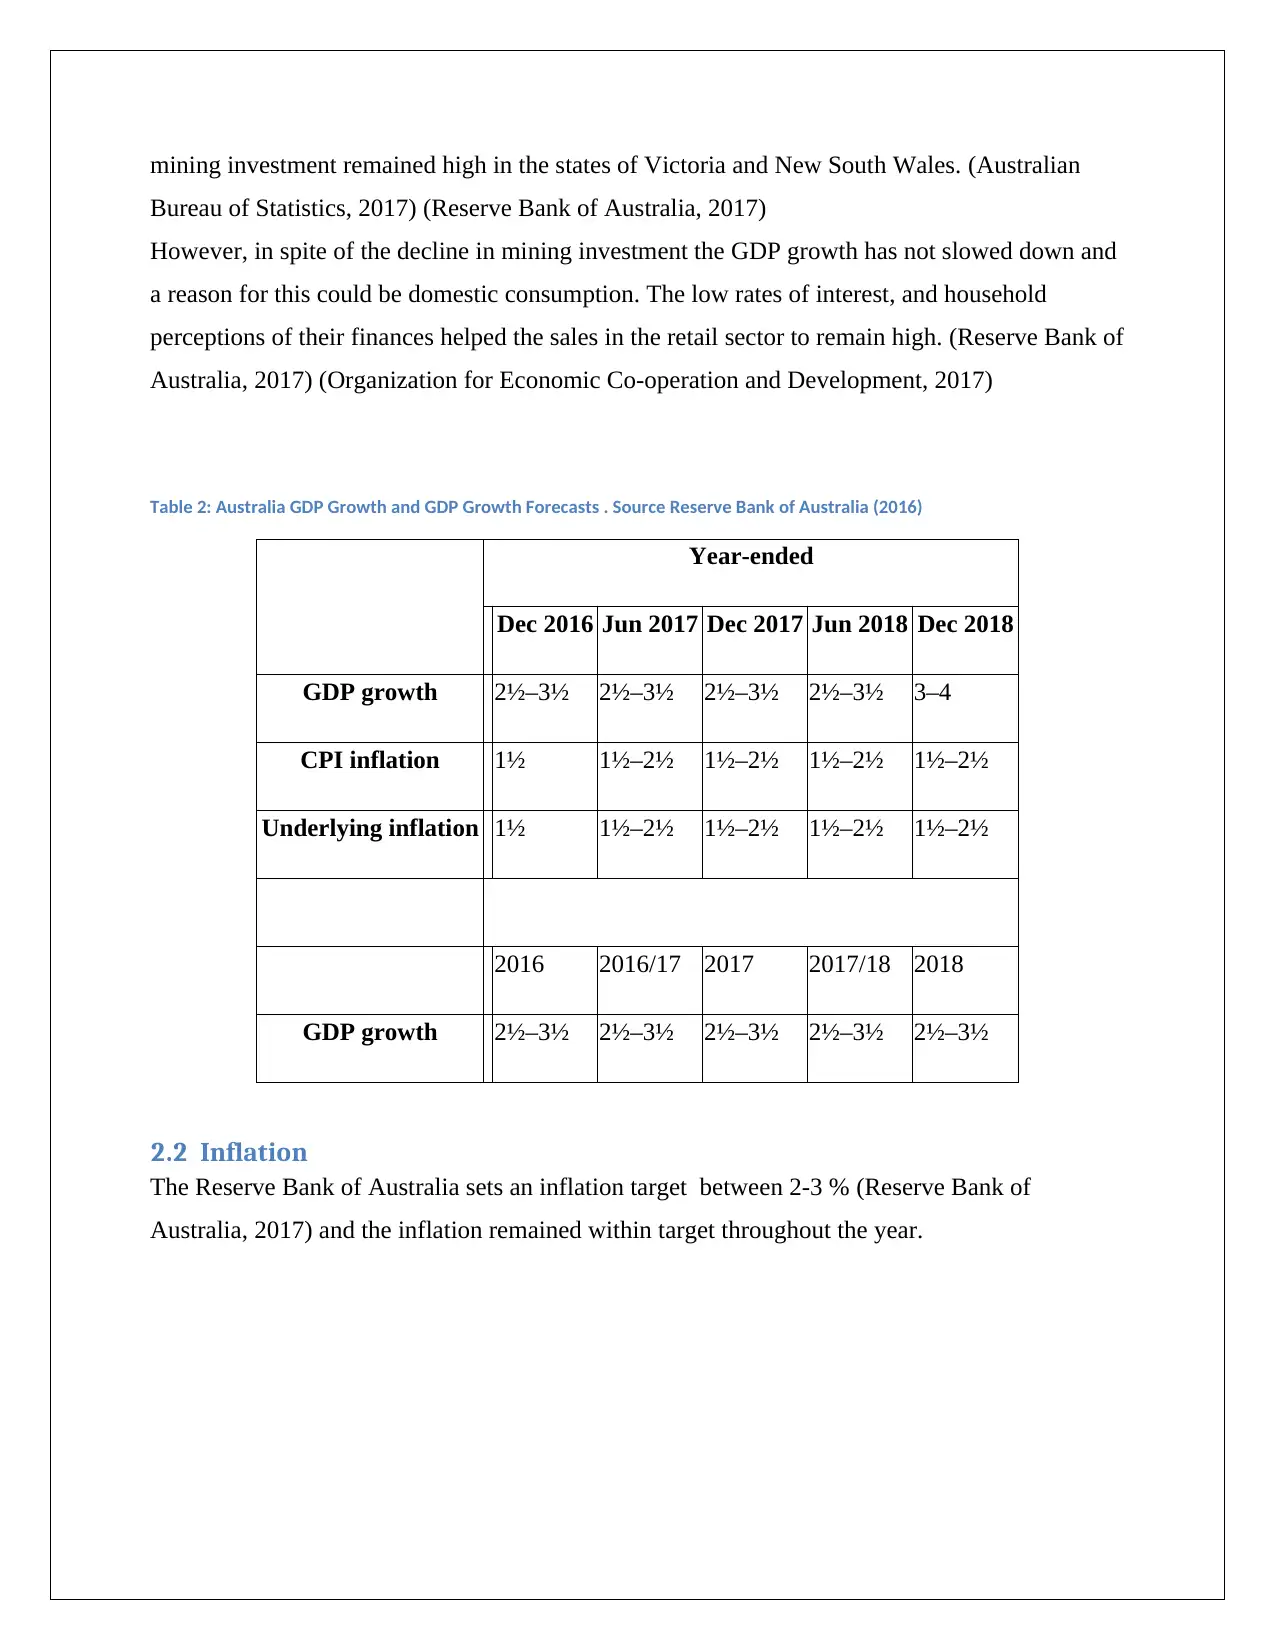
Graph 1 The Change in Inflation (CPI) Rate of Australia (Year-on -Year) (Reserve Bank of Australia, 2017)
A common trend throughout the year has been the increase of inflation in non tradeable goods
and a deflation of prices in tradeable goods. An increase in non-tradeable items implies greater
domestic demand or a higher consumer spending. The non-tradeable inflation represents
consumption of services such as hospital services, alcohol, tobacco etc.
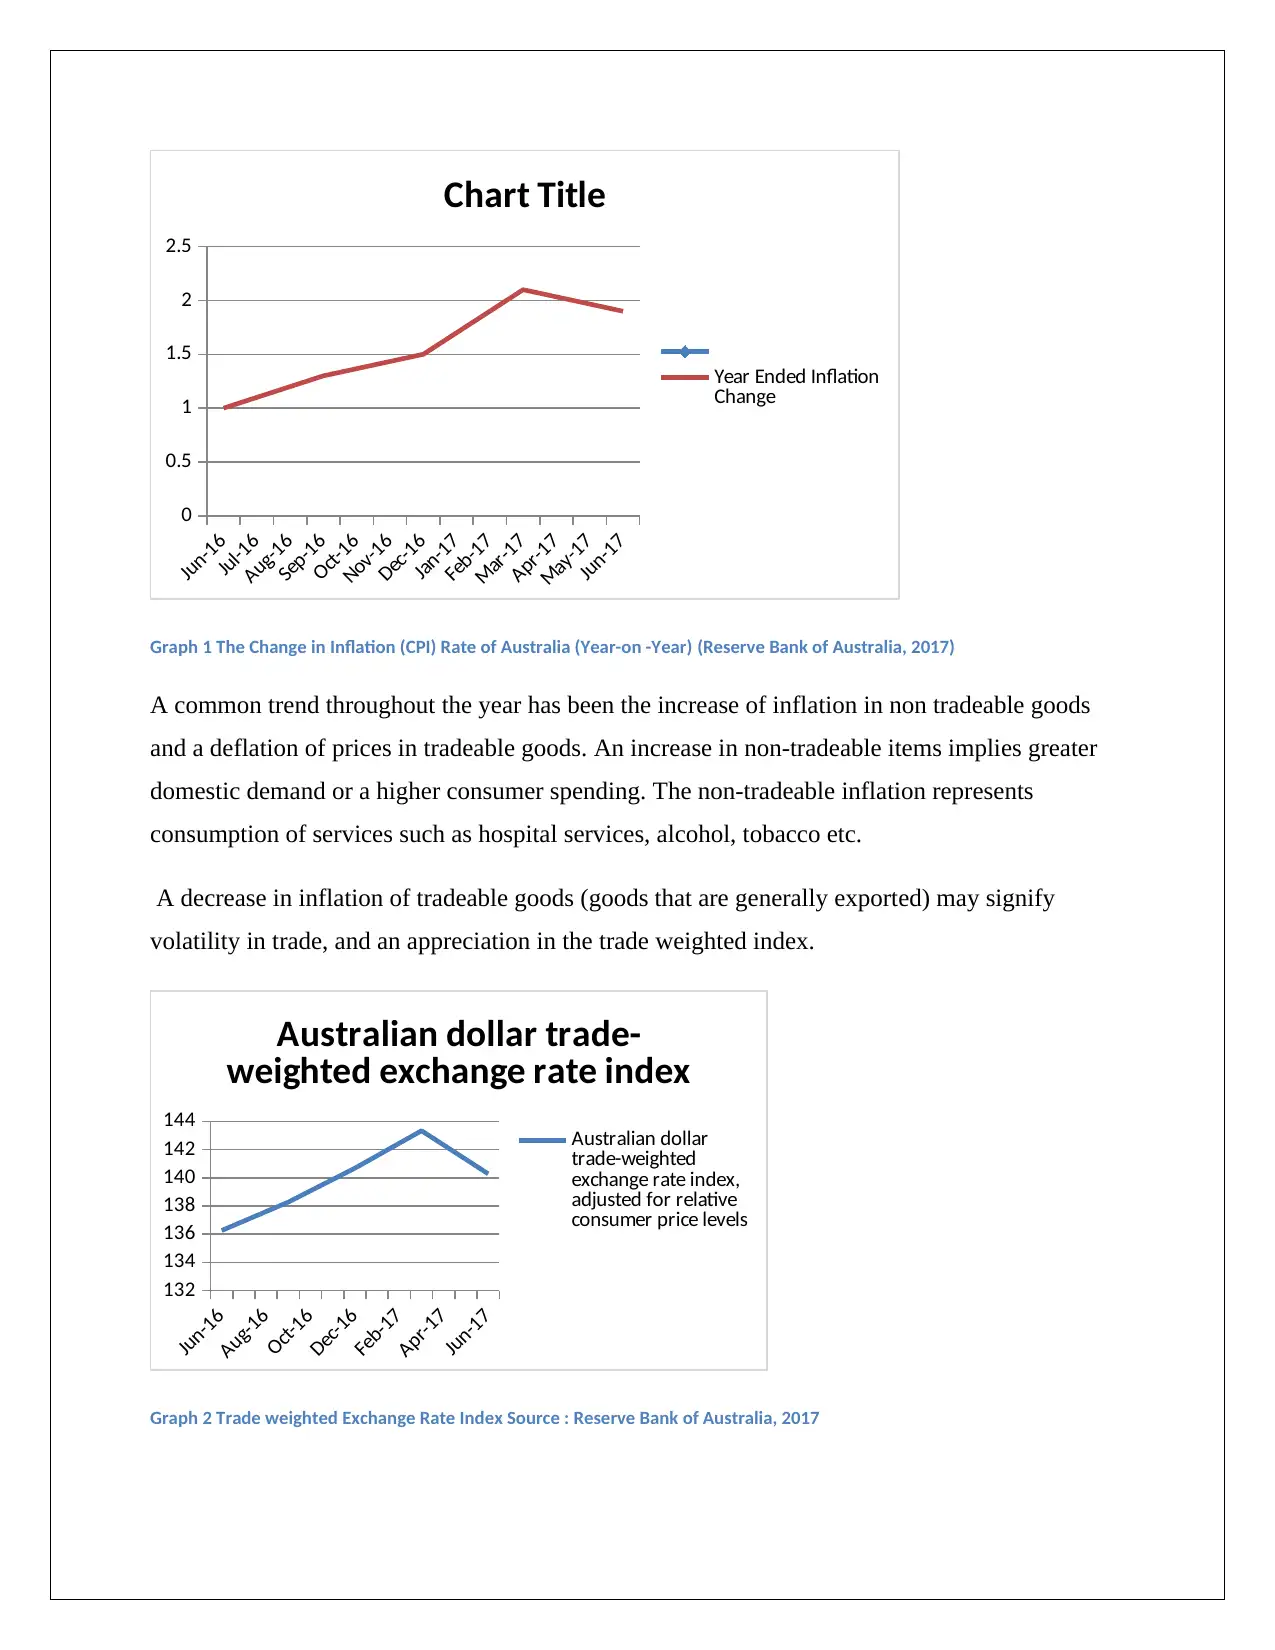
A decrease in inflation of tradeable goods (goods that are generally exported) may signify
volatility in trade, and an appreciation in the trade weighted index.
Jun-16
Aug-16
Oct-16
Dec-16
Feb-17
Apr-17
Jun-17
132
134
136
138
140
142
144
Australian dollar trade-
weighted exchange rate index
Australian dollar
trade-weighted
exchange rate index,
adjusted for relative
consumer price levels
Graph 2 Trade weighted Exchange Rate Index Source : Reserve Bank of Australia, 2017
Jul-16
Aug-16
Sep-16
Oct-16
Nov-16
Dec-16
Jan-17
Feb-17
Mar-17
Apr-17
May-17
Jun-17
0
0.5
1
1.5
2
2.5
Chart Title
Year Ended Inflation
Change
Graph 1 The Change in Inflation (CPI) Rate of Australia (Year-on -Year) (Reserve Bank of Australia, 2017)
A common trend throughout the year has been the increase of inflation in non tradeable goods
and a deflation of prices in tradeable goods. An increase in non-tradeable items implies greater
domestic demand or a higher consumer spending. The non-tradeable inflation represents
consumption of services such as hospital services, alcohol, tobacco etc.
A decrease in inflation of tradeable goods (goods that are generally exported) may signify
volatility in trade, and an appreciation in the trade weighted index.
Jun-16
Aug-16
Oct-16
Dec-16
Feb-17
Apr-17
Jun-17
132
134
136
138
140
142
144
Australian dollar trade-
weighted exchange rate index
Australian dollar
trade-weighted
exchange rate index,
adjusted for relative
consumer price levels
Graph 2 Trade weighted Exchange Rate Index Source : Reserve Bank of Australia, 2017
Paraphrase This Document
Need a fresh take? Get an instant paraphrase of this document with our AI Paraphraser
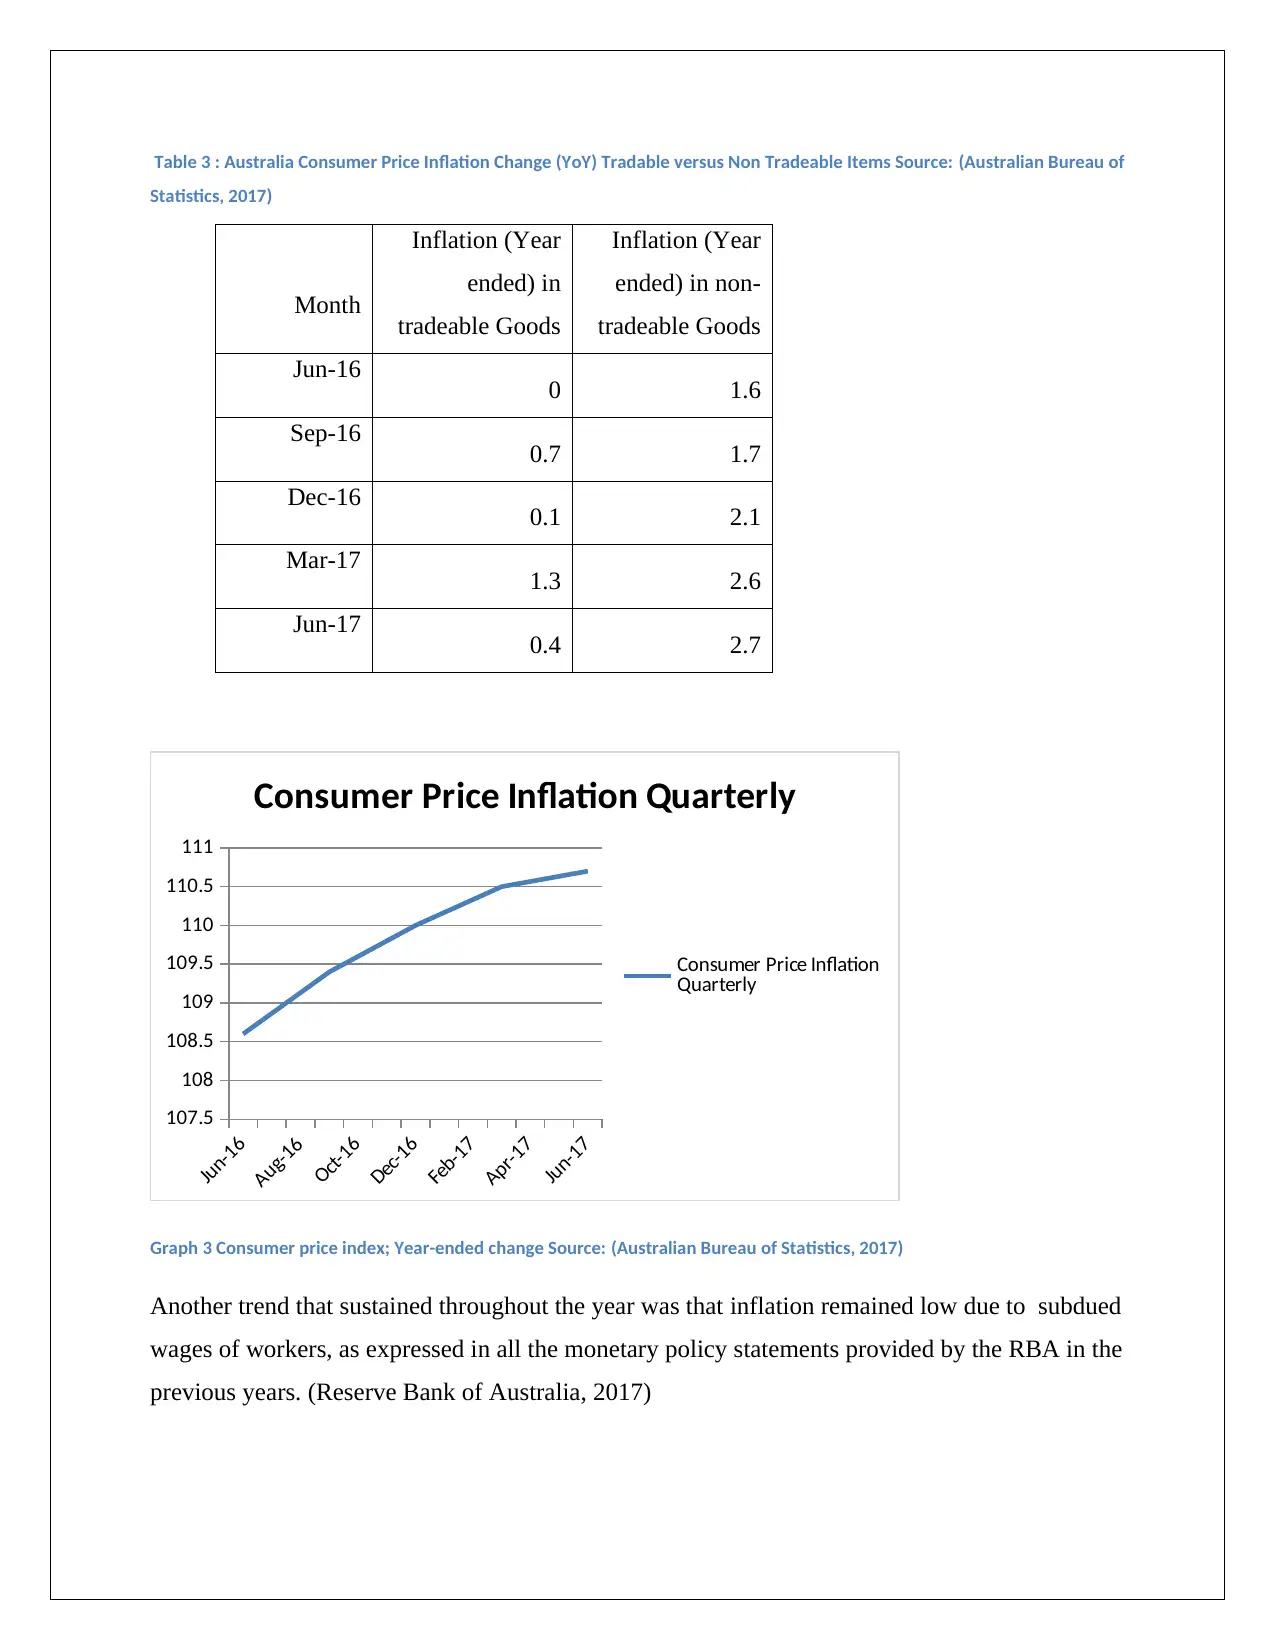
Table 3 : Australia Consumer Price Inflation Change (YoY) Tradable versus Non Tradeable Items Source: (Australian Bureau of
Statistics, 2017)
Jun-16
Aug-16
Oct-16
Dec-16
Feb-17
Apr-17
Jun-17
107.5
108
108.5
109
109.5
110
110.5
111
Consumer Price Inflation Quarterly
Consumer Price Inflation
Quarterly
Graph 3 Consumer price index; Year-ended change Source: (Australian Bureau of Statistics, 2017)
Another trend that sustained throughout the year was that inflation remained low due to subdued
wages of workers, as expressed in all the monetary policy statements provided by the RBA in the
previous years. (Reserve Bank of Australia, 2017)
Month
Inflation (Year
ended) in
tradeable Goods
Inflation (Year
ended) in non-
tradeable Goods
Jun-16 0 1.6
Sep-16 0.7 1.7
Dec-16 0.1 2.1
Mar-17 1.3 2.6
Jun-17 0.4 2.7
A major cause of inflation in the country, a trend that remained prevalent throughout the country,
was the increase in Dwelling Ownership which led to an increase in CPI. This trend was
particularly stronger in the states of New South Wales and Victoria, where non mining sector
was prevalent. (Australian Bureau of Statistics, 2017)
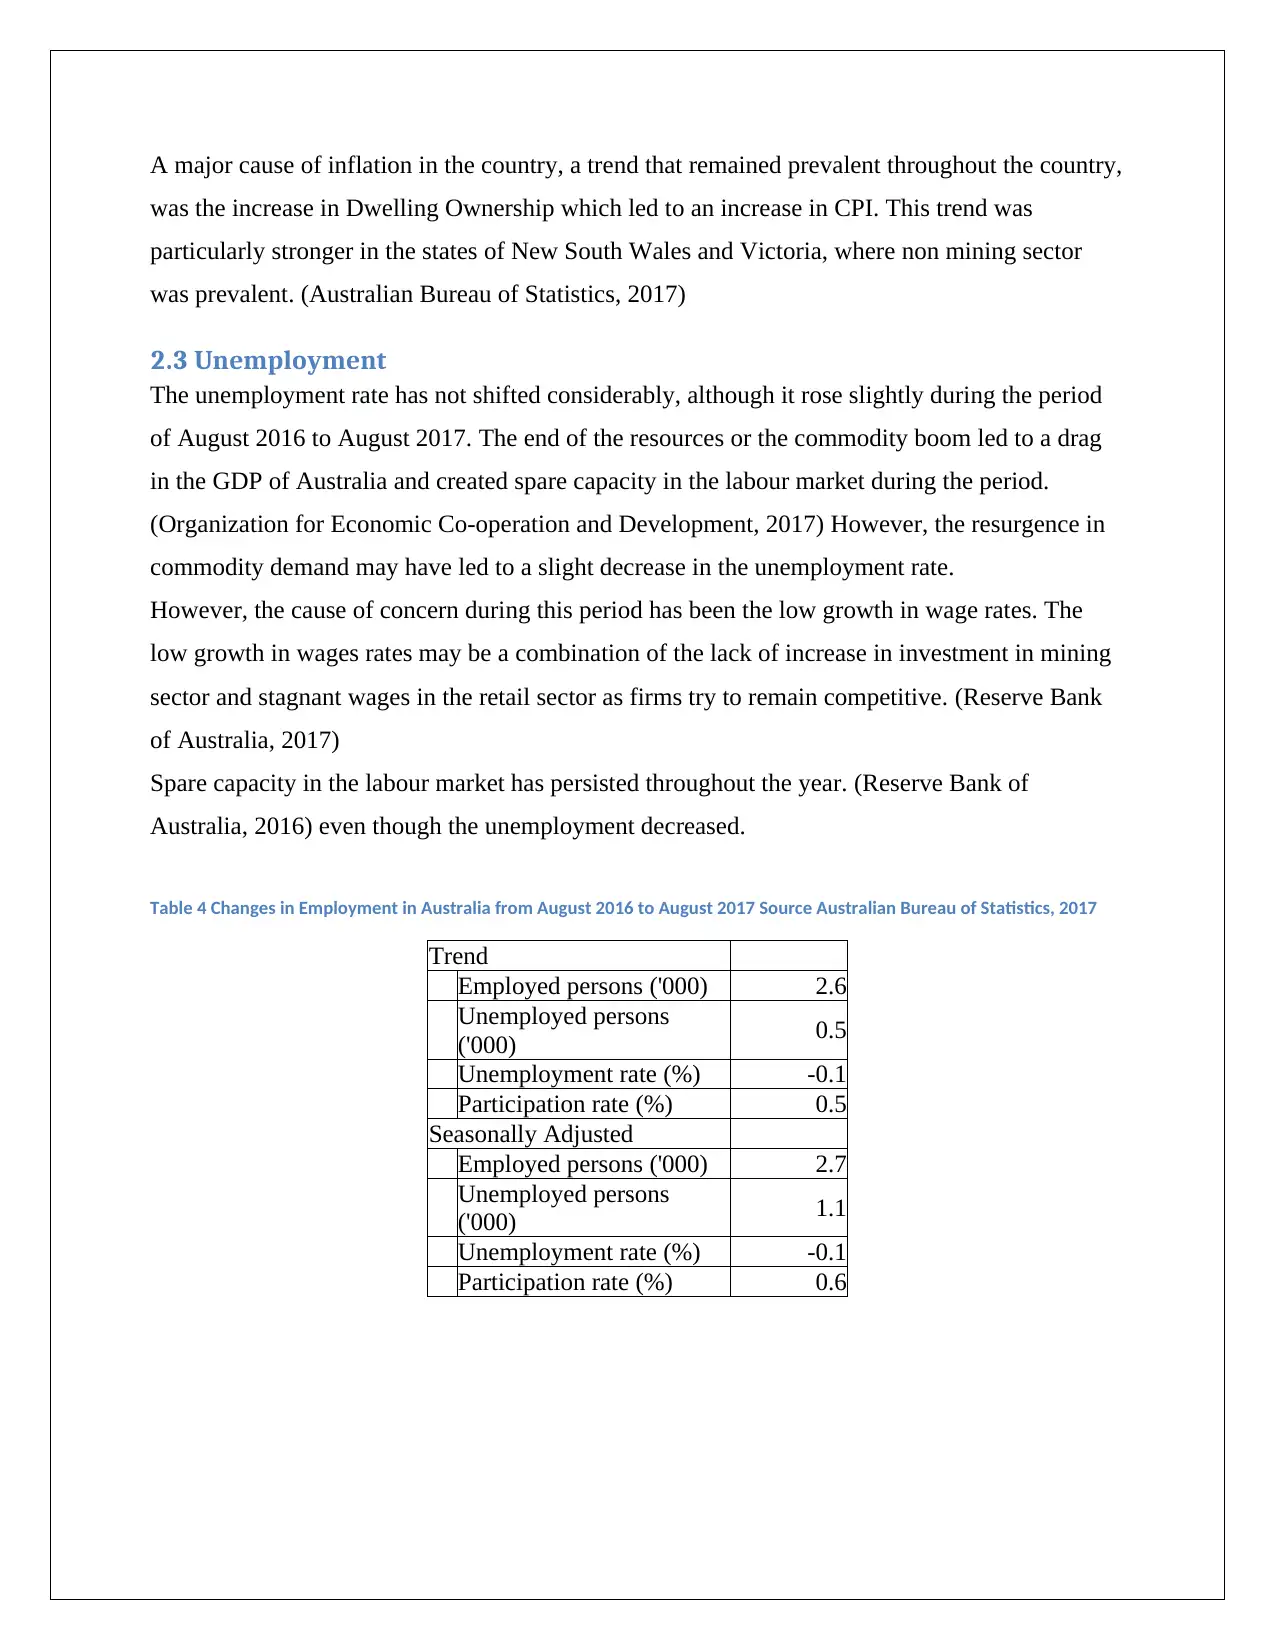
2.3 Unemployment
The unemployment rate has not shifted considerably, although it rose slightly during the period
of August 2016 to August 2017. The end of the resources or the commodity boom led to a drag
in the GDP of Australia and created spare capacity in the labour market during the period.
(Organization for Economic Co-operation and Development, 2017) However, the resurgence in
commodity demand may have led to a slight decrease in the unemployment rate.
However, the cause of concern during this period has been the low growth in wage rates. The
low growth in wages rates may be a combination of the lack of increase in investment in mining
sector and stagnant wages in the retail sector as firms try to remain competitive. (Reserve Bank
of Australia, 2017)
Spare capacity in the labour market has persisted throughout the year. (Reserve Bank of
Australia, 2016) even though the unemployment decreased.
Table 4 Changes in Employment in Australia from August 2016 to August 2017 Source Australian Bureau of Statistics, 2017
Trend
Employed persons ('000) 2.6
Unemployed persons
('000) 0.5
Unemployment rate (%) -0.1
Participation rate (%) 0.5
Seasonally Adjusted
Employed persons ('000) 2.7
Unemployed persons
('000) 1.1
Unemployment rate (%) -0.1
Participation rate (%) 0.6
was the increase in Dwelling Ownership which led to an increase in CPI. This trend was
particularly stronger in the states of New South Wales and Victoria, where non mining sector
was prevalent. (Australian Bureau of Statistics, 2017)
2.3 Unemployment
The unemployment rate has not shifted considerably, although it rose slightly during the period
of August 2016 to August 2017. The end of the resources or the commodity boom led to a drag
in the GDP of Australia and created spare capacity in the labour market during the period.
(Organization for Economic Co-operation and Development, 2017) However, the resurgence in
commodity demand may have led to a slight decrease in the unemployment rate.
However, the cause of concern during this period has been the low growth in wage rates. The
low growth in wages rates may be a combination of the lack of increase in investment in mining
sector and stagnant wages in the retail sector as firms try to remain competitive. (Reserve Bank
of Australia, 2017)
Spare capacity in the labour market has persisted throughout the year. (Reserve Bank of
Australia, 2016) even though the unemployment decreased.
Table 4 Changes in Employment in Australia from August 2016 to August 2017 Source Australian Bureau of Statistics, 2017
Trend
Employed persons ('000) 2.6
Unemployed persons
('000) 0.5
Unemployment rate (%) -0.1
Participation rate (%) 0.5
Seasonally Adjusted
Employed persons ('000) 2.7
Unemployed persons
('000) 1.1
Unemployment rate (%) -0.1
Participation rate (%) 0.6
⊘ This is a preview!⊘
Do you want full access?
Subscribe today to unlock all pages.
Trusted by 1+ million students worldwide
2.4 Trade
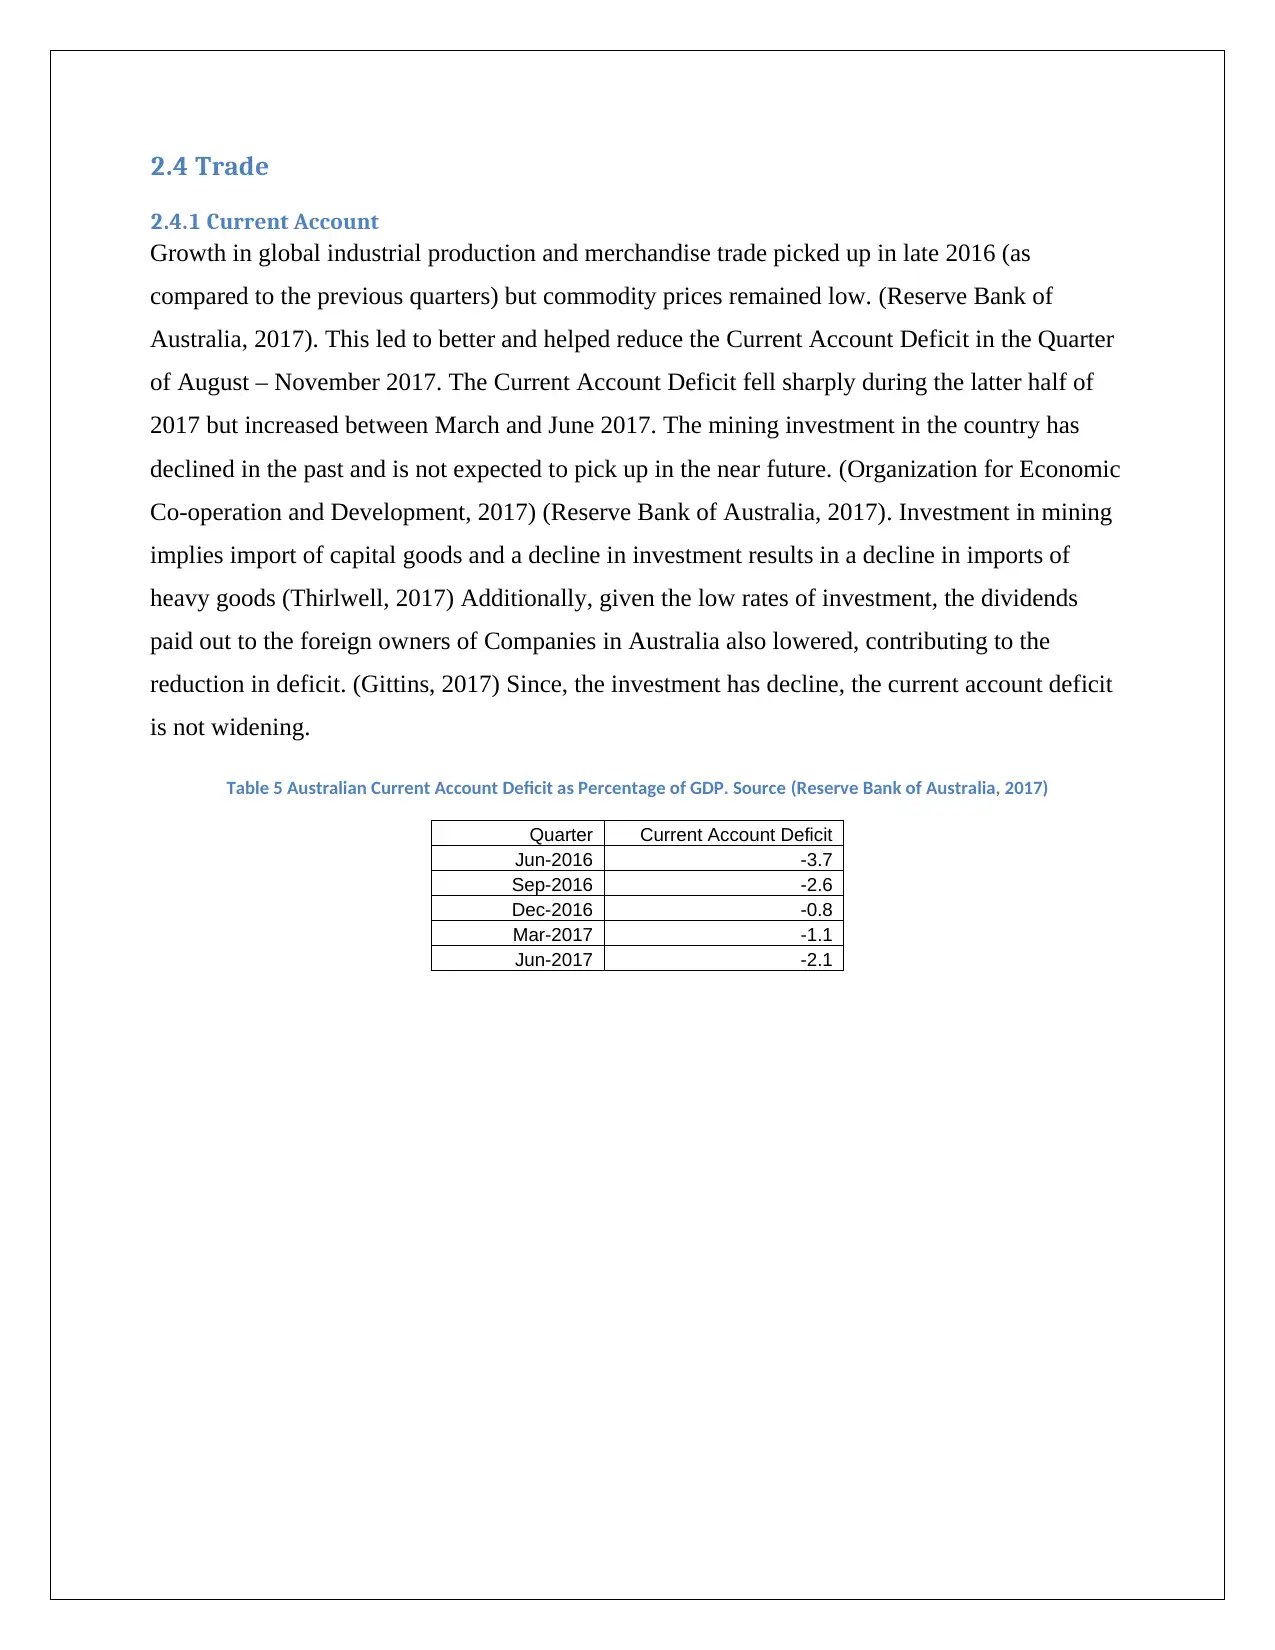
2.4.1 Current Account
Growth in global industrial production and merchandise trade picked up in late 2016 (as
compared to the previous quarters) but commodity prices remained low. (Reserve Bank of
Australia, 2017). This led to better and helped reduce the Current Account Deficit in the Quarter
of August – November 2017. The Current Account Deficit fell sharply during the latter half of
2017 but increased between March and June 2017. The mining investment in the country has
declined in the past and is not expected to pick up in the near future. (Organization for Economic
Co-operation and Development, 2017) (Reserve Bank of Australia, 2017). Investment in mining
implies import of capital goods and a decline in investment results in a decline in imports of
heavy goods (Thirlwell, 2017) Additionally, given the low rates of investment, the dividends
paid out to the foreign owners of Companies in Australia also lowered, contributing to the
reduction in deficit. (Gittins, 2017) Since, the investment has decline, the current account deficit
is not widening.
Table 5 Australian Current Account Deficit as Percentage of GDP. Source (Reserve Bank of Australia, 2017)
Quarter Current Account Deficit
Jun-2016 -3.7
Sep-2016 -2.6
Dec-2016 -0.8
Mar-2017 -1.1
Jun-2017 -2.1
Paraphrase This Document
Need a fresh take? Get an instant paraphrase of this document with our AI Paraphraser
2.4.2 Exchange Rate
18-Aug-16
20-Sep-16
23-Oct-16
25-Nov-16
28-Dec-16
30-Jan-17
4-Mar-17
6-Apr-17
9-May-17
11-Jun-17
14-Jul-17
16-Aug-17
18-Sep-17
0.66
0.68
0.7
0.72
0.74
0.76
0.78
0.8
0.82
Rate of Exchange (AUD/USD)
Rate of Exchange
(AUD/USD)
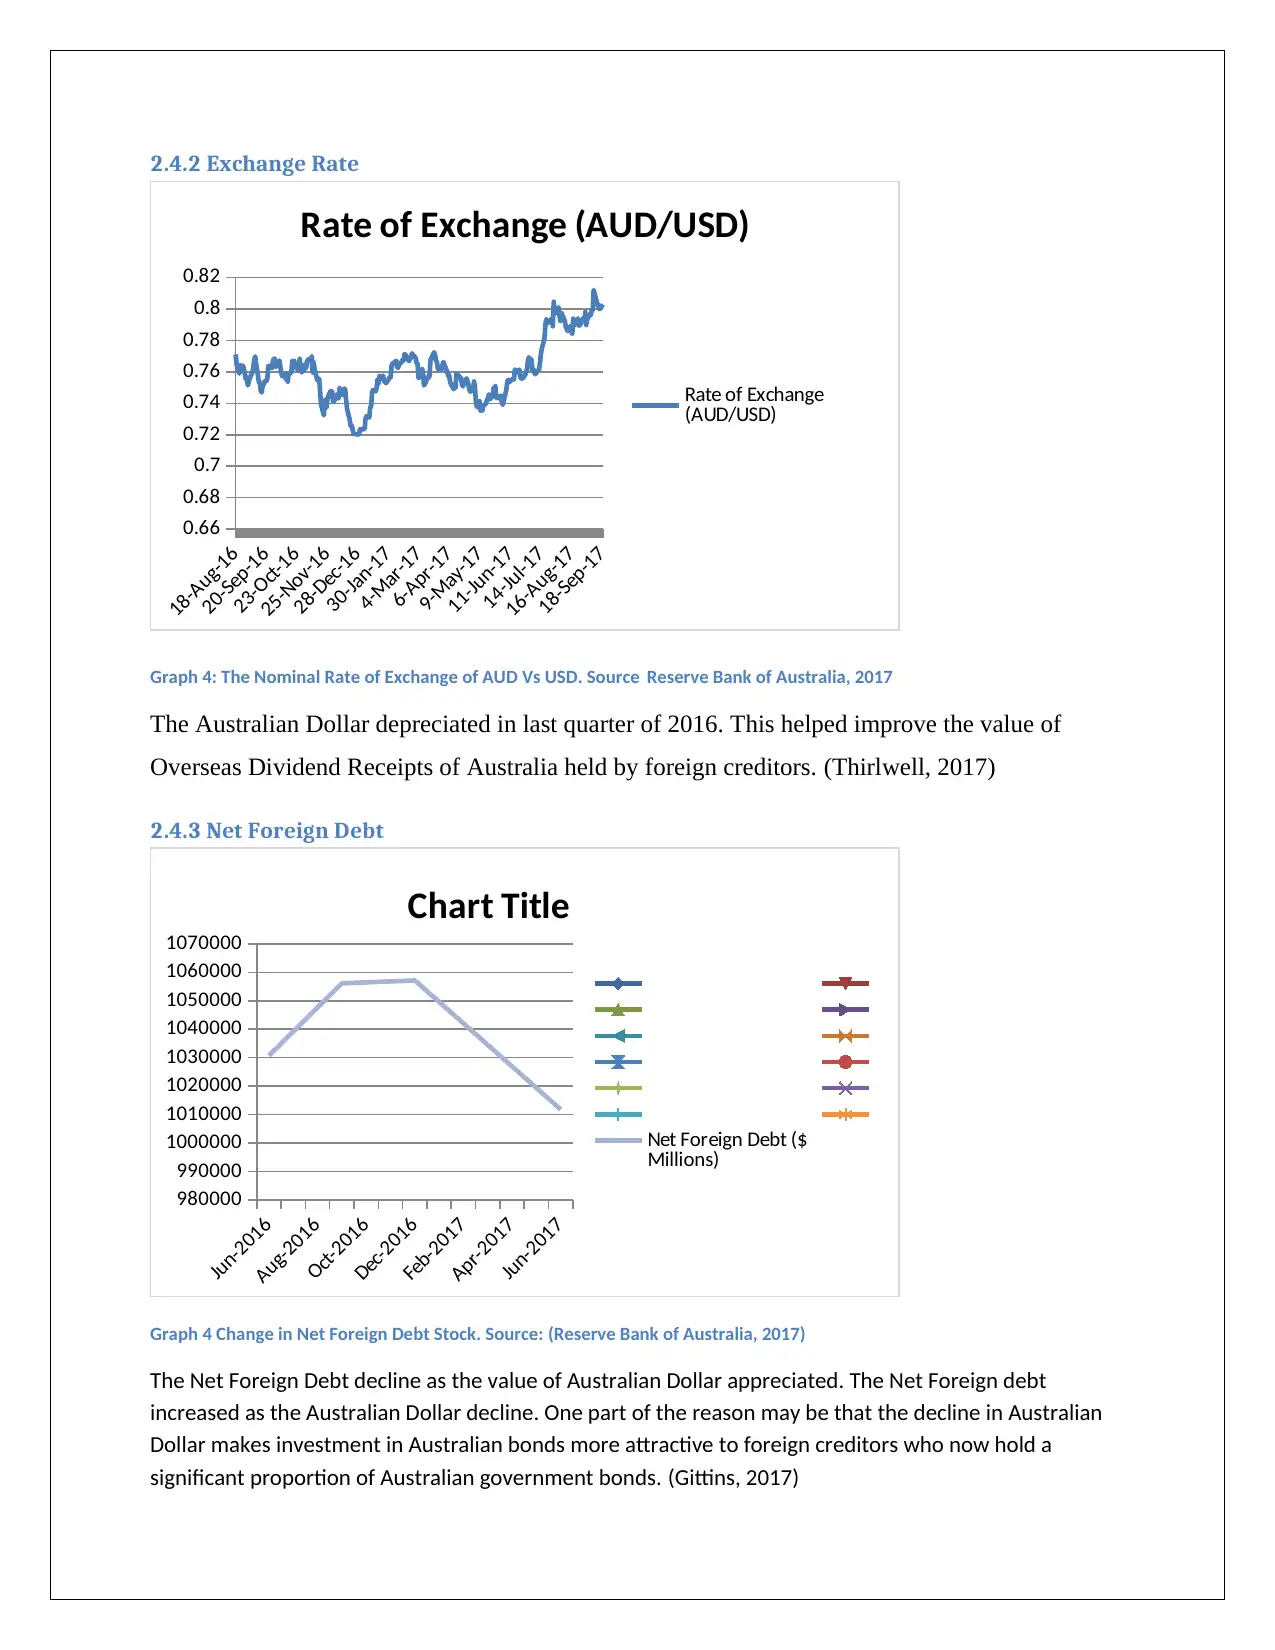
Graph 4: The Nominal Rate of Exchange of AUD Vs USD. Source Reserve Bank of Australia, 2017
The Australian Dollar depreciated in last quarter of 2016. This helped improve the value of
Overseas Dividend Receipts of Australia held by foreign creditors. (Thirlwell, 2017)
2.4.3 Net Foreign Debt
Jun-2016
Aug-2016
Oct-2016
Dec-2016
Feb-2017
Apr-2017
Jun-2017
980000
990000
1000000
1010000
1020000
1030000
1040000
1050000
1060000
1070000
Chart Title
Net Foreign Debt ($
Millions)
Graph 4 Change in Net Foreign Debt Stock. Source: (Reserve Bank of Australia, 2017)
The Net Foreign Debt decline as the value of Australian Dollar appreciated. The Net Foreign debt
increased as the Australian Dollar decline. One part of the reason may be that the decline in Australian
Dollar makes investment in Australian bonds more attractive to foreign creditors who now hold a
significant proportion of Australian government bonds. (Gittins, 2017)
18-Aug-16
20-Sep-16
23-Oct-16
25-Nov-16
28-Dec-16
30-Jan-17
4-Mar-17
6-Apr-17
9-May-17
11-Jun-17
14-Jul-17
16-Aug-17
18-Sep-17
0.66
0.68
0.7
0.72
0.74
0.76
0.78
0.8
0.82
Rate of Exchange (AUD/USD)
Rate of Exchange
(AUD/USD)
Graph 4: The Nominal Rate of Exchange of AUD Vs USD. Source Reserve Bank of Australia, 2017
The Australian Dollar depreciated in last quarter of 2016. This helped improve the value of
Overseas Dividend Receipts of Australia held by foreign creditors. (Thirlwell, 2017)
2.4.3 Net Foreign Debt
Jun-2016
Aug-2016
Oct-2016
Dec-2016
Feb-2017
Apr-2017
Jun-2017
980000
990000
1000000
1010000
1020000
1030000
1040000
1050000
1060000
1070000
Chart Title
Net Foreign Debt ($
Millions)
Graph 4 Change in Net Foreign Debt Stock. Source: (Reserve Bank of Australia, 2017)
The Net Foreign Debt decline as the value of Australian Dollar appreciated. The Net Foreign debt
increased as the Australian Dollar decline. One part of the reason may be that the decline in Australian
Dollar makes investment in Australian bonds more attractive to foreign creditors who now hold a
significant proportion of Australian government bonds. (Gittins, 2017)
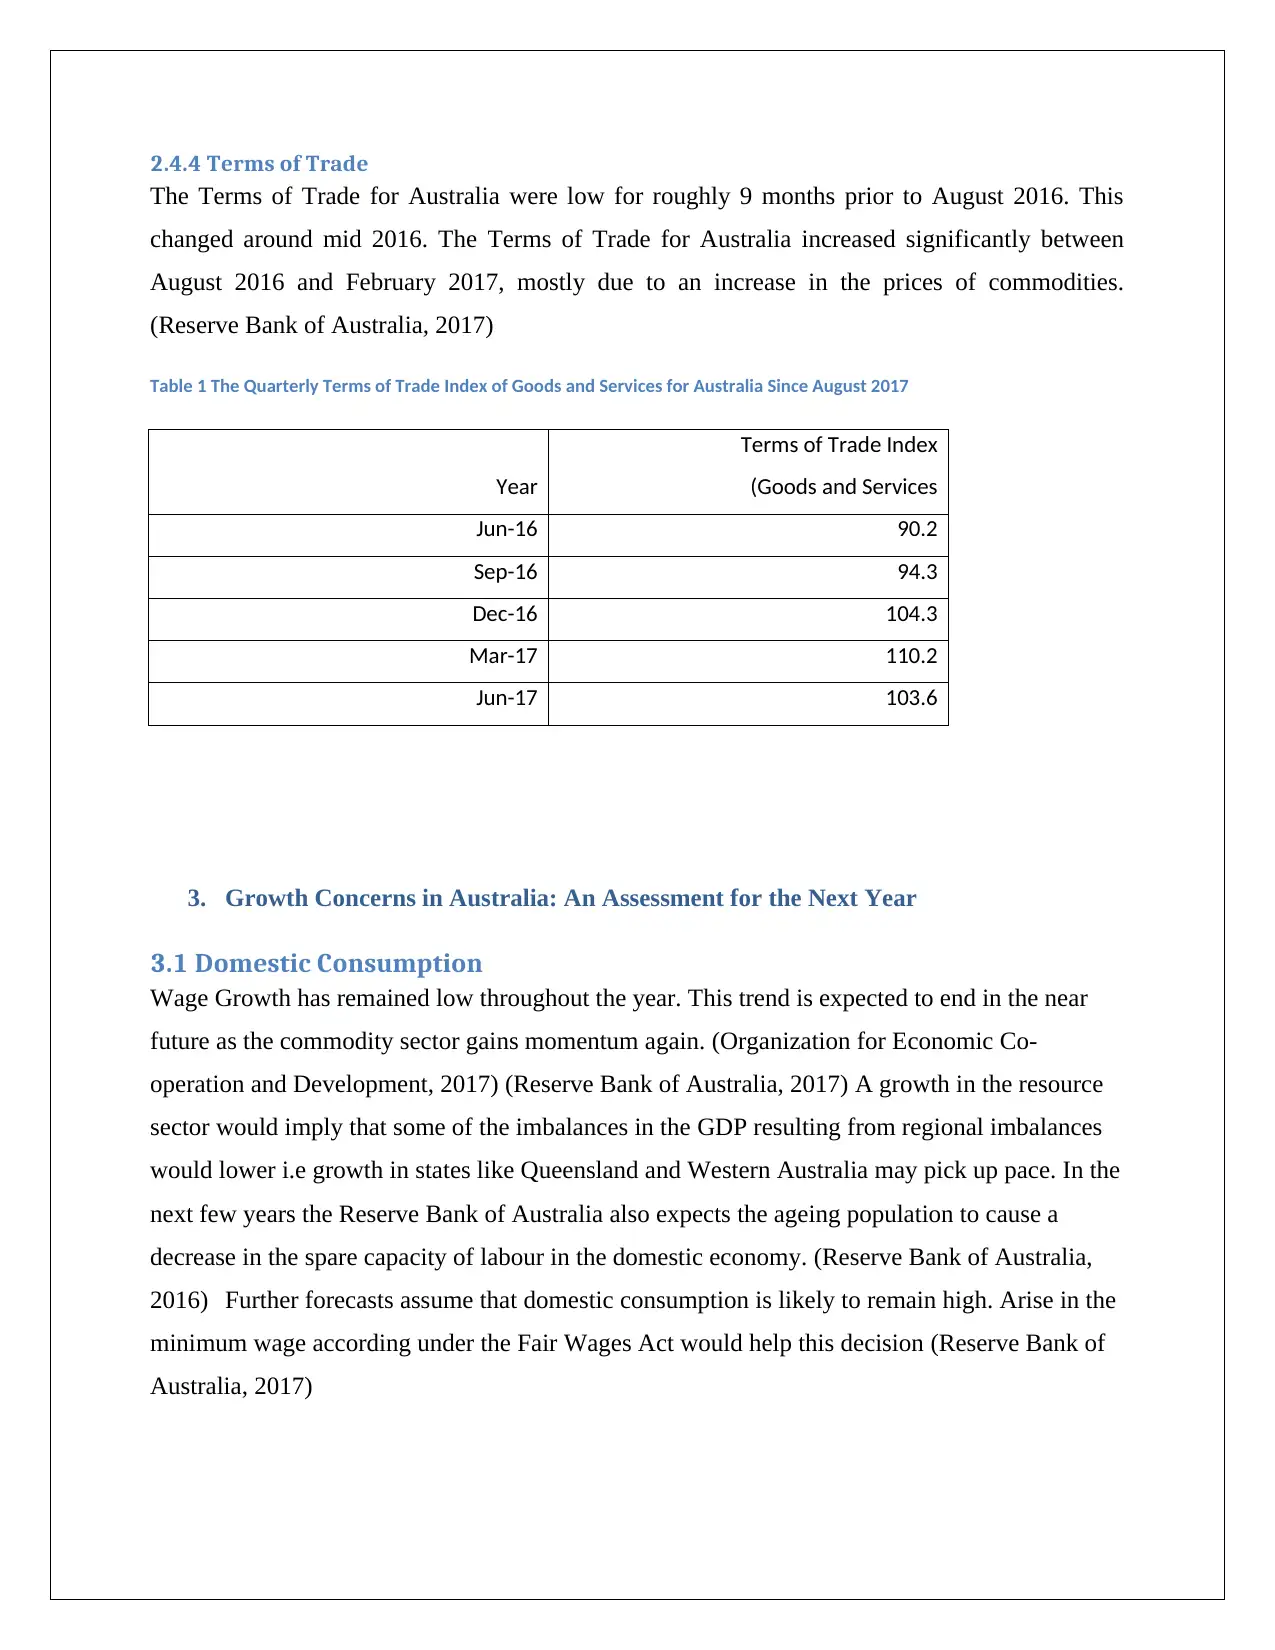
2.4.4 Terms of Trade
The Terms of Trade for Australia were low for roughly 9 months prior to August 2016. This
changed around mid 2016. The Terms of Trade for Australia increased significantly between
August 2016 and February 2017, mostly due to an increase in the prices of commodities.
(Reserve Bank of Australia, 2017)
Table 1 The Quarterly Terms of Trade Index of Goods and Services for Australia Since August 2017
Year
Terms of Trade Index
(Goods and Services
Jun-16 90.2
Sep-16 94.3
Dec-16 104.3
Mar-17 110.2
Jun-17 103.6
3. Growth Concerns in Australia: An Assessment for the Next Year
3.1 Domestic Consumption
Wage Growth has remained low throughout the year. This trend is expected to end in the near
future as the commodity sector gains momentum again. (Organization for Economic Co-
operation and Development, 2017) (Reserve Bank of Australia, 2017) A growth in the resource
sector would imply that some of the imbalances in the GDP resulting from regional imbalances
would lower i.e growth in states like Queensland and Western Australia may pick up pace. In the
next few years the Reserve Bank of Australia also expects the ageing population to cause a
decrease in the spare capacity of labour in the domestic economy. (Reserve Bank of Australia,
2016) Further forecasts assume that domestic consumption is likely to remain high. Arise in the
minimum wage according under the Fair Wages Act would help this decision (Reserve Bank of
Australia, 2017)
⊘ This is a preview!⊘
Do you want full access?
Subscribe today to unlock all pages.
Trusted by 1+ million students worldwide
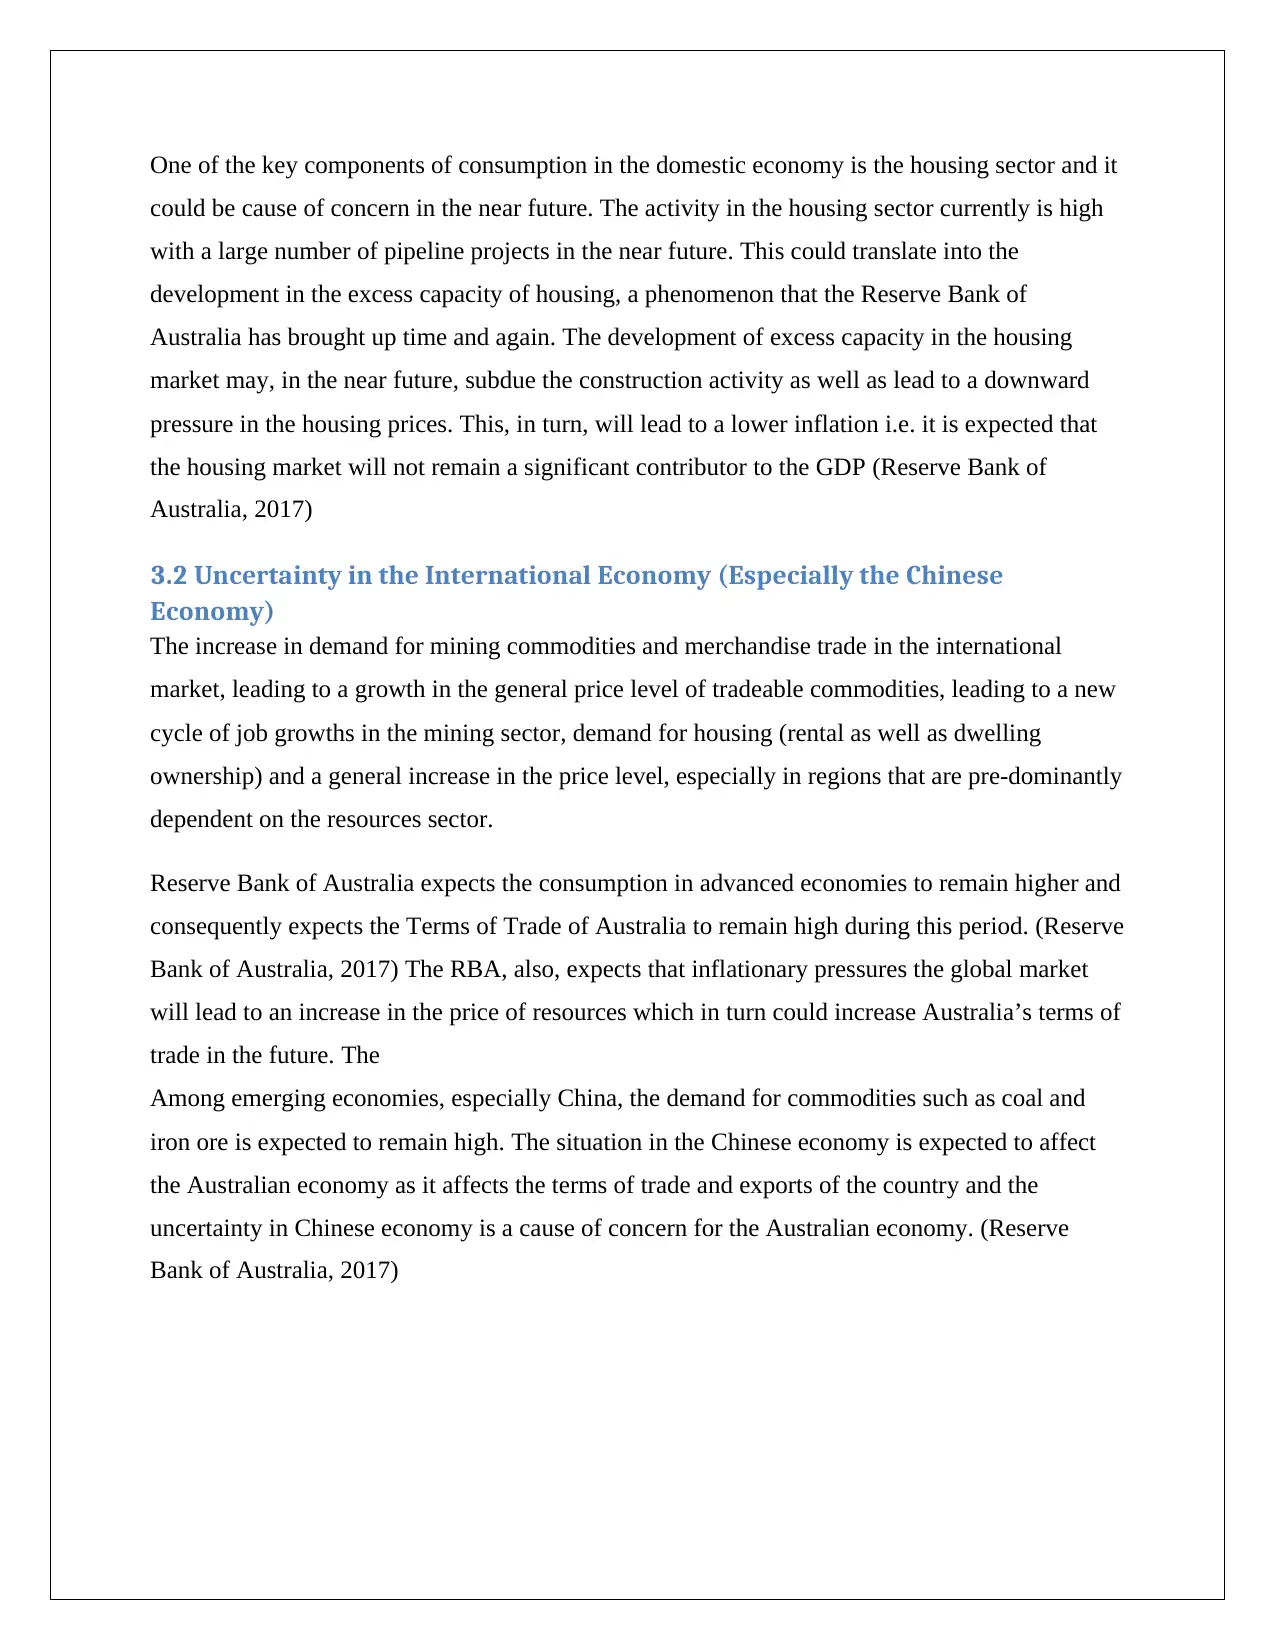
One of the key components of consumption in the domestic economy is the housing sector and it
could be cause of concern in the near future. The activity in the housing sector currently is high
with a large number of pipeline projects in the near future. This could translate into the
development in the excess capacity of housing, a phenomenon that the Reserve Bank of
Australia has brought up time and again. The development of excess capacity in the housing
market may, in the near future, subdue the construction activity as well as lead to a downward
pressure in the housing prices. This, in turn, will lead to a lower inflation i.e. it is expected that
the housing market will not remain a significant contributor to the GDP (Reserve Bank of
Australia, 2017)
3.2 Uncertainty in the International Economy (Especially the Chinese
Economy)
The increase in demand for mining commodities and merchandise trade in the international
market, leading to a growth in the general price level of tradeable commodities, leading to a new
cycle of job growths in the mining sector, demand for housing (rental as well as dwelling
ownership) and a general increase in the price level, especially in regions that are pre-dominantly
dependent on the resources sector.
Reserve Bank of Australia expects the consumption in advanced economies to remain higher and
consequently expects the Terms of Trade of Australia to remain high during this period. (Reserve
Bank of Australia, 2017) The RBA, also, expects that inflationary pressures the global market
will lead to an increase in the price of resources which in turn could increase Australia’s terms of
trade in the future. The
Among emerging economies, especially China, the demand for commodities such as coal and
iron ore is expected to remain high. The situation in the Chinese economy is expected to affect
the Australian economy as it affects the terms of trade and exports of the country and the
uncertainty in Chinese economy is a cause of concern for the Australian economy. (Reserve
Bank of Australia, 2017)
Paraphrase This Document
Need a fresh take? Get an instant paraphrase of this document with our AI Paraphraser
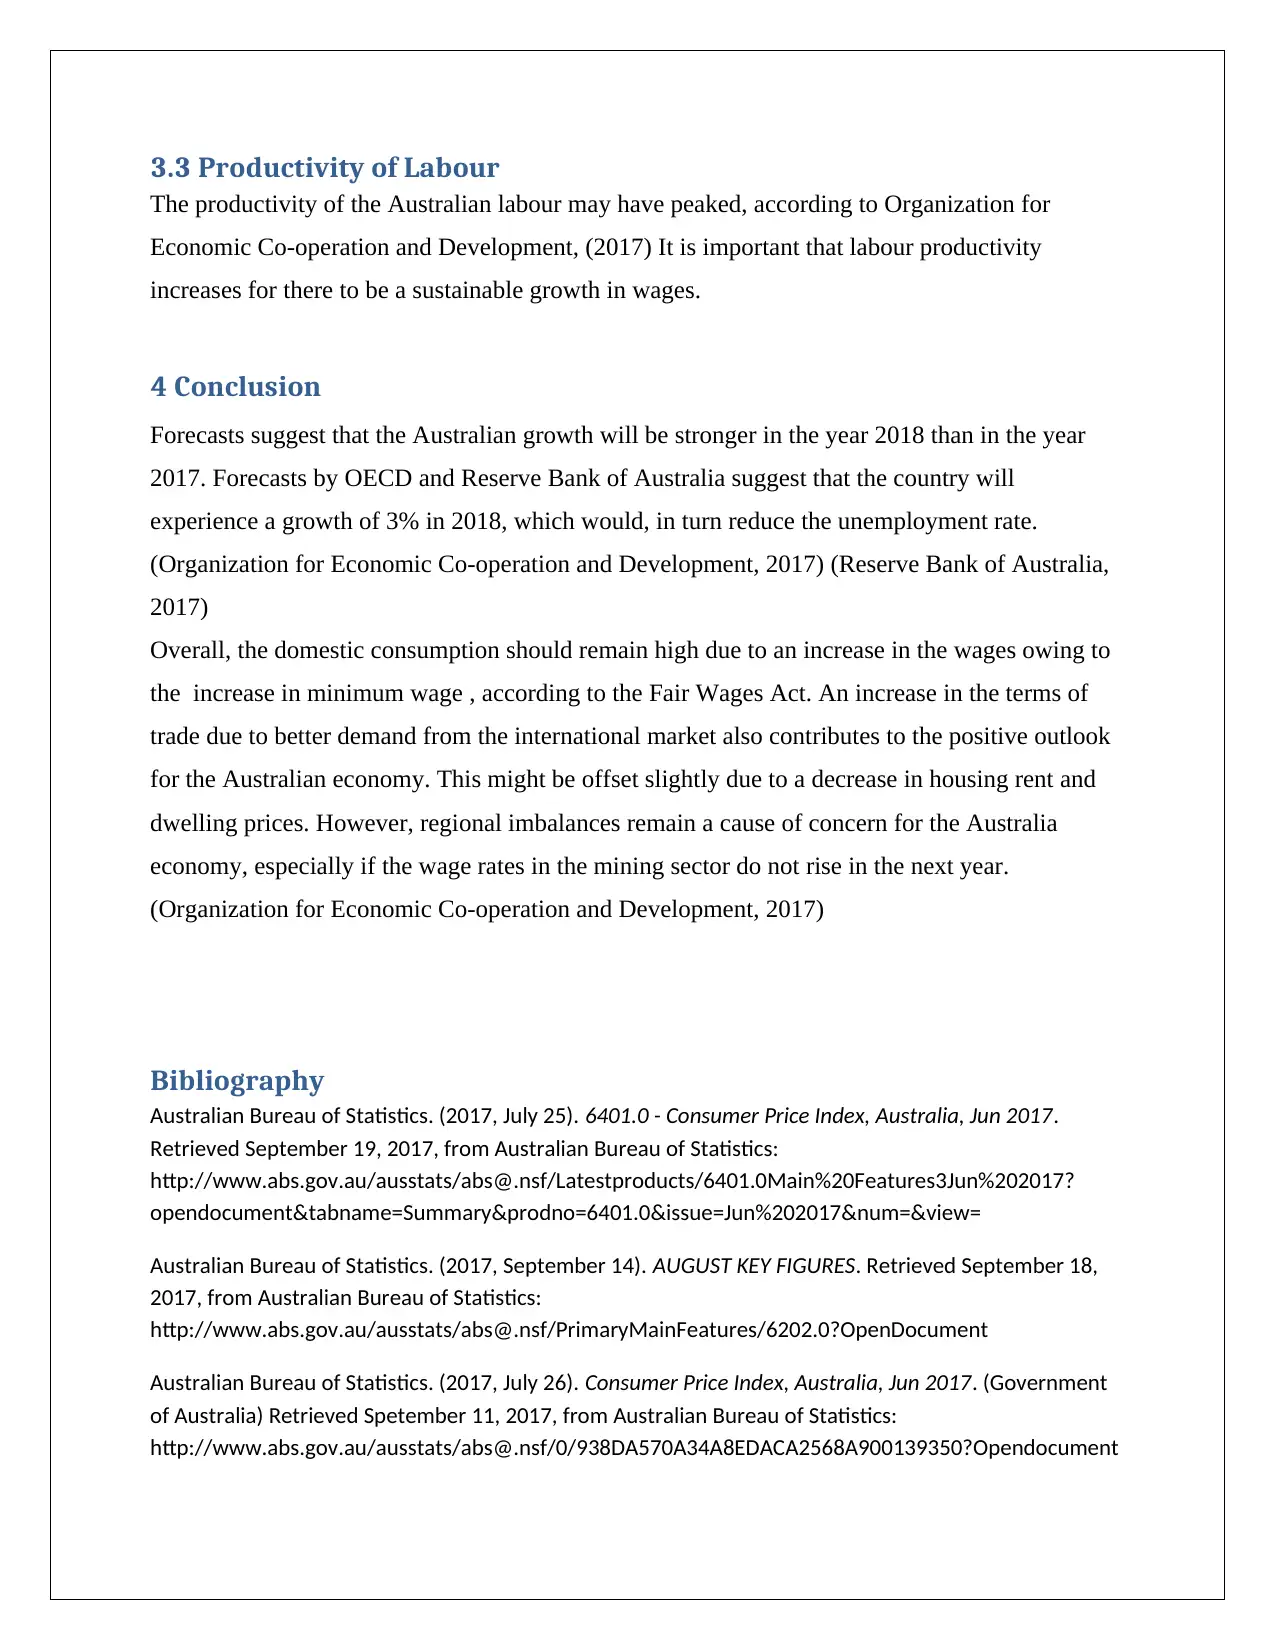
3.3 Productivity of Labour
The productivity of the Australian labour may have peaked, according to Organization for
Economic Co-operation and Development, (2017) It is important that labour productivity
increases for there to be a sustainable growth in wages.
4 Conclusion
Forecasts suggest that the Australian growth will be stronger in the year 2018 than in the year
2017. Forecasts by OECD and Reserve Bank of Australia suggest that the country will
experience a growth of 3% in 2018, which would, in turn reduce the unemployment rate.
(Organization for Economic Co-operation and Development, 2017) (Reserve Bank of Australia,
2017)
Overall, the domestic consumption should remain high due to an increase in the wages owing to
the increase in minimum wage , according to the Fair Wages Act. An increase in the terms of
trade due to better demand from the international market also contributes to the positive outlook
for the Australian economy. This might be offset slightly due to a decrease in housing rent and
dwelling prices. However, regional imbalances remain a cause of concern for the Australia
economy, especially if the wage rates in the mining sector do not rise in the next year.
(Organization for Economic Co-operation and Development, 2017)
Bibliography
Australian Bureau of Statistics. (2017, July 25). 6401.0 - Consumer Price Index, Australia, Jun 2017.
Retrieved September 19, 2017, from Australian Bureau of Statistics:
http://www.abs.gov.au/ausstats/abs@.nsf/Latestproducts/6401.0Main%20Features3Jun%202017?
opendocument&tabname=Summary&prodno=6401.0&issue=Jun%202017&num=&view=
Australian Bureau of Statistics. (2017, September 14). AUGUST KEY FIGURES. Retrieved September 18,
2017, from Australian Bureau of Statistics:
http://www.abs.gov.au/ausstats/abs@.nsf/PrimaryMainFeatures/6202.0?OpenDocument
Australian Bureau of Statistics. (2017, July 26). Consumer Price Index, Australia, Jun 2017. (Government
of Australia) Retrieved Spetember 11, 2017, from Australian Bureau of Statistics:
http://www.abs.gov.au/ausstats/abs@.nsf/0/938DA570A34A8EDACA2568A900139350?Opendocument
Gittins, R. (2017, April 8). Australia has $1 trillion foreign debt. Should we be worried? . Retrieved
September 19, 2017, from The Sydney Morning Herald: http://www.smh.com.au/business/the-
economy/australias-1-trillion-foreign-debt-level-should-worry-us-all-20170407-gvfsqq.html
Organization for Economic Co-operation and Development. (2017). 2017 Economic Survey of Australia.
Paris: Organization for Economic Co-operation and Development.
Reserve Bank of Australia. (2017). Inflation Target. Retrieved September 11, 2017, from Reserve Bank of
Australia: http://www.rba.gov.au/inflation/inflation-target.html
Reserve Bank of Australia. (2017, August). Statement on Monetary Policy – August 2017 Box A The
Recent Pick-up in Global Merchandise Trade . Retrieved September 11, 2017, from Reserve Bank of
Australia: https://www.rba.gov.au/publications/smp/2017/aug/box-a-the-recent-pick-up-in-global-
merchandise-trade.html
Reserve Bank of Australia. (2017, August). Statement on Monetary Policy – August 2017 Box C Minimum
Wage Decision. Retrieved September 11, 2017, from Reserve Bank of Australia:
https://www.rba.gov.au/publications/smp/2017/aug/box-c-minimum-wage-decision.html
Reserve Bank of Australia. (2016, November). Statement on Monetary Policy – November 2016.
Retrieved September 18, 2017, from Reserve Bank of Australia:
https://www.rba.gov.au/publications/smp/2016/nov/economic-outlook.html
Reserve Bank of Australia. (2017). Statement on Monetary Policy August 2017. Melbourne: Reserve Bank
of Australia.
Reserve Bank of Australia. (2017). Statement on Monetary Policy, February 2017. Melbourne: Reserve
Bank of Australia.
Reserve Bank of Australia. (2017, July 27). Statistical Tables. Retrieved September 11, 2017, from
Reserve Bank of Australia: http://www.rba.gov.au/statistics/tables/
The Department of Foreign Affairs and Trade . (2017). Composition of Trade Australia 2016. Melbourne:
The Department of Foreign Affairs and Trade , Australian Government.
Thirlwell, M. (2017, June 23). Australia’s shrinking current account deficit. Retrieved Spetember 19,
2017, from Australian Trade and Investment Commission:
https://www.austrade.gov.au/news/economic-analysis/australias-shrinking-current-account-deficit
⊘ This is a preview!⊘
Do you want full access?
Subscribe today to unlock all pages.
Trusted by 1+ million students worldwide
1 out of 12
Related Documents


Your All-in-One AI-Powered Toolkit for Academic Success.
+13062052269
info@desklib.com
Available 24*7 on WhatsApp / Email
![[object Object]](/_next/static/media/star-bottom.7253800d.svg)
Unlock your academic potential
Copyright © 2020–2026 A2Z Services. All Rights Reserved. Developed and managed by ZUCOL.