Assesment of the Australian Economy: Trends, Challenges, and Outlook
VerifiedAdded on 2022/11/07
|10
|2252
|160
Report
AI Summary
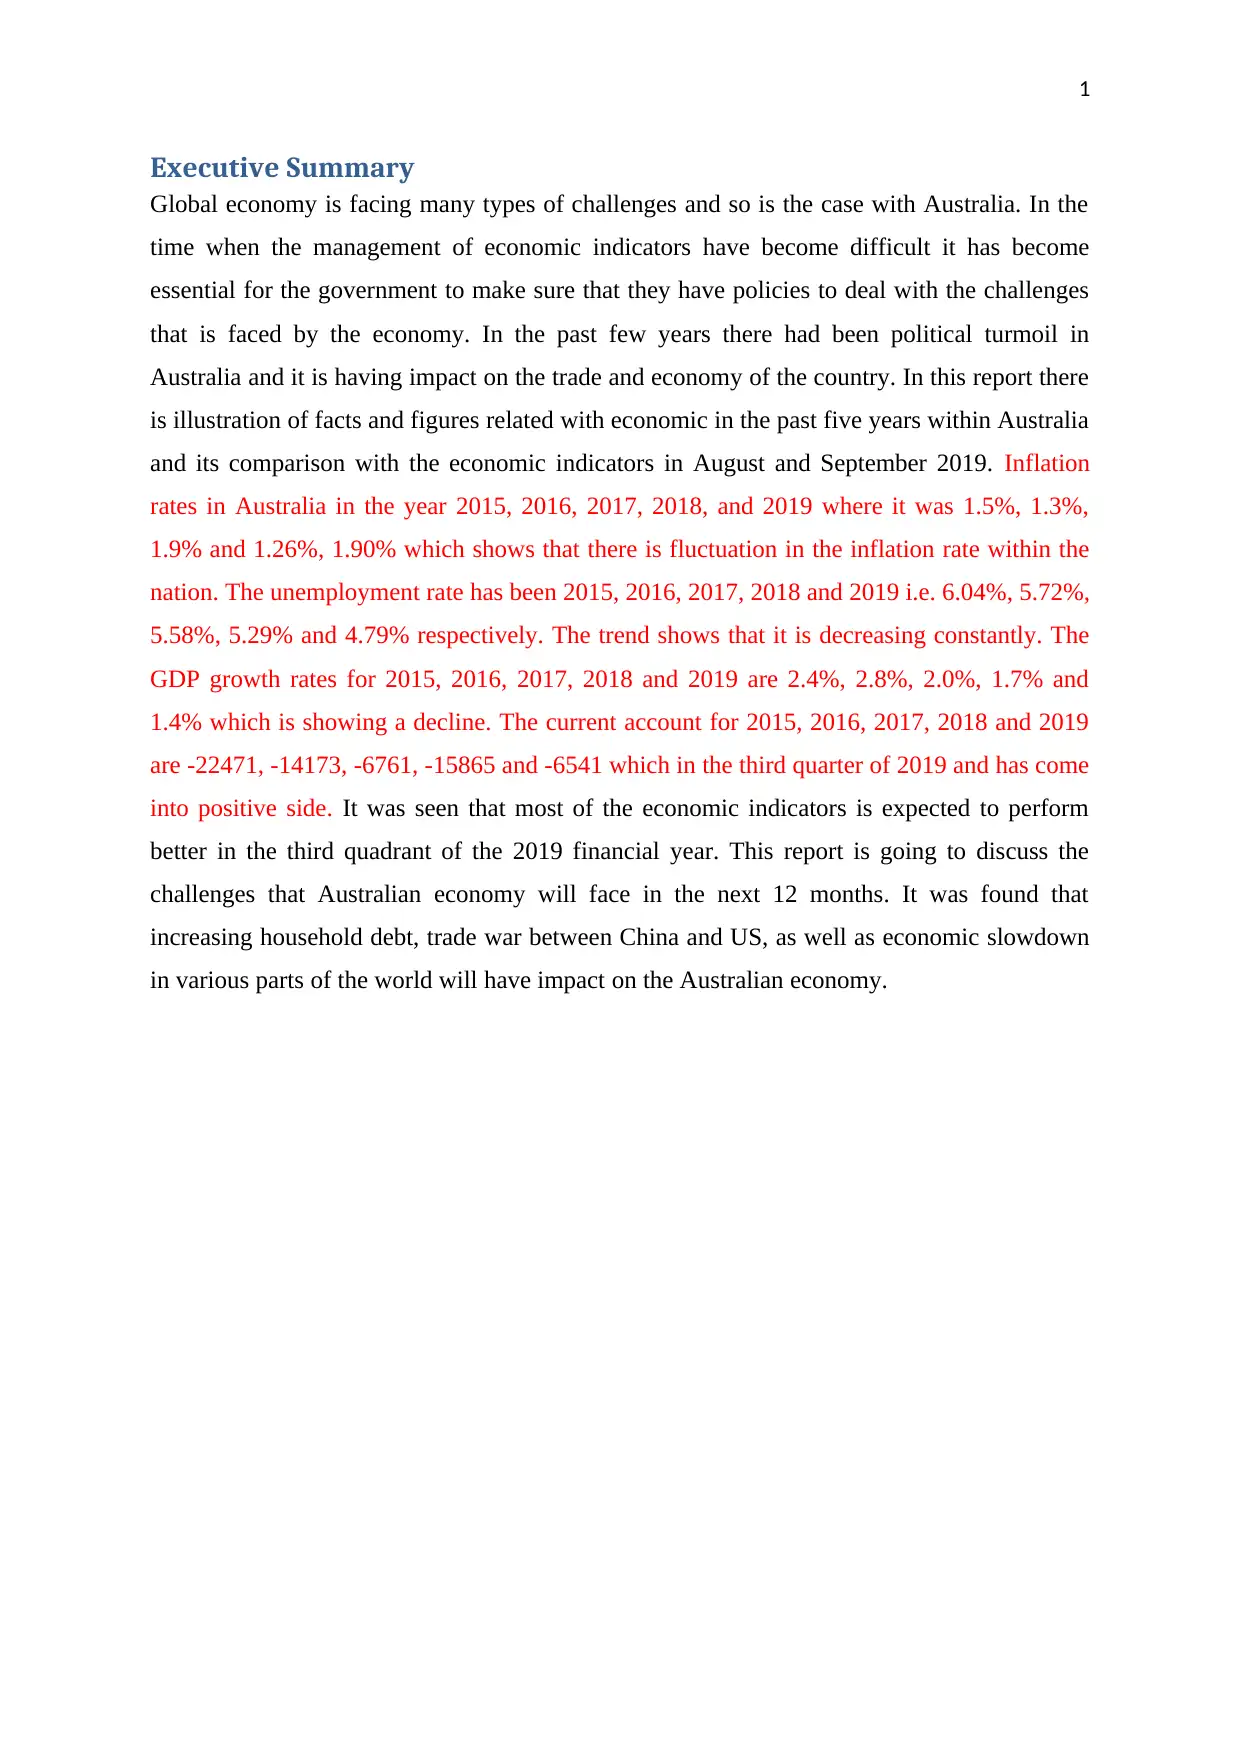
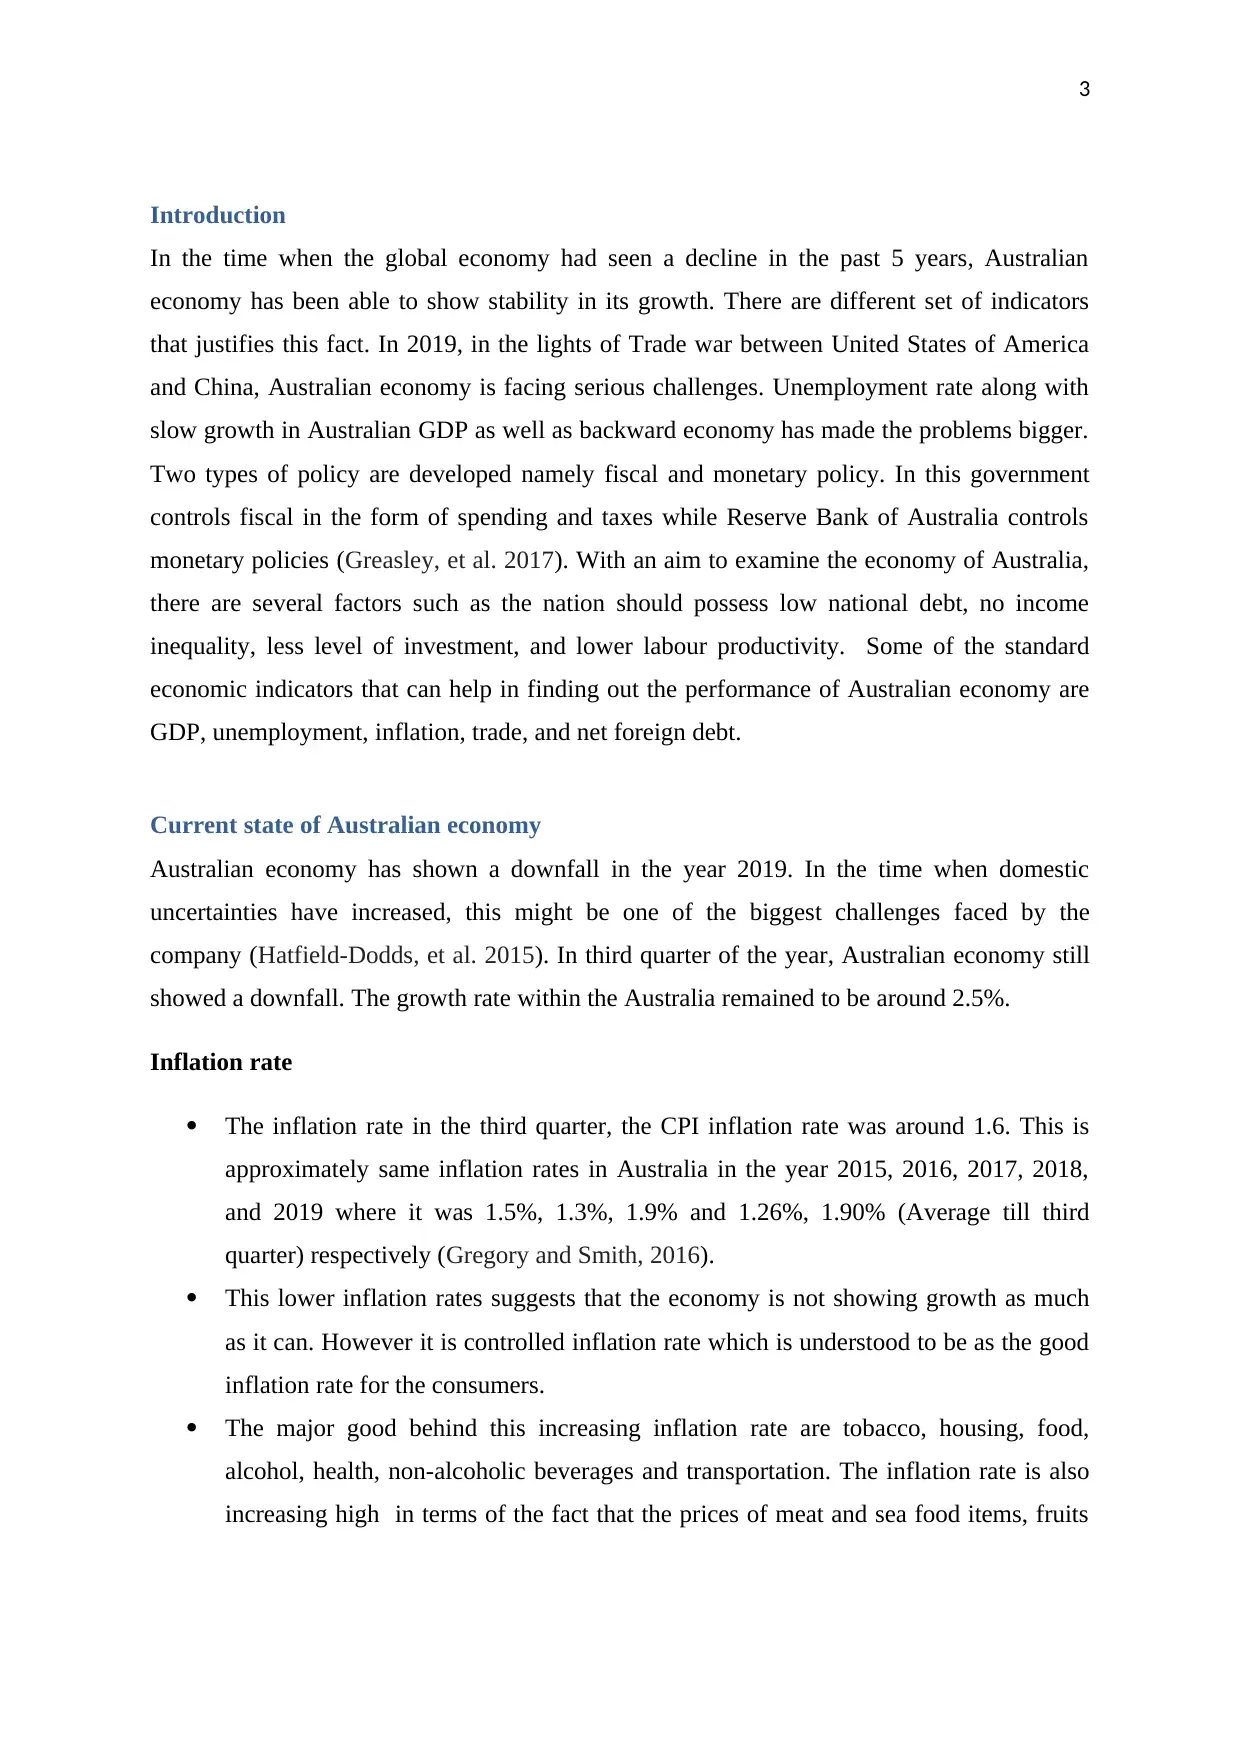
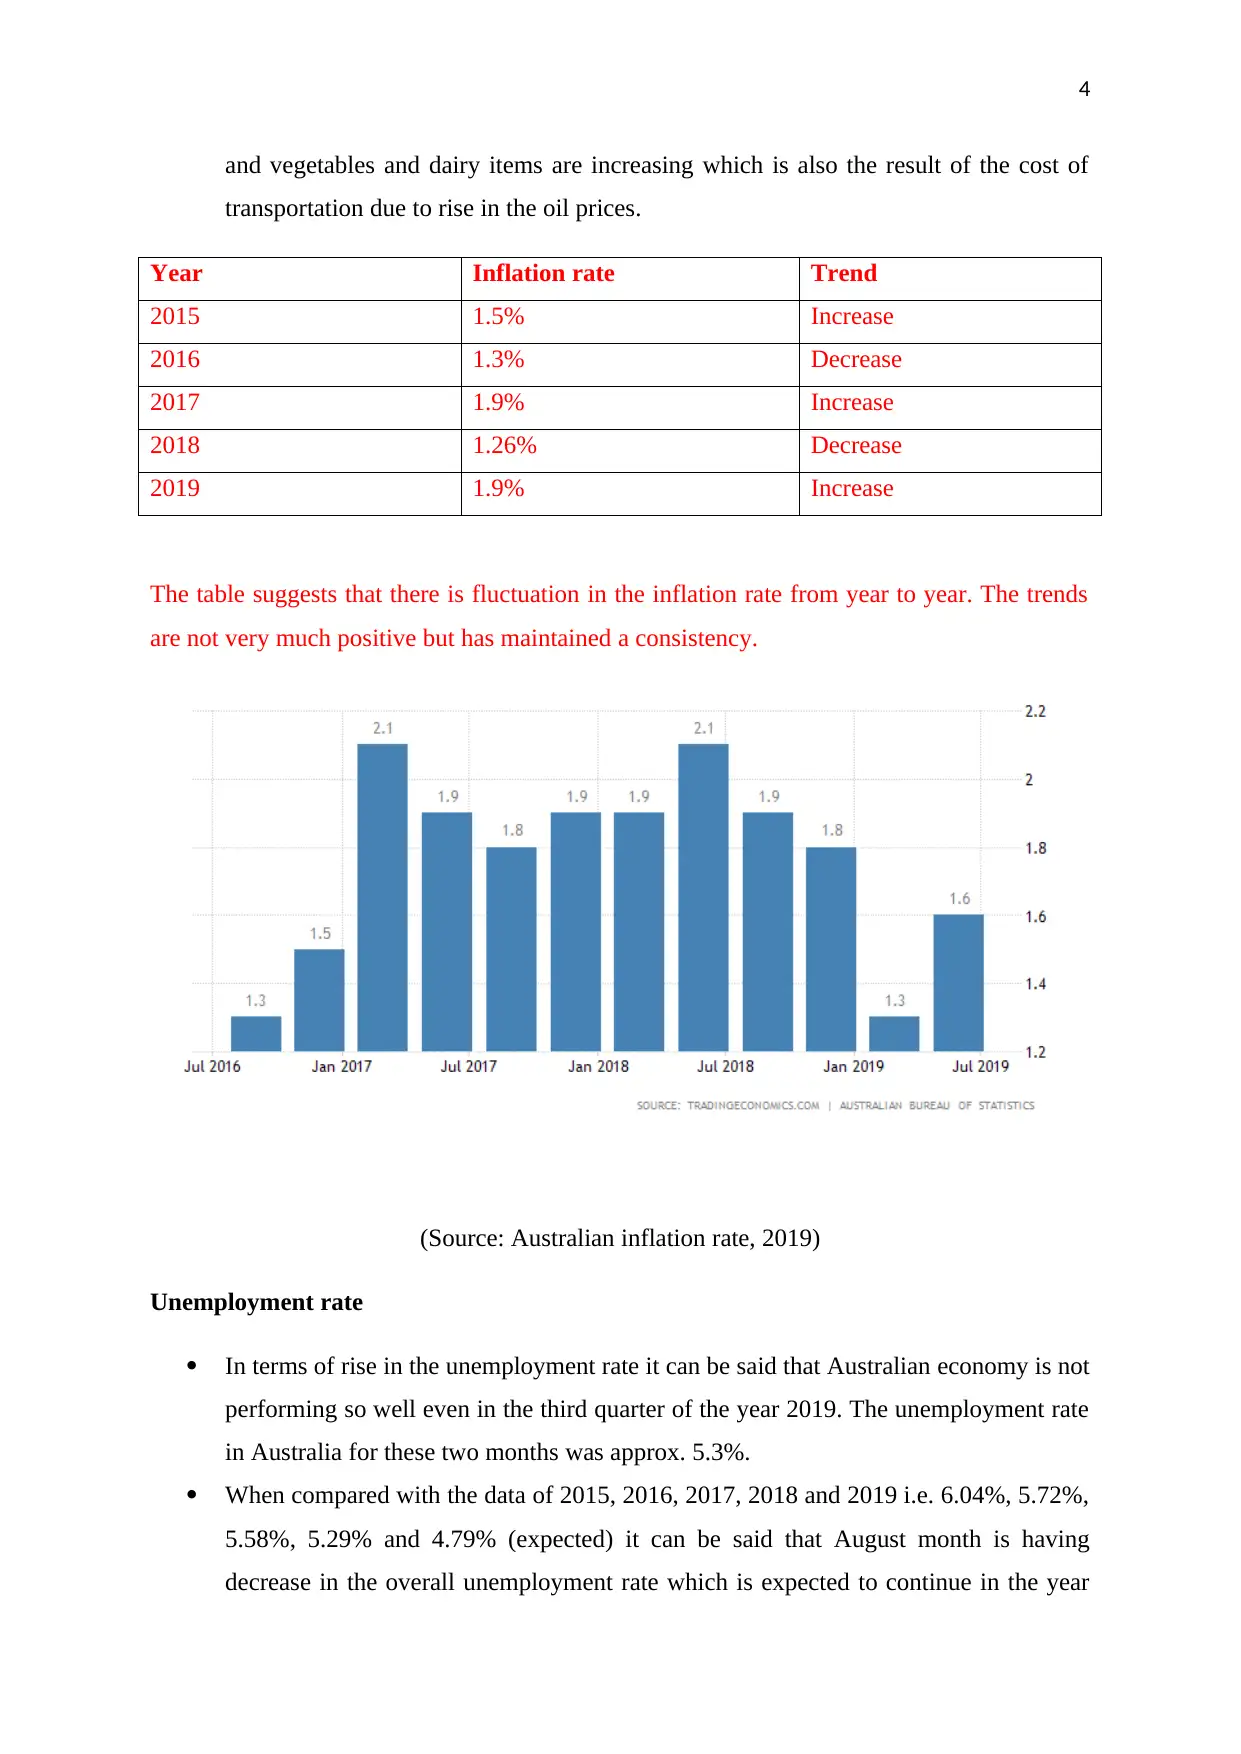
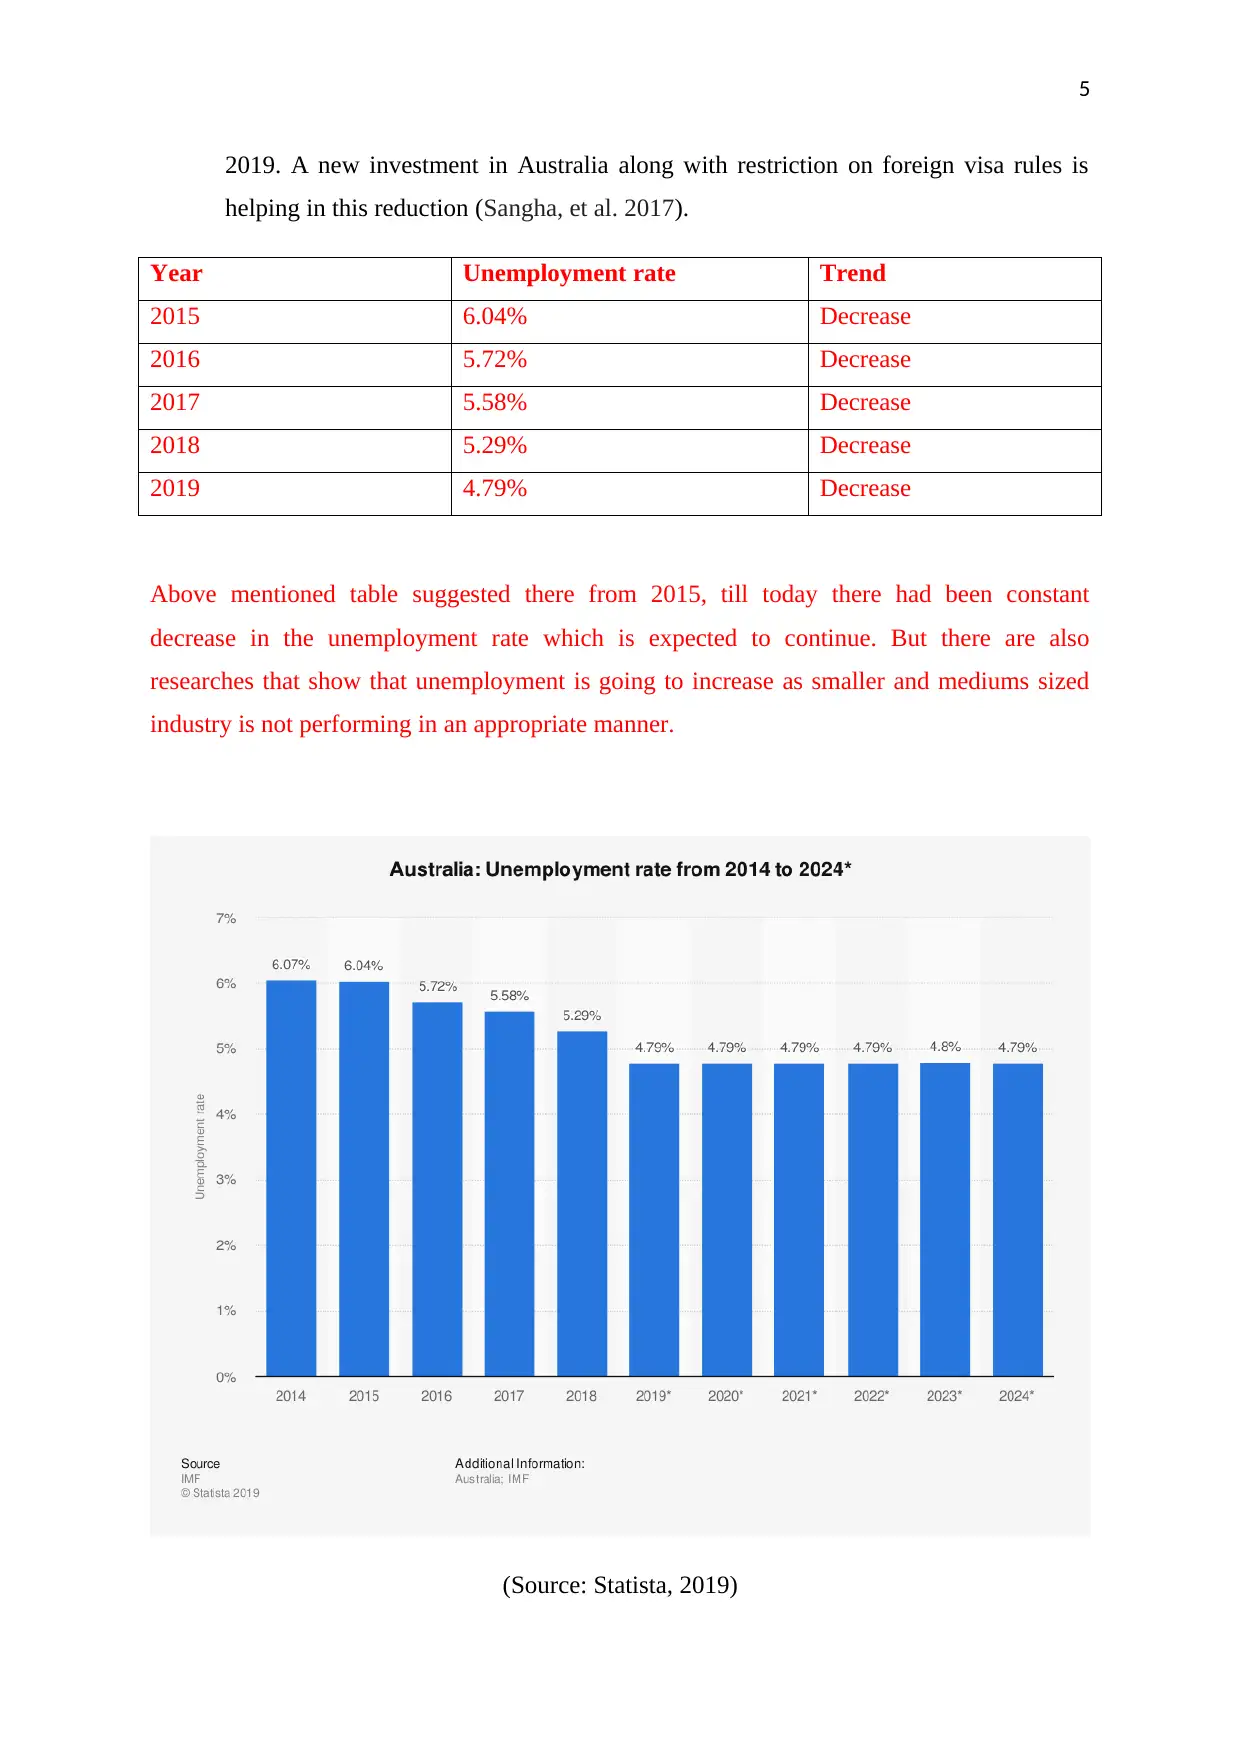
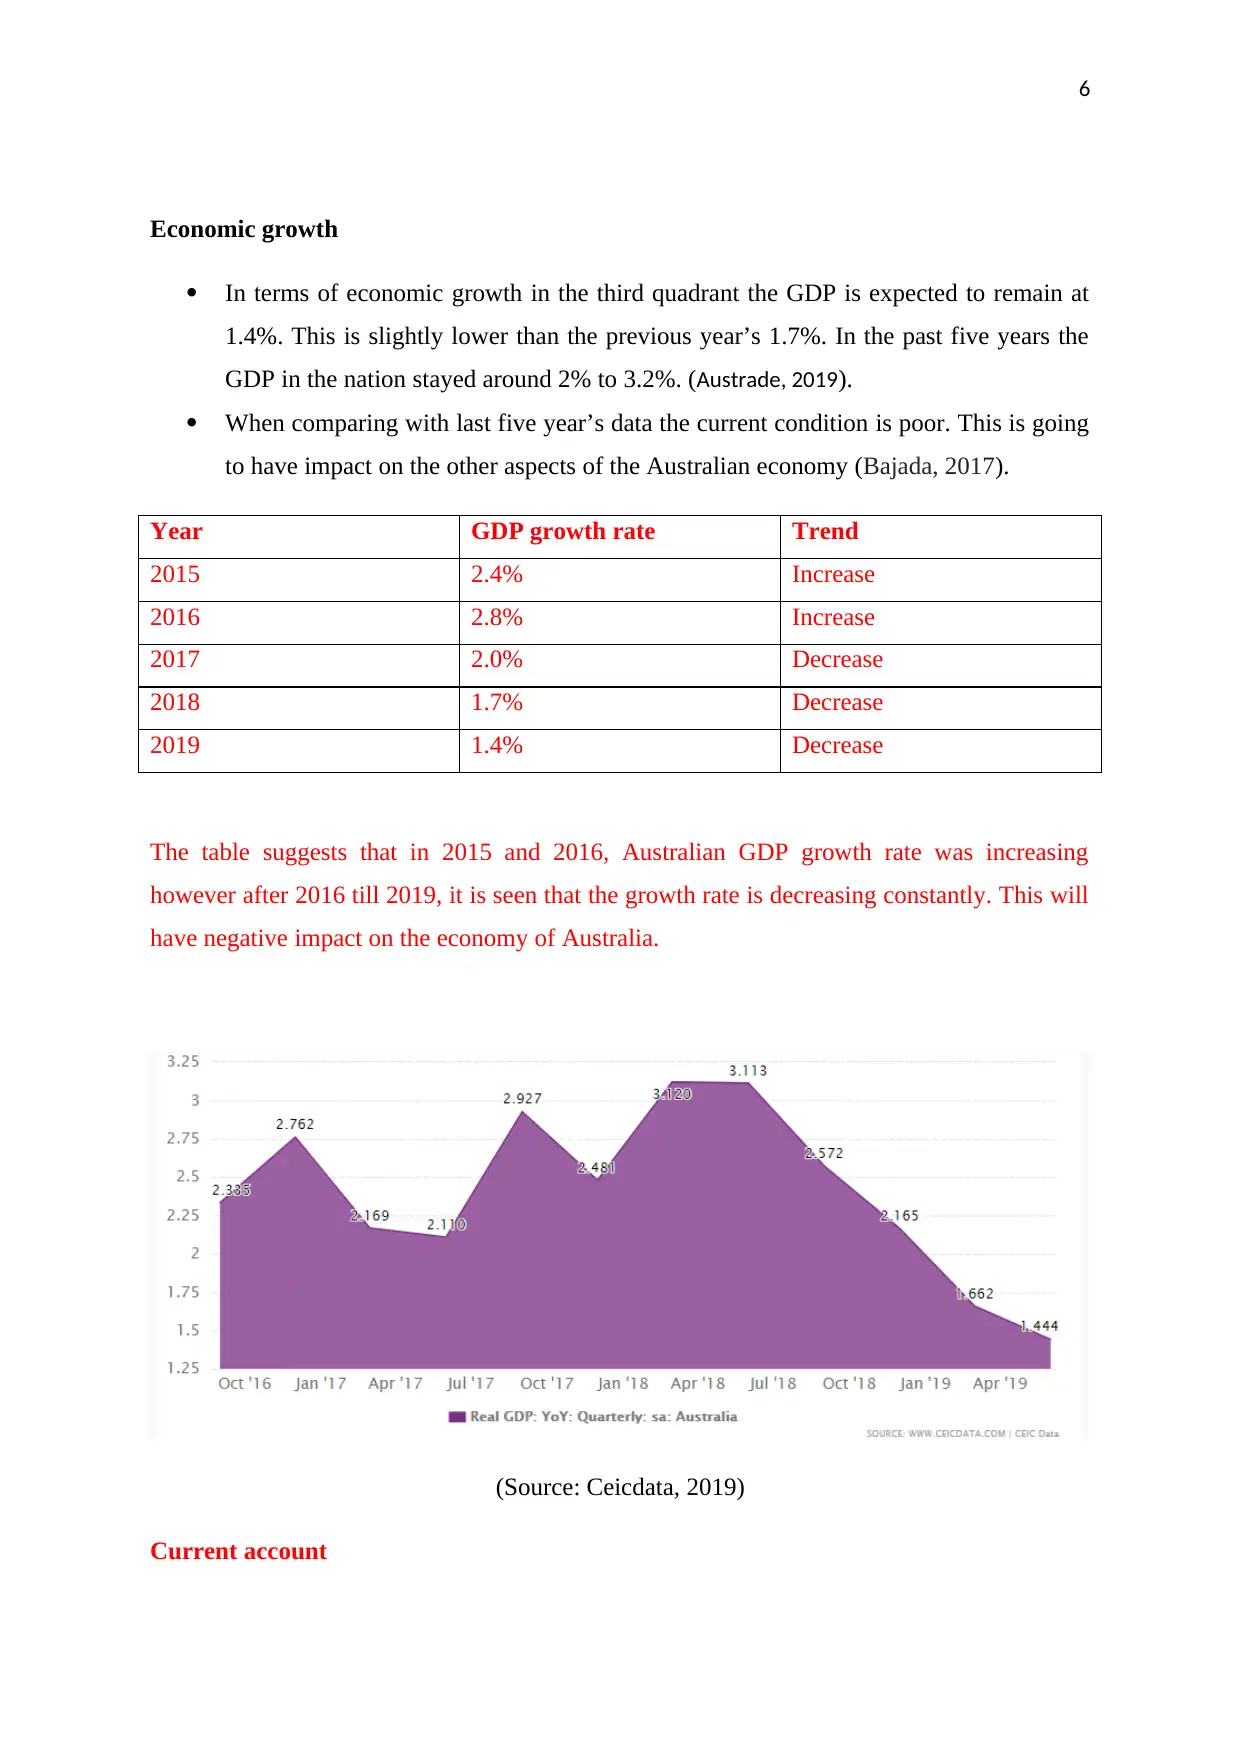
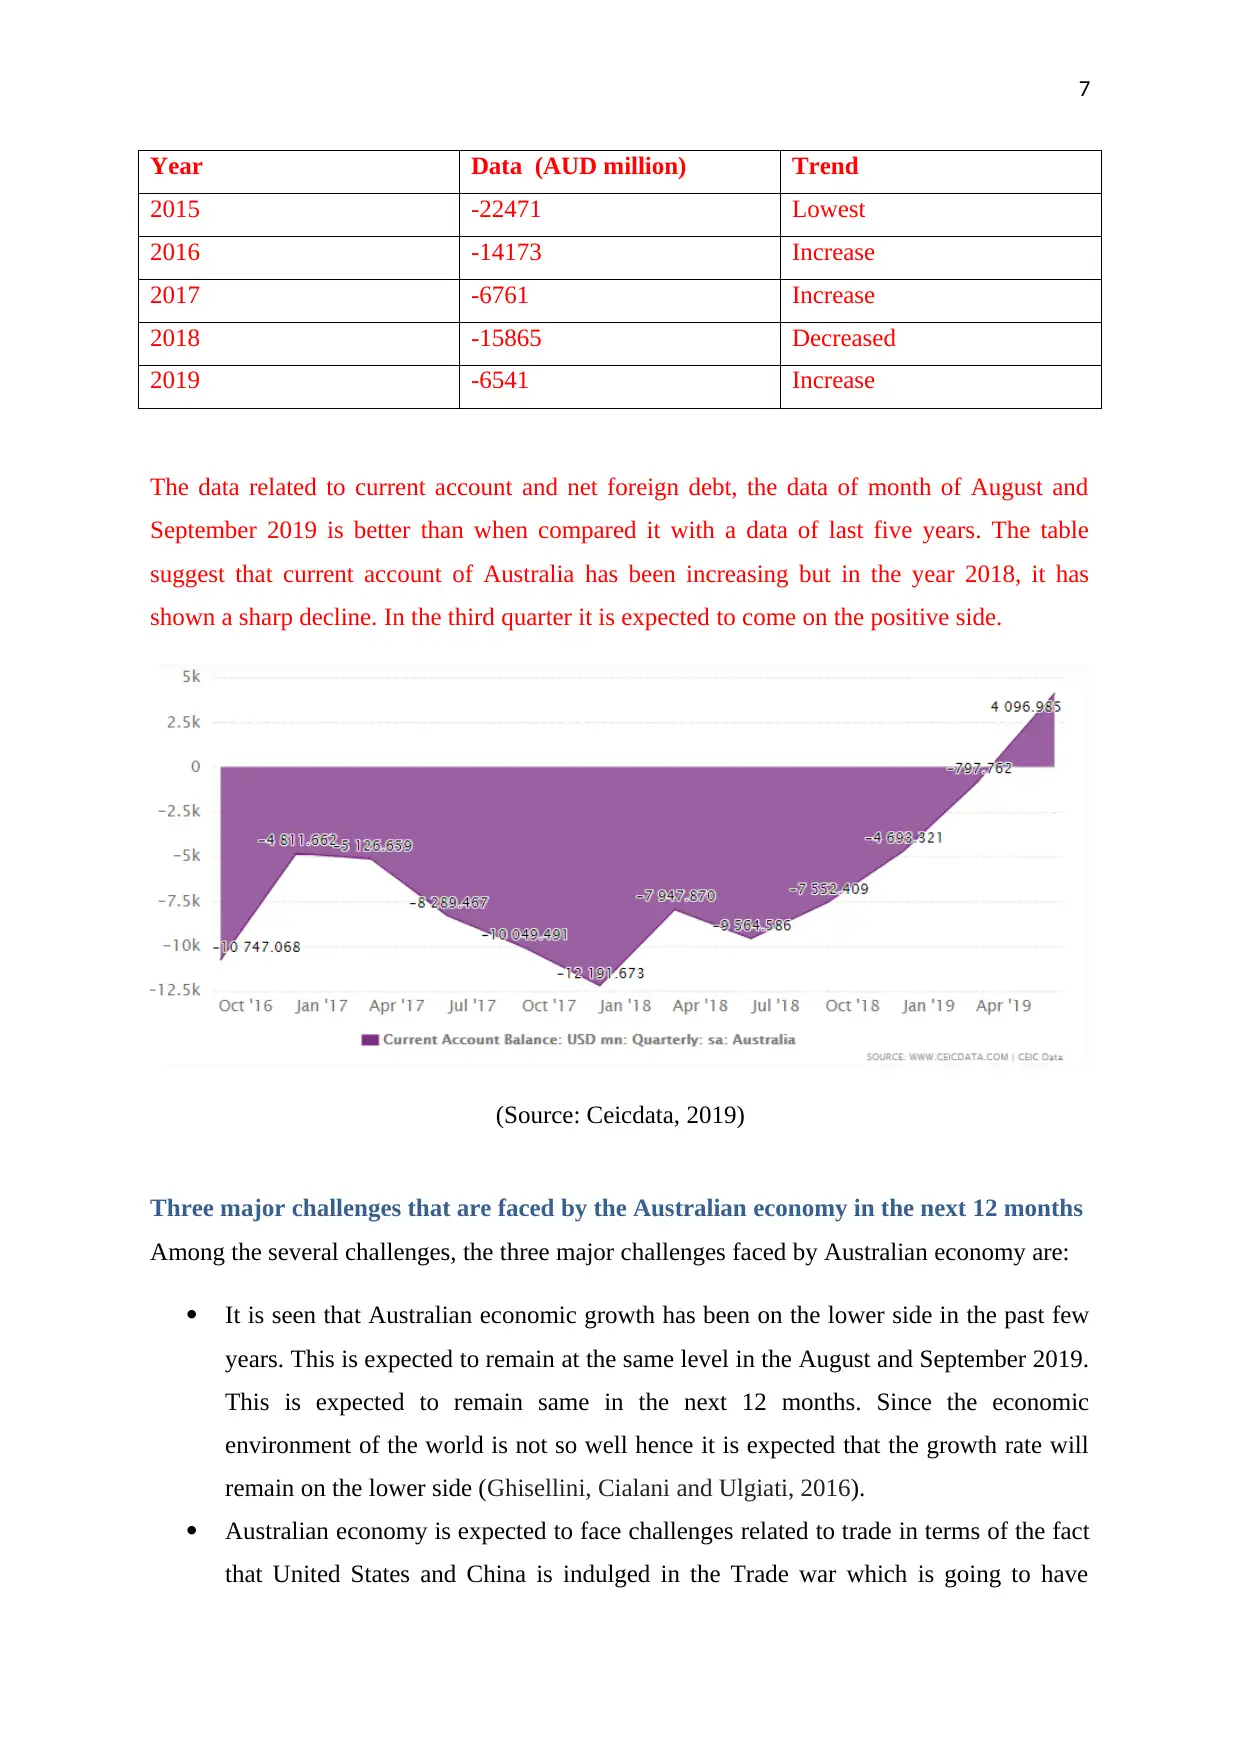
This report provides a comprehensive analysis of the Australian economy, examining key economic indicators such as GDP, unemployment, inflation, and trade from 2015 to 2019. It delves into the current state of the Australian economy, comparing recent figures with historical data to identify trends and fluctuations. The report also explores major challenges facing the Australian economy in the next 12 months, including increasing household debt, the impact of the US-China trade war, and global economic slowdowns. The analysis includes a detailed look at inflation rates, unemployment rates, GDP growth rates, and current account data, providing insights into the economic performance and future outlook. The report concludes by summarizing the findings and highlighting the potential impact of these challenges on the Australian economy, offering a valuable resource for students studying economics and related fields.
Contribute Materials
Your contribution can guide someone’s learning journey. Share your
documents today.

ECONOMICS
ASSIGNMENT
ASSIGNMENT
Secure Best Marks with AI Grader
Need help grading? Try our AI Grader for instant feedback on your assignments.

1
Executive Summary
Global economy is facing many types of challenges and so is the case with Australia. In the
time when the management of economic indicators have become difficult it has become
essential for the government to make sure that they have policies to deal with the challenges
that is faced by the economy. In the past few years there had been political turmoil in
Australia and it is having impact on the trade and economy of the country. In this report there
is illustration of facts and figures related with economic in the past five years within Australia
and its comparison with the economic indicators in August and September 2019. Inflation
rates in Australia in the year 2015, 2016, 2017, 2018, and 2019 where it was 1.5%, 1.3%,
1.9% and 1.26%, 1.90% which shows that there is fluctuation in the inflation rate within the
nation. The unemployment rate has been 2015, 2016, 2017, 2018 and 2019 i.e. 6.04%, 5.72%,
5.58%, 5.29% and 4.79% respectively. The trend shows that it is decreasing constantly. The
GDP growth rates for 2015, 2016, 2017, 2018 and 2019 are 2.4%, 2.8%, 2.0%, 1.7% and
1.4% which is showing a decline. The current account for 2015, 2016, 2017, 2018 and 2019
are -22471, -14173, -6761, -15865 and -6541 which in the third quarter of 2019 and has come
into positive side. It was seen that most of the economic indicators is expected to perform
better in the third quadrant of the 2019 financial year. This report is going to discuss the
challenges that Australian economy will face in the next 12 months. It was found that
increasing household debt, trade war between China and US, as well as economic slowdown
in various parts of the world will have impact on the Australian economy.

2
Contents
Introduction...........................................................................................................................................1
Current state of Australian economy.....................................................................................................1
Three major challenges that are faced by the Australian economy in the next 12 months.....................4
Conclusion.............................................................................................................................................5
References.............................................................................................................................................5

3
Introduction
In the time when the global economy had seen a decline in the past 5 years, Australian
economy has been able to show stability in its growth. There are different set of indicators
that justifies this fact. In 2019, in the lights of Trade war between United States of America
and China, Australian economy is facing serious challenges. Unemployment rate along with
slow growth in Australian GDP as well as backward economy has made the problems bigger.
Two types of policy are developed namely fiscal and monetary policy. In this government
controls fiscal in the form of spending and taxes while Reserve Bank of Australia controls
monetary policies (Greasley, et al. 2017). With an aim to examine the economy of Australia,
there are several factors such as the nation should possess low national debt, no income
inequality, less level of investment, and lower labour productivity. Some of the standard
economic indicators that can help in finding out the performance of Australian economy are
GDP, unemployment, inflation, trade, and net foreign debt.
Current state of Australian economy
Australian economy has shown a downfall in the year 2019. In the time when domestic
uncertainties have increased, this might be one of the biggest challenges faced by the
company (Hatfield-Dodds, et al. 2015). In third quarter of the year, Australian economy still
showed a downfall. The growth rate within the Australia remained to be around 2.5%.
Inflation rate
The inflation rate in the third quarter, the CPI inflation rate was around 1.6. This is
approximately same inflation rates in Australia in the year 2015, 2016, 2017, 2018,
and 2019 where it was 1.5%, 1.3%, 1.9% and 1.26%, 1.90% (Average till third
quarter) respectively (Gregory and Smith, 2016).
This lower inflation rates suggests that the economy is not showing growth as much
as it can. However it is controlled inflation rate which is understood to be as the good
inflation rate for the consumers.
The major good behind this increasing inflation rate are tobacco, housing, food,
alcohol, health, non-alcoholic beverages and transportation. The inflation rate is also
increasing high in terms of the fact that the prices of meat and sea food items, fruits
Secure Best Marks with AI Grader
Need help grading? Try our AI Grader for instant feedback on your assignments.

4
and vegetables and dairy items are increasing which is also the result of the cost of
transportation due to rise in the oil prices.
Year Inflation rate Trend
2015 1.5% Increase
2016 1.3% Decrease
2017 1.9% Increase
2018 1.26% Decrease
2019 1.9% Increase
The table suggests that there is fluctuation in the inflation rate from year to year. The trends
are not very much positive but has maintained a consistency.
(Source: Australian inflation rate, 2019)
Unemployment rate
In terms of rise in the unemployment rate it can be said that Australian economy is not
performing so well even in the third quarter of the year 2019. The unemployment rate
in Australia for these two months was approx. 5.3%.
When compared with the data of 2015, 2016, 2017, 2018 and 2019 i.e. 6.04%, 5.72%,
5.58%, 5.29% and 4.79% (expected) it can be said that August month is having
decrease in the overall unemployment rate which is expected to continue in the year

5
2019. A new investment in Australia along with restriction on foreign visa rules is
helping in this reduction (Sangha, et al. 2017).
Year Unemployment rate Trend
2015 6.04% Decrease
2016 5.72% Decrease
2017 5.58% Decrease
2018 5.29% Decrease
2019 4.79% Decrease
Above mentioned table suggested there from 2015, till today there had been constant
decrease in the unemployment rate which is expected to continue. But there are also
researches that show that unemployment is going to increase as smaller and mediums sized
industry is not performing in an appropriate manner.
(Source: Statista, 2019)

6
Economic growth
In terms of economic growth in the third quadrant the GDP is expected to remain at
1.4%. This is slightly lower than the previous year’s 1.7%. In the past five years the
GDP in the nation stayed around 2% to 3.2%. (Austrade, 2019).
When comparing with last five year’s data the current condition is poor. This is going
to have impact on the other aspects of the Australian economy (Bajada, 2017).
Year GDP growth rate Trend
2015 2.4% Increase
2016 2.8% Increase
2017 2.0% Decrease
2018 1.7% Decrease
2019 1.4% Decrease
The table suggests that in 2015 and 2016, Australian GDP growth rate was increasing
however after 2016 till 2019, it is seen that the growth rate is decreasing constantly. This will
have negative impact on the economy of Australia.
(Source: Ceicdata, 2019)
Current account
Paraphrase This Document
Need a fresh take? Get an instant paraphrase of this document with our AI Paraphraser

7
Year Data (AUD million) Trend
2015 -22471 Lowest
2016 -14173 Increase
2017 -6761 Increase
2018 -15865 Decreased
2019 -6541 Increase
The data related to current account and net foreign debt, the data of month of August and
September 2019 is better than when compared it with a data of last five years. The table
suggest that current account of Australia has been increasing but in the year 2018, it has
shown a sharp decline. In the third quarter it is expected to come on the positive side.
(Source: Ceicdata, 2019)
Three major challenges that are faced by the Australian economy in the next 12 months
Among the several challenges, the three major challenges faced by Australian economy are:
It is seen that Australian economic growth has been on the lower side in the past few
years. This is expected to remain at the same level in the August and September 2019.
This is expected to remain same in the next 12 months. Since the economic
environment of the world is not so well hence it is expected that the growth rate will
remain on the lower side (Ghisellini, Cialani and Ulgiati, 2016).
Australian economy is expected to face challenges related to trade in terms of the fact
that United States and China is indulged in the Trade war which is going to have

8
impact on the export and import in different parts of the world. Since Australia has
good relations with both China and US and hence managing trade will be a challenge
for the company. In the next 12 months it is expected that it will be going to have
more severe impact on the supply chain routes which will have impact on the
operations of the firms (Murray, 2017). This is also because it will be going to
enhance the taxes which will again have impact on the cost of the operations of the
firm.
Household debts have increased in the Australian. This will have impact on the
consumption capacity of the people. It is expected that in the months to come this will
be going to go on the higher side (Reserve Bank of Australia, 2019). The increasing
household debt will cause damage to the Australian economy given the fact that most
part of the economy is owned by middle class (Kudrna, 2016). Nearly two-third of the
debt is owned by the top 40% of the Australian economy. Since federal reserves is
going to enhance their interest rates so as to boost the economy but it is expected that
burden on the economy will be going to enhance.
Conclusion
From the above based report it can be concluded that Australian economy is facing several
types of challenges. However the economic indicators shows that in the third quarter of the
Australian economy there will be improvement in all the index especially when it is
compared with the data in the past 5 years. For instance inflation rate is going to stay at
around 1.6% which is average to the trend in the past. Unemployment rate is expected to
remain at 5.3% which is an increase after so many years. The current account will come in
the positive direction this will be first time in the last five years. The trade war between US
and China and global economic turndown will have impact on the ways in which firms are
doing their business.

9
References
Austrade, 2019. Robust economy underpins Australia's growth. [Online] Available at:
https://www.austrade.gov.au/news/economic-analysis/robust-economy-underpins-australias-
growth. [Accessed on 22nd September 2019]
Bajada, C., 2017. Australia's Cash Economy: A Troubling Issue for Policymakers: A
Troubling Issue for Policymakers. Routledge.
Ghisellini, P., Cialani, C. and Ulgiati, S., 2016. A review on circular economy: the expected
transition to a balanced interplay of environmental and economic systems. Journal of Cleaner
production, 114, pp.11-32.
Greasley, D., McLaughlin, E., Hanley, N. and Oxley, L., 2017. Australia: a land of missed
opportunities?. Environment and Development Economics, 22(6), pp.674-698.
Gregory, R.G. and Smith, R.E., 2016. 15 Unemployment, Inflation and Job Creation Policies
in Australia. Inflation and Unemployment: Theory, Experience and Policy Making, p.325.
Hatfield-Dodds, S., Schandl, H., Adams, P.D., Baynes, T.M., Brinsmead, T.S., Bryan, B.A.,
Chiew, F.H., Graham, P.W., Grundy, M., Harwood, T. and McCallum, R., 2015. Australia is
‘free to choose’economic growth and falling environmental pressures. Nature, 527(7576),
p.49.
Kudrna, G., 2016. Economy-wide effects of means-tested pensions: The case of
Australia. The Journal of the Economics of Ageing, 7, pp.17-29.
Murray, G., 2017. Capitalist networks and social power in Australia and New Zealand.
Routledge.
Reserve Bank of Australia, 2019. 5. Economic Outlook. [online] Available at:
https://www.rba.gov.au/publications/smp/2019/aug/economic-outlook.html. [Accessed on 22nd
September 2019]
Sangha, K.K., Russell-Smith, J., Morrison, S.C., Costanza, R. and Edwards, A., 2017.
Challenges for valuing ecosystem services from an Indigenous estate in northern
Australia. Ecosystem services, 25, pp.167-178.
1 out of 10
Related Documents

Your All-in-One AI-Powered Toolkit for Academic Success.
+13062052269
info@desklib.com
Available 24*7 on WhatsApp / Email
Unlock your academic potential
© 2024 | Zucol Services PVT LTD | All rights reserved.