BHP & CBA Share Performance, Fiscal Position of Australian Govt

Verified

Added on  2021/05/30

|16
|2654
|37
Report
AI Summary
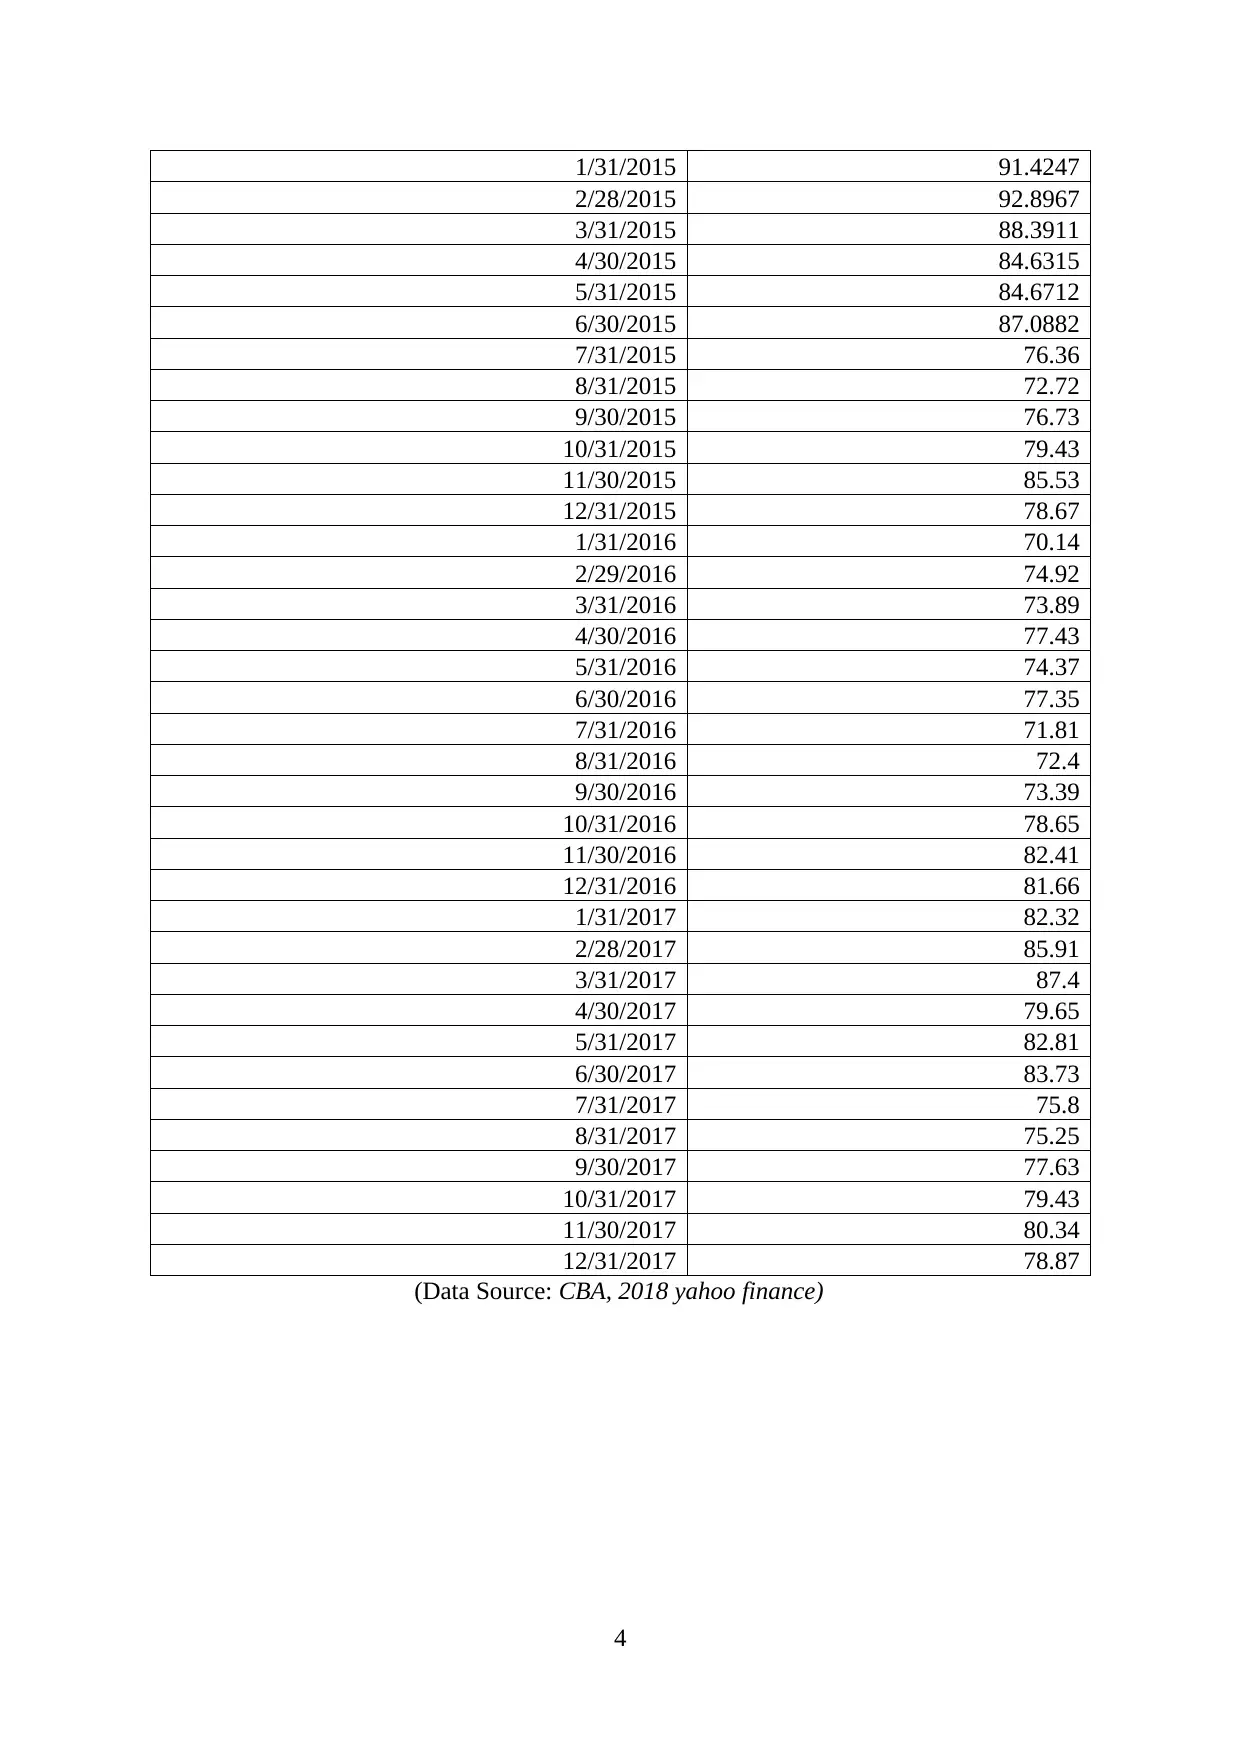
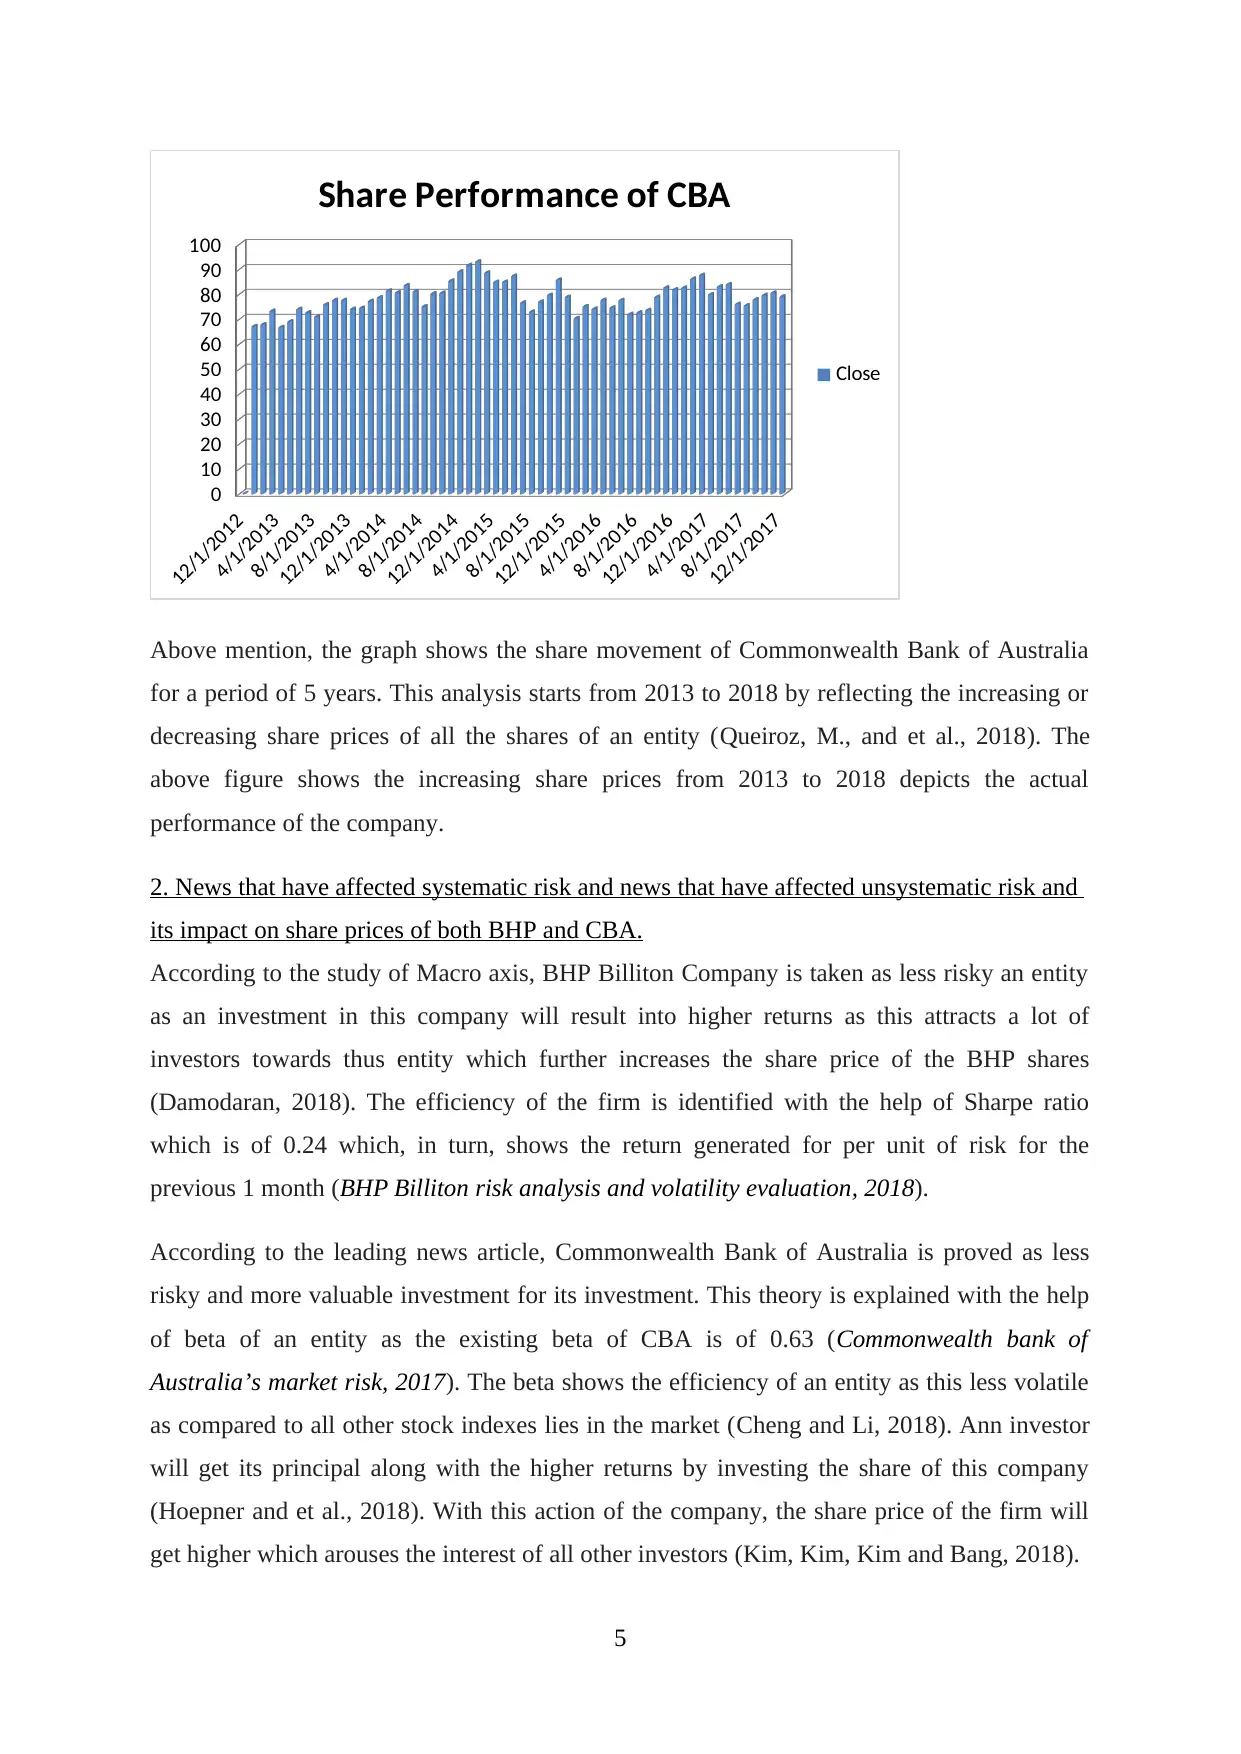
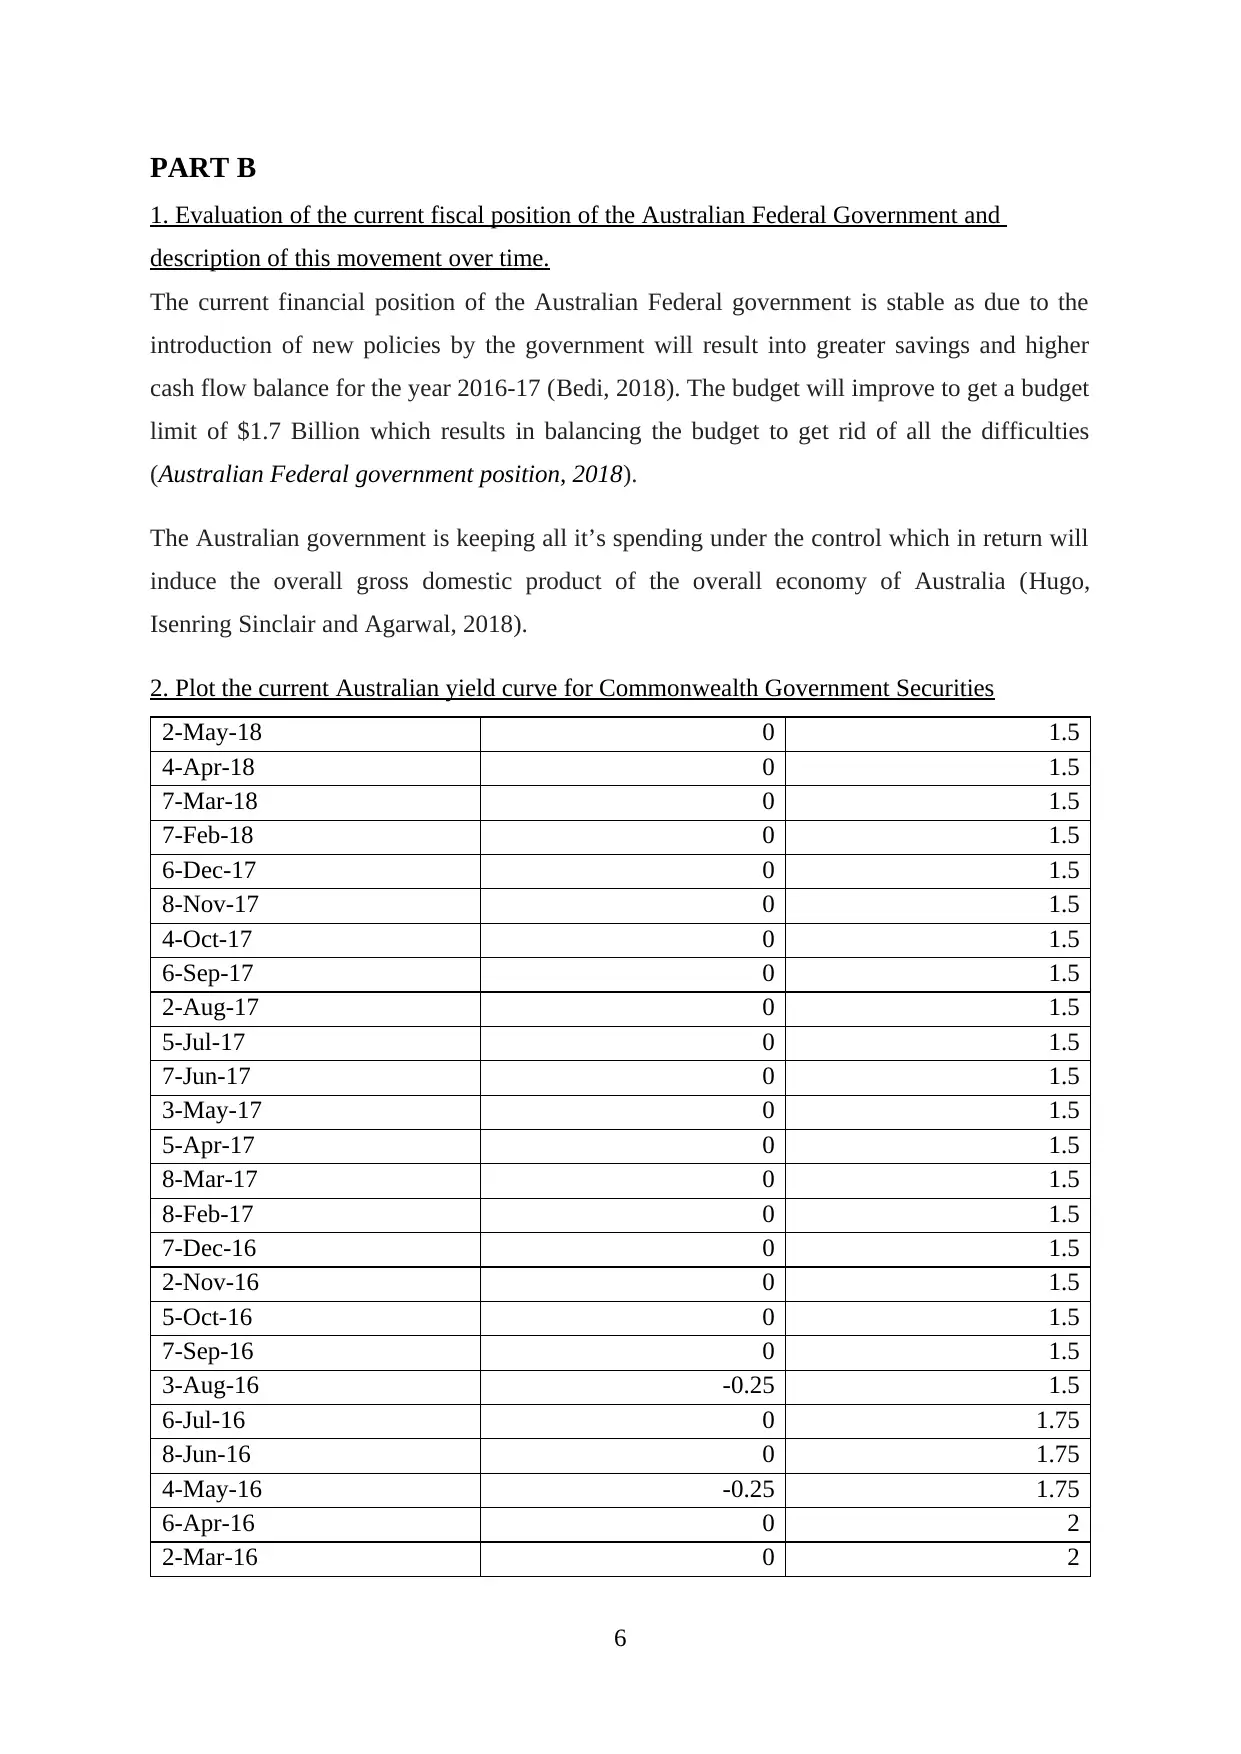
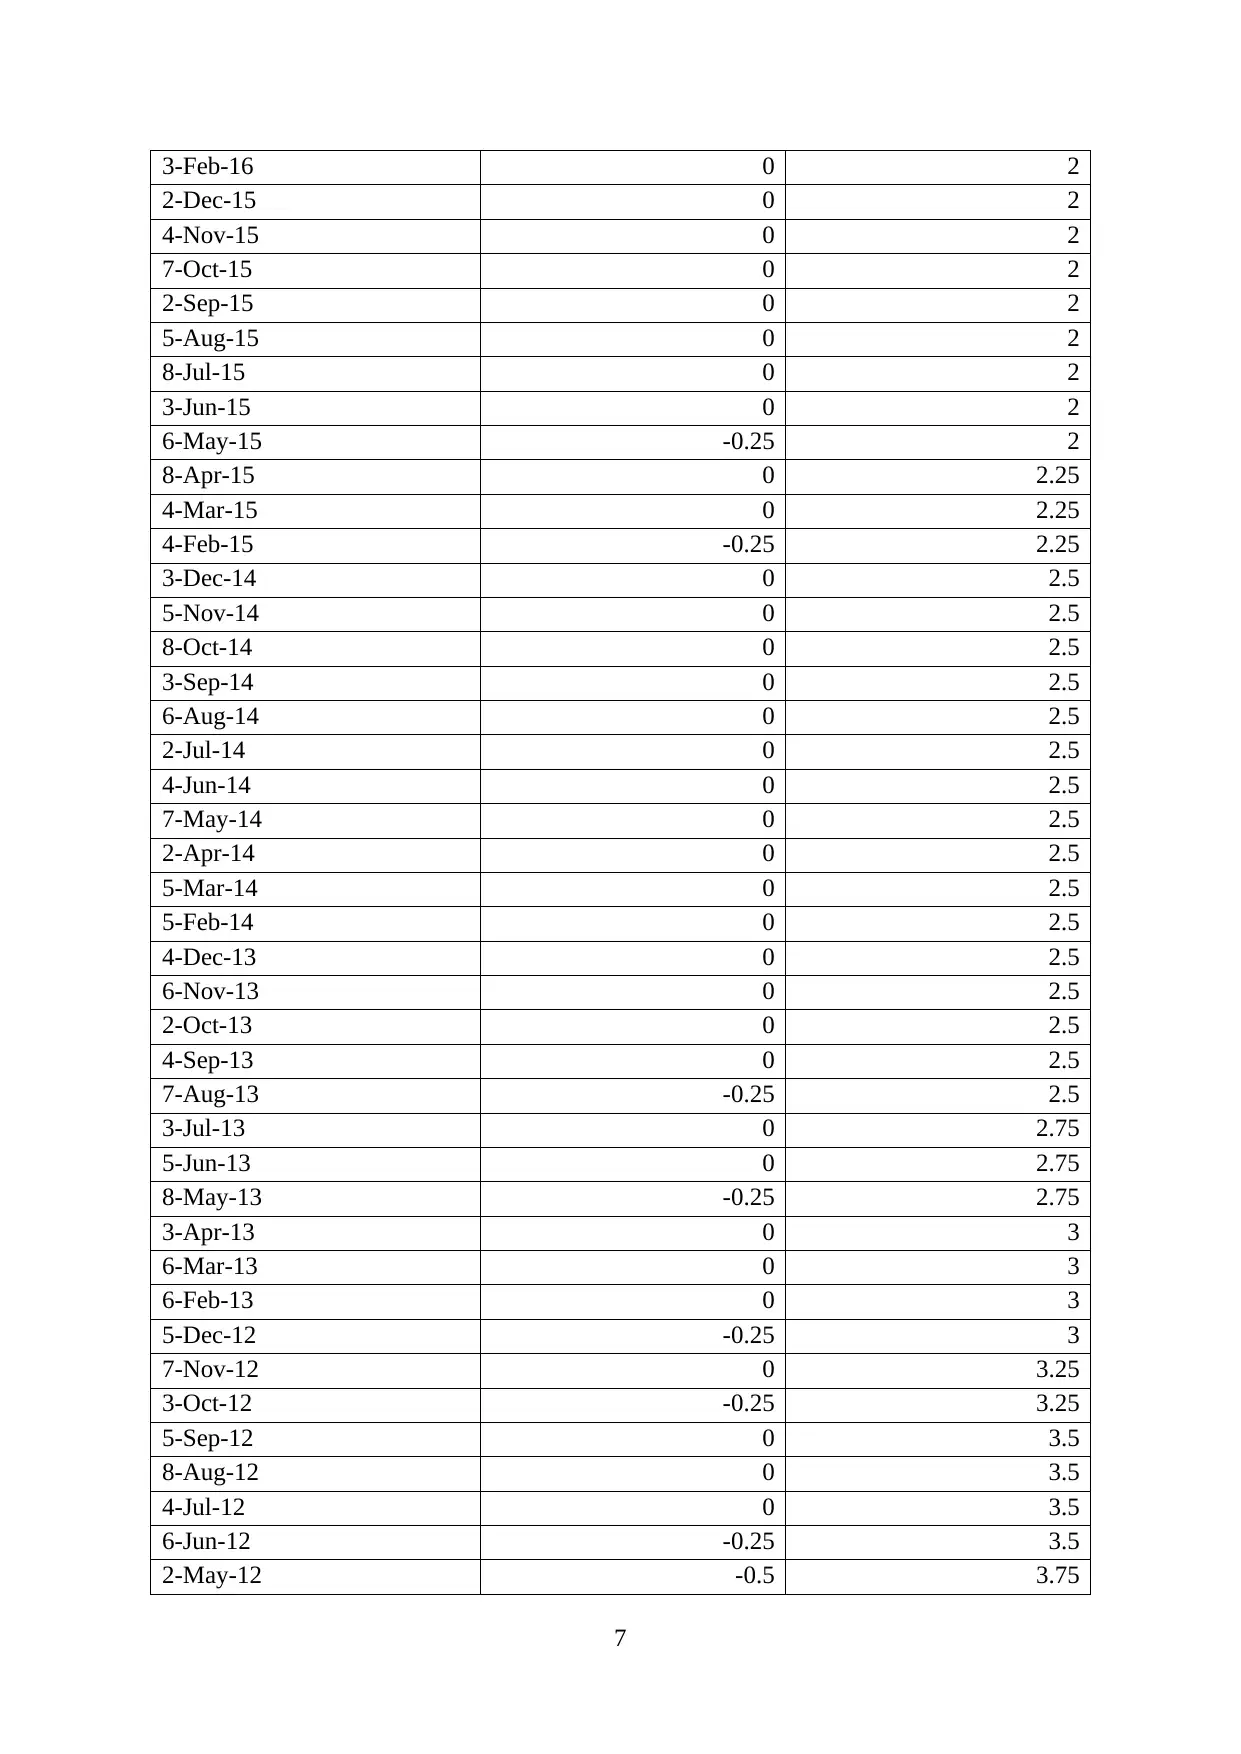
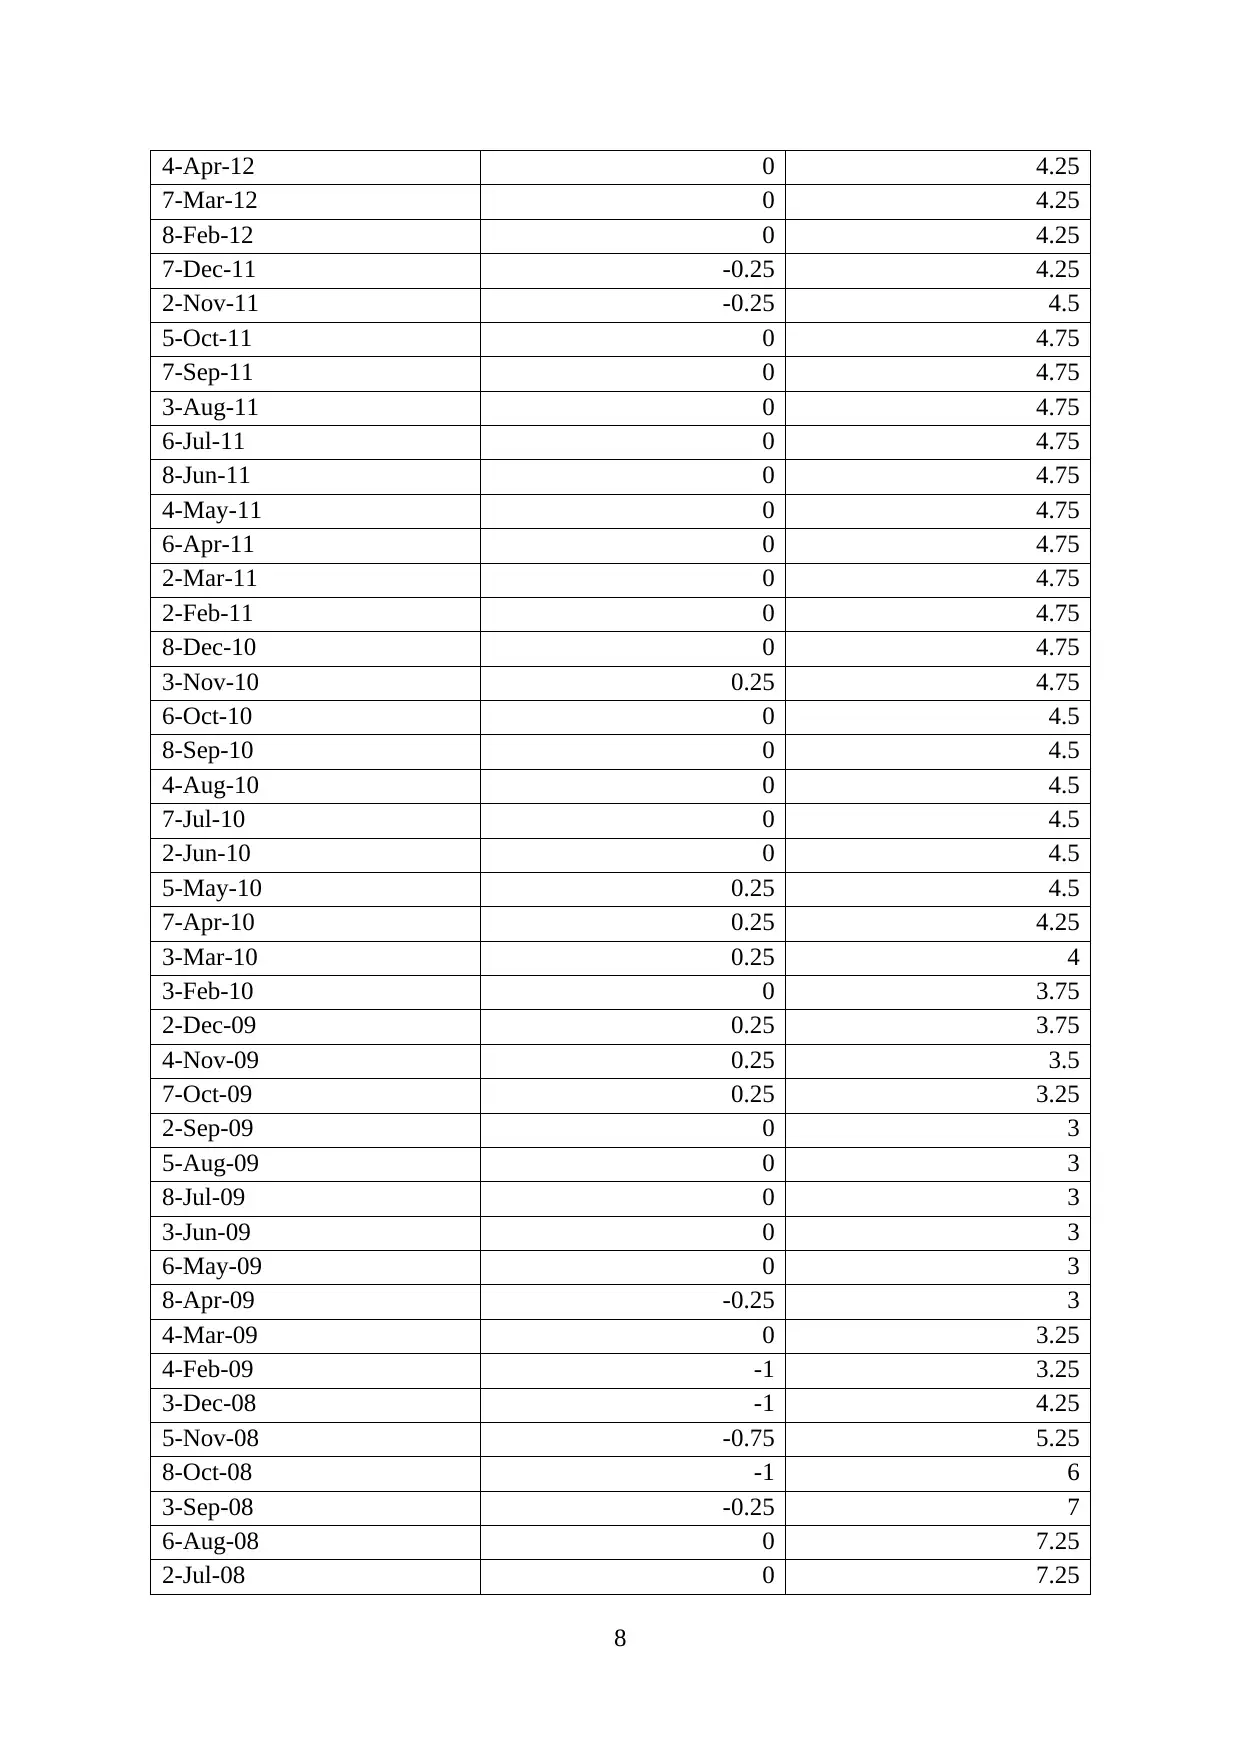
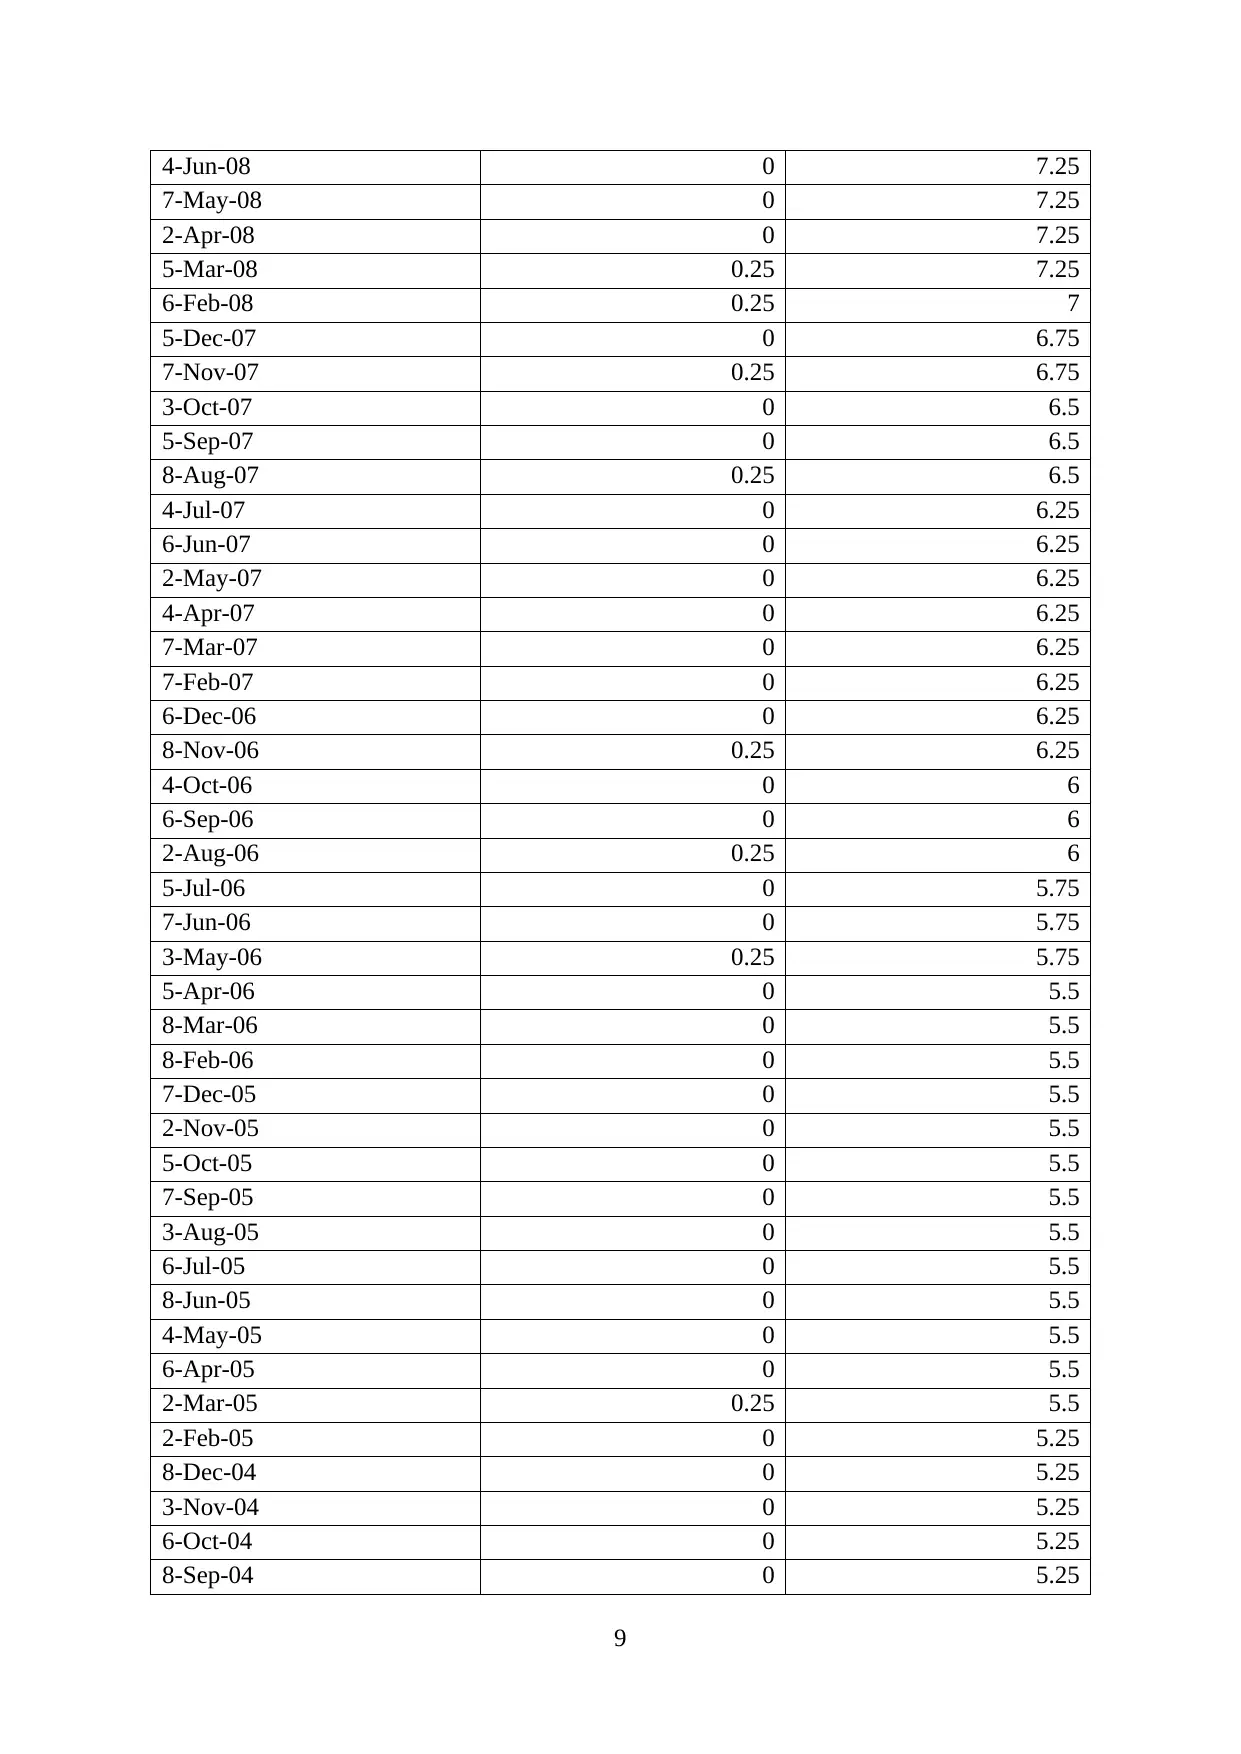
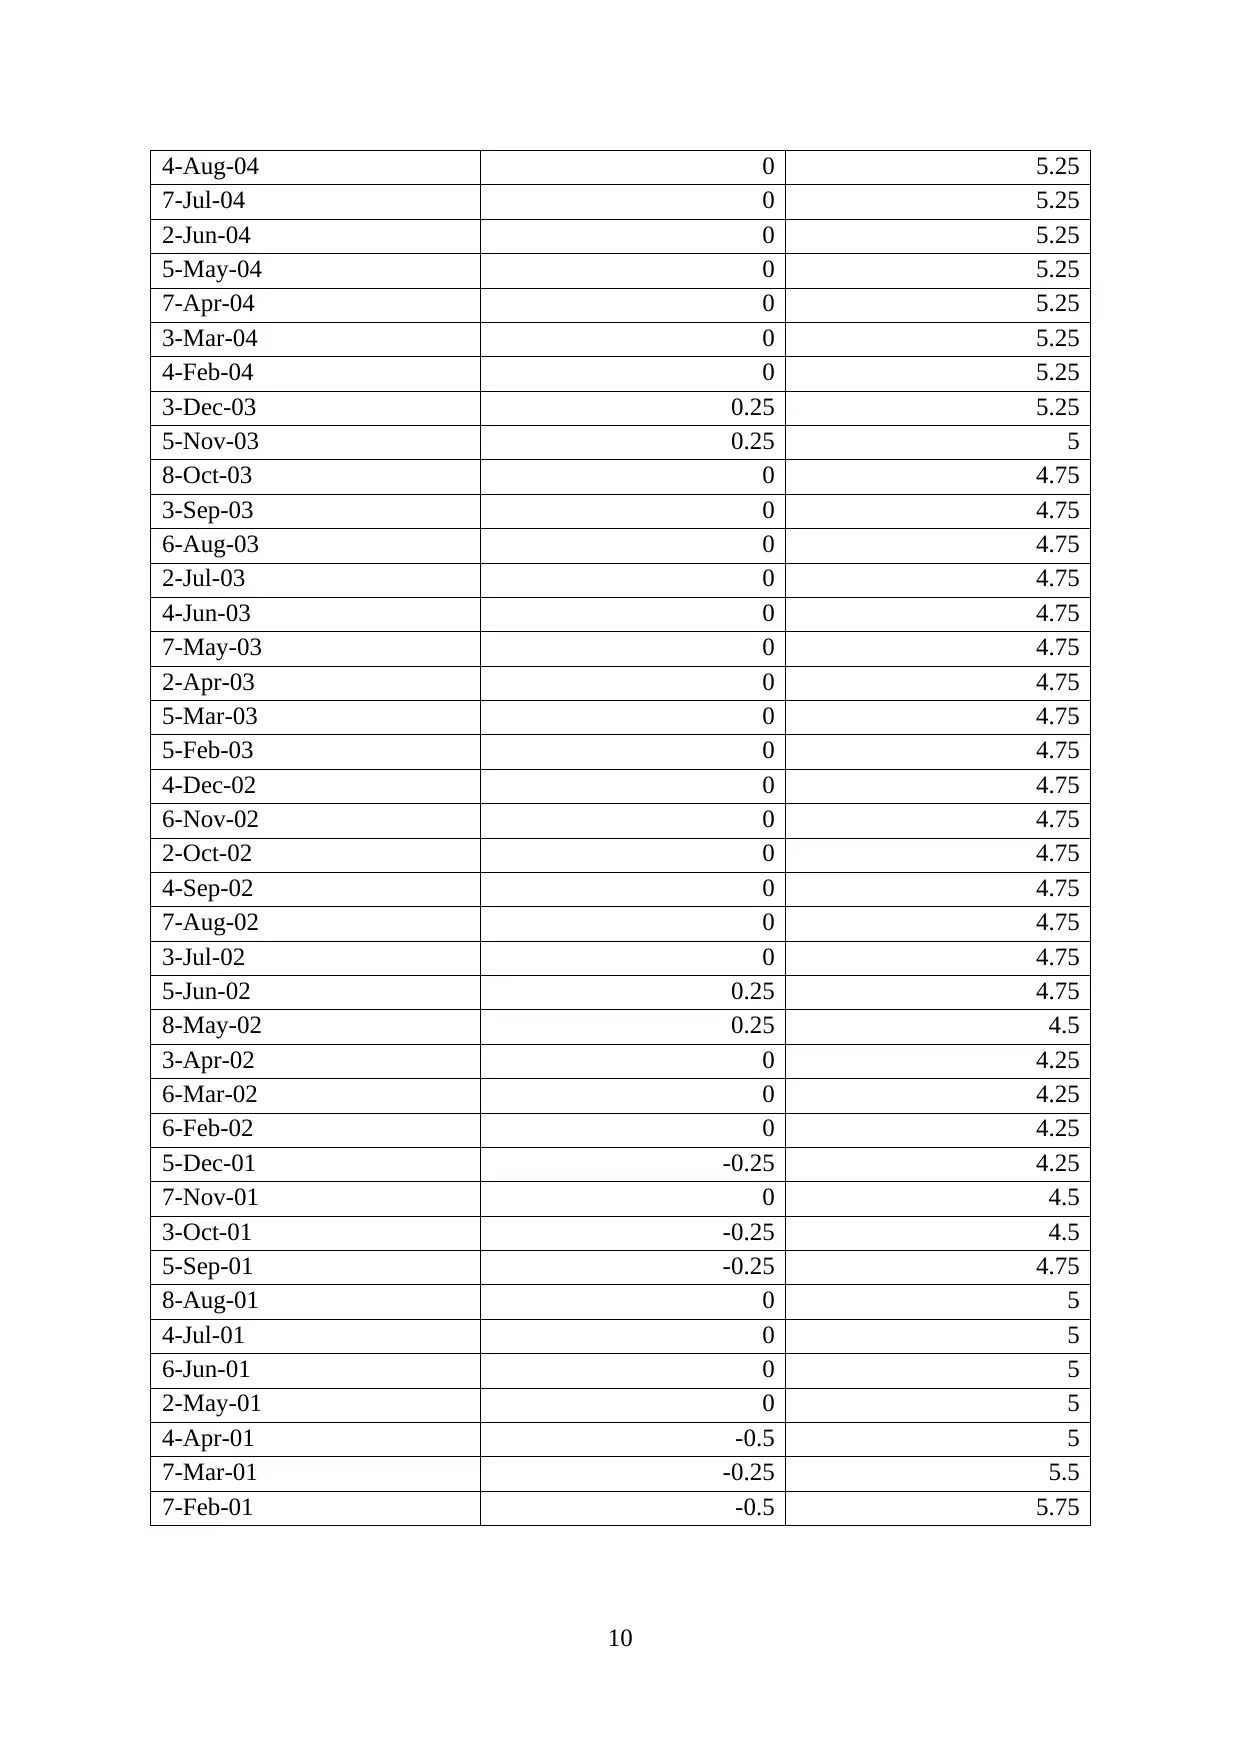
This report provides an analysis of the share prices of BHP and CBA over the past 5 years, examining the impact of systematic and unsystematic risks on their stock performance. It evaluates the current fiscal position of the Australian Federal Government, describing its movement over time and plotting the current Australian yield curve for Commonwealth Government Securities (CGSs). The report explains the shape of the yield curve using Expectations Theory and Segmented Markets Theory, and discusses the influence of movements in the fiscal position on the yield curve. Furthermore, it describes the movements in the target cash rate from 2001 to 2017 and its influence on the value of the Australian dollar in the foreign exchange market. The analysis includes relevant data and references to support its findings.
Document Page
BANKING AND FINANCE
TABLE OF CONTENT
tabler-icon-diamond-filled.svg

Paraphrase This Document

Need a fresh take? Get an instant paraphrase of this document with our AI Paraphraser
Document Page
S
PART A......................................................................................................................................1
1. The current price of ordinary / common shares in BHP and CBA and evolvement of each
over the past 5-years...............................................................................................................1
2. News that have affected systematic risk and news that have affected unsystematic risk
and its impact on share prices of both BHP and CBA...........................................................5
PART B......................................................................................................................................6
1. Evaluation of the current fiscal position of the Australian Federal Government and
description of this movement over time.................................................................................6
2. Plot the current Australian yield curve for Commonwealth Government Securities.........6
2. The current Australian yield curve for Commonwealth Government Securities (CGSs) 11
a) Explanation of the shape of the yield curve, using Expectations Theory and the
Segmented Markets Theory..............................................................................................11
b) Influence of movements in the fiscal position identified above to influence the yield
curve..................................................................................................................................11
3. Description of the movements in the target cash rate from 2001 to 2017 influence of
movements in the cash rate on the value of the Australian dollar in the foreign exchange
market...................................................................................................................................12
REFERENCES.........................................................................................................................13
Document Page
PART A
1. The current price of ordinary / common shares in BHP and CBA and evolvement of each
over the past 5-years
The current price of ordinary shares in BHP is $51.36 (BHP Ltd, 2018) and of CBA is
$70.77(CBA, 2018)
Date Close
1-Apr-18 46.75
8-Mar-18 0
1-Mar-18 44.43
1-Feb-18 46.5
1-Jan-18 49.02
1-Dec-17 45.99
1-Nov-17 41.55
1-Oct-17 40.98
7-Sep-17 0
1-Sep-17 40.53
1-Aug-17 43.5
1-Jul-17 41.66
1-Jun-17 35.59
1-May-17 35.09
1-Apr-17 35.6
8-Mar-17 0
1-Mar-17 36.32
1-Feb-17 37.82
1-Jan-17 41.29
1-Dec-16 35.78
1-Nov-16 37.54
1-Oct-16 35.02
1-Sep-16 34.65
31-Aug-16 0
1-Aug-16 30
1-Jul-16 29.69
1-Jun-16 28.56
1-May-16 26.97
1-Apr-16 31.34
9-Mar-16 0
1-Mar-16 25.9
1-Feb-16 22.61
1-Jan-16 21.91
1-Dec-15 25.76
1-Nov-15 26.68
1
Document Page
1-Oct-15 32.89
9-Sep-15 0
1-Sep-15 31.62
1-Aug-15 36.83
1-Jul-15 38.37
1-Jun-15 40.71
1-May-15 44.63
1-Apr-15 51.29
11-Mar-15 0
1-Mar-15 46.47
1-Feb-15 52.52
1-Jan-15 46.33
1-Dec-14 47.32
1-Nov-14 51.63
1-Oct-14 59.44
3-Sep-14 0
1-Sep-14 58.88
1-Aug-14 68.63
1-Jul-14 71.09
1-Jun-14 68.45
1-May-14 67.88
1-Apr-14 70.54
5-Mar-14 0
1-Mar-14 67.77
1-Feb-14 68.9
1-Jan-14 63.95
1-Dec-13 68.2
1-Nov-13 68.22
1-Oct-13 70.69
4-Sep-13 0
1-Sep-13 66.5
1-Aug-13 63.28
1-Jul-13 62.73
1-Jun-13 57.66
1-May-13 65.32
1-Apr-13 67.22
6-Mar-13 0
1-Mar-13 68.43
1-Feb-13 74.86
(Data Source: BHP Ltd, 2018 from Yahoo finance)
2
tabler-icon-diamond-filled.svg

Paraphrase This Document

Need a fresh take? Get an instant paraphrase of this document with our AI Paraphraser
Document Page
1-Feb-13
17-May-13
30-Aug-13
13-Dec-13
28-Mar-14
11-Jul-14
24-Oct-14
6-Feb-15
22-May-15
4-Sep-15
18-Dec-15
1-Apr-16
15-Jul-16
28-Oct-16
10-Feb-17
26-May-17
8-Sep-17
22-Dec-17
0
10
20
30
40
50
60
70
80
Share performance of BHP
Close
Share performance of BHP is fluctuating as the trend is first declining and again gets
increases as this shows the market fluctuations of this company (Edeling and Himme, 2018).
BHP is required to improve its current position to get rid of the market complexities.
Date Close
12/31/2012 0
1/31/2013 66.9075
2/28/2013 67.6435
3/31/2013 73.0542
4/30/2013 66.4997
5/31/2013 68.8072
6/30/2013 73.8101
7/31/2013 72.4475
8/31/2013 70.8263
9/30/2013 75.67
10/31/2013 77.4006
11/30/2013 77.3808
12/31/2013 73.83
1/31/2014 74.2577
2/28/2014 77.0227
3/31/2014 78.4748
4/30/2014 81.1503
5/31/2014 80.4442
6/30/2014 83.2987
7/31/2014 80.8818
8/31/2014 74.8843
9/30/2014 80.0463
10/31/2014 80.285
11/30/2014 85.1885
12/31/2014 88.8486
3
Document Page
1/31/2015 91.4247
2/28/2015 92.8967
3/31/2015 88.3911
4/30/2015 84.6315
5/31/2015 84.6712
6/30/2015 87.0882
7/31/2015 76.36
8/31/2015 72.72
9/30/2015 76.73
10/31/2015 79.43
11/30/2015 85.53
12/31/2015 78.67
1/31/2016 70.14
2/29/2016 74.92
3/31/2016 73.89
4/30/2016 77.43
5/31/2016 74.37
6/30/2016 77.35
7/31/2016 71.81
8/31/2016 72.4
9/30/2016 73.39
10/31/2016 78.65
11/30/2016 82.41
12/31/2016 81.66
1/31/2017 82.32
2/28/2017 85.91
3/31/2017 87.4
4/30/2017 79.65
5/31/2017 82.81
6/30/2017 83.73
7/31/2017 75.8
8/31/2017 75.25
9/30/2017 77.63
10/31/2017 79.43
11/30/2017 80.34
12/31/2017 78.87
(Data Source: CBA, 2018 yahoo finance)
4
Document Page
12/1/2012
4/1/2013
8/1/2013
12/1/2013
4/1/2014
8/1/2014
12/1/2014
4/1/2015
8/1/2015
12/1/2015
4/1/2016
8/1/2016
12/1/2016
4/1/2017
8/1/2017
12/1/2017
0
10
20
30
40
50
60
70
80
90
100
Share Performance of CBA
Close
Above mention, the graph shows the share movement of Commonwealth Bank of Australia
for a period of 5 years. This analysis starts from 2013 to 2018 by reflecting the increasing or
decreasing share prices of all the shares of an entity (Queiroz, M., and et al., 2018). The
above figure shows the increasing share prices from 2013 to 2018 depicts the actual
performance of the company.
2. News that have affected systematic risk and news that have affected unsystematic risk and
its impact on share prices of both BHP and CBA.
According to the study of Macro axis, BHP Billiton Company is taken as less risky an entity
as an investment in this company will result into higher returns as this attracts a lot of
investors towards thus entity which further increases the share price of the BHP shares
(Damodaran, 2018). The efficiency of the firm is identified with the help of Sharpe ratio
which is of 0.24 which, in turn, shows the return generated for per unit of risk for the
previous 1 month (BHP Billiton risk analysis and volatility evaluation, 2018).
According to the leading news article, Commonwealth Bank of Australia is proved as less
risky and more valuable investment for its investment. This theory is explained with the help
of beta of an entity as the existing beta of CBA is of 0.63 (Commonwealth bank of
Australia’s market risk, 2017). The beta shows the efficiency of an entity as this less volatile
as compared to all other stock indexes lies in the market (Cheng and Li, 2018). Ann investor
will get its principal along with the higher returns by investing the share of this company
(Hoepner and et al., 2018). With this action of the company, the share price of the firm will
get higher which arouses the interest of all other investors (Kim, Kim, Kim and Bang, 2018).
5
tabler-icon-diamond-filled.svg

Paraphrase This Document

Need a fresh take? Get an instant paraphrase of this document with our AI Paraphraser
Document Page
PART B
1. Evaluation of the current fiscal position of the Australian Federal Government and
description of this movement over time.
The current financial position of the Australian Federal government is stable as due to the
introduction of new policies by the government will result into greater savings and higher
cash flow balance for the year 2016-17 (Bedi, 2018). The budget will improve to get a budget
limit of $1.7 Billion which results in balancing the budget to get rid of all the difficulties
(Australian Federal government position, 2018).
The Australian government is keeping all it’s spending under the control which in return will
induce the overall gross domestic product of the overall economy of Australia (Hugo,
Isenring Sinclair and Agarwal, 2018).
2. Plot the current Australian yield curve for Commonwealth Government Securities
2-May-18 0 1.5
4-Apr-18 0 1.5
7-Mar-18 0 1.5
7-Feb-18 0 1.5
6-Dec-17 0 1.5
8-Nov-17 0 1.5
4-Oct-17 0 1.5
6-Sep-17 0 1.5
2-Aug-17 0 1.5
5-Jul-17 0 1.5
7-Jun-17 0 1.5
3-May-17 0 1.5
5-Apr-17 0 1.5
8-Mar-17 0 1.5
8-Feb-17 0 1.5
7-Dec-16 0 1.5
2-Nov-16 0 1.5
5-Oct-16 0 1.5
7-Sep-16 0 1.5
3-Aug-16 -0.25 1.5
6-Jul-16 0 1.75
8-Jun-16 0 1.75
4-May-16 -0.25 1.75
6-Apr-16 0 2
2-Mar-16 0 2
6
Document Page
3-Feb-16 0 2
2-Dec-15 0 2
4-Nov-15 0 2
7-Oct-15 0 2
2-Sep-15 0 2
5-Aug-15 0 2
8-Jul-15 0 2
3-Jun-15 0 2
6-May-15 -0.25 2
8-Apr-15 0 2.25
4-Mar-15 0 2.25
4-Feb-15 -0.25 2.25
3-Dec-14 0 2.5
5-Nov-14 0 2.5
8-Oct-14 0 2.5
3-Sep-14 0 2.5
6-Aug-14 0 2.5
2-Jul-14 0 2.5
4-Jun-14 0 2.5
7-May-14 0 2.5
2-Apr-14 0 2.5
5-Mar-14 0 2.5
5-Feb-14 0 2.5
4-Dec-13 0 2.5
6-Nov-13 0 2.5
2-Oct-13 0 2.5
4-Sep-13 0 2.5
7-Aug-13 -0.25 2.5
3-Jul-13 0 2.75
5-Jun-13 0 2.75
8-May-13 -0.25 2.75
3-Apr-13 0 3
6-Mar-13 0 3
6-Feb-13 0 3
5-Dec-12 -0.25 3
7-Nov-12 0 3.25
3-Oct-12 -0.25 3.25
5-Sep-12 0 3.5
8-Aug-12 0 3.5
4-Jul-12 0 3.5
6-Jun-12 -0.25 3.5
2-May-12 -0.5 3.75
7
Document Page
4-Apr-12 0 4.25
7-Mar-12 0 4.25
8-Feb-12 0 4.25
7-Dec-11 -0.25 4.25
2-Nov-11 -0.25 4.5
5-Oct-11 0 4.75
7-Sep-11 0 4.75
3-Aug-11 0 4.75
6-Jul-11 0 4.75
8-Jun-11 0 4.75
4-May-11 0 4.75
6-Apr-11 0 4.75
2-Mar-11 0 4.75
2-Feb-11 0 4.75
8-Dec-10 0 4.75
3-Nov-10 0.25 4.75
6-Oct-10 0 4.5
8-Sep-10 0 4.5
4-Aug-10 0 4.5
7-Jul-10 0 4.5
2-Jun-10 0 4.5
5-May-10 0.25 4.5
7-Apr-10 0.25 4.25
3-Mar-10 0.25 4
3-Feb-10 0 3.75
2-Dec-09 0.25 3.75
4-Nov-09 0.25 3.5
7-Oct-09 0.25 3.25
2-Sep-09 0 3
5-Aug-09 0 3
8-Jul-09 0 3
3-Jun-09 0 3
6-May-09 0 3
8-Apr-09 -0.25 3
4-Mar-09 0 3.25
4-Feb-09 -1 3.25
3-Dec-08 -1 4.25
5-Nov-08 -0.75 5.25
8-Oct-08 -1 6
3-Sep-08 -0.25 7
6-Aug-08 0 7.25
2-Jul-08 0 7.25
8
tabler-icon-diamond-filled.svg

Paraphrase This Document

Need a fresh take? Get an instant paraphrase of this document with our AI Paraphraser
Document Page
4-Jun-08 0 7.25
7-May-08 0 7.25
2-Apr-08 0 7.25
5-Mar-08 0.25 7.25
6-Feb-08 0.25 7
5-Dec-07 0 6.75
7-Nov-07 0.25 6.75
3-Oct-07 0 6.5
5-Sep-07 0 6.5
8-Aug-07 0.25 6.5
4-Jul-07 0 6.25
6-Jun-07 0 6.25
2-May-07 0 6.25
4-Apr-07 0 6.25
7-Mar-07 0 6.25
7-Feb-07 0 6.25
6-Dec-06 0 6.25
8-Nov-06 0.25 6.25
4-Oct-06 0 6
6-Sep-06 0 6
2-Aug-06 0.25 6
5-Jul-06 0 5.75
7-Jun-06 0 5.75
3-May-06 0.25 5.75
5-Apr-06 0 5.5
8-Mar-06 0 5.5
8-Feb-06 0 5.5
7-Dec-05 0 5.5
2-Nov-05 0 5.5
5-Oct-05 0 5.5
7-Sep-05 0 5.5
3-Aug-05 0 5.5
6-Jul-05 0 5.5
8-Jun-05 0 5.5
4-May-05 0 5.5
6-Apr-05 0 5.5
2-Mar-05 0.25 5.5
2-Feb-05 0 5.25
8-Dec-04 0 5.25
3-Nov-04 0 5.25
6-Oct-04 0 5.25
8-Sep-04 0 5.25
9
Document Page
4-Aug-04 0 5.25
7-Jul-04 0 5.25
2-Jun-04 0 5.25
5-May-04 0 5.25
7-Apr-04 0 5.25
3-Mar-04 0 5.25
4-Feb-04 0 5.25
3-Dec-03 0.25 5.25
5-Nov-03 0.25 5
8-Oct-03 0 4.75
3-Sep-03 0 4.75
6-Aug-03 0 4.75
2-Jul-03 0 4.75
4-Jun-03 0 4.75
7-May-03 0 4.75
2-Apr-03 0 4.75
5-Mar-03 0 4.75
5-Feb-03 0 4.75
4-Dec-02 0 4.75
6-Nov-02 0 4.75
2-Oct-02 0 4.75
4-Sep-02 0 4.75
7-Aug-02 0 4.75
3-Jul-02 0 4.75
5-Jun-02 0.25 4.75
8-May-02 0.25 4.5
3-Apr-02 0 4.25
6-Mar-02 0 4.25
6-Feb-02 0 4.25
5-Dec-01 -0.25 4.25
7-Nov-01 0 4.5
3-Oct-01 -0.25 4.5
5-Sep-01 -0.25 4.75
8-Aug-01 0 5
4-Jul-01 0 5
6-Jun-01 0 5
2-May-01 0 5
4-Apr-01 -0.5 5
7-Mar-01 -0.25 5.5
7-Feb-01 -0.5 5.75
10
chevron_up_icon
1 out of 16
circle_padding
hide_on_mobile
zoom_out_icon
[object Object]