BSBMKG511 Project: Analysing Australian Food Exports to Global Markets
VerifiedAdded on 2020/02/03
|24
|2678
|141
Project
AI Summary
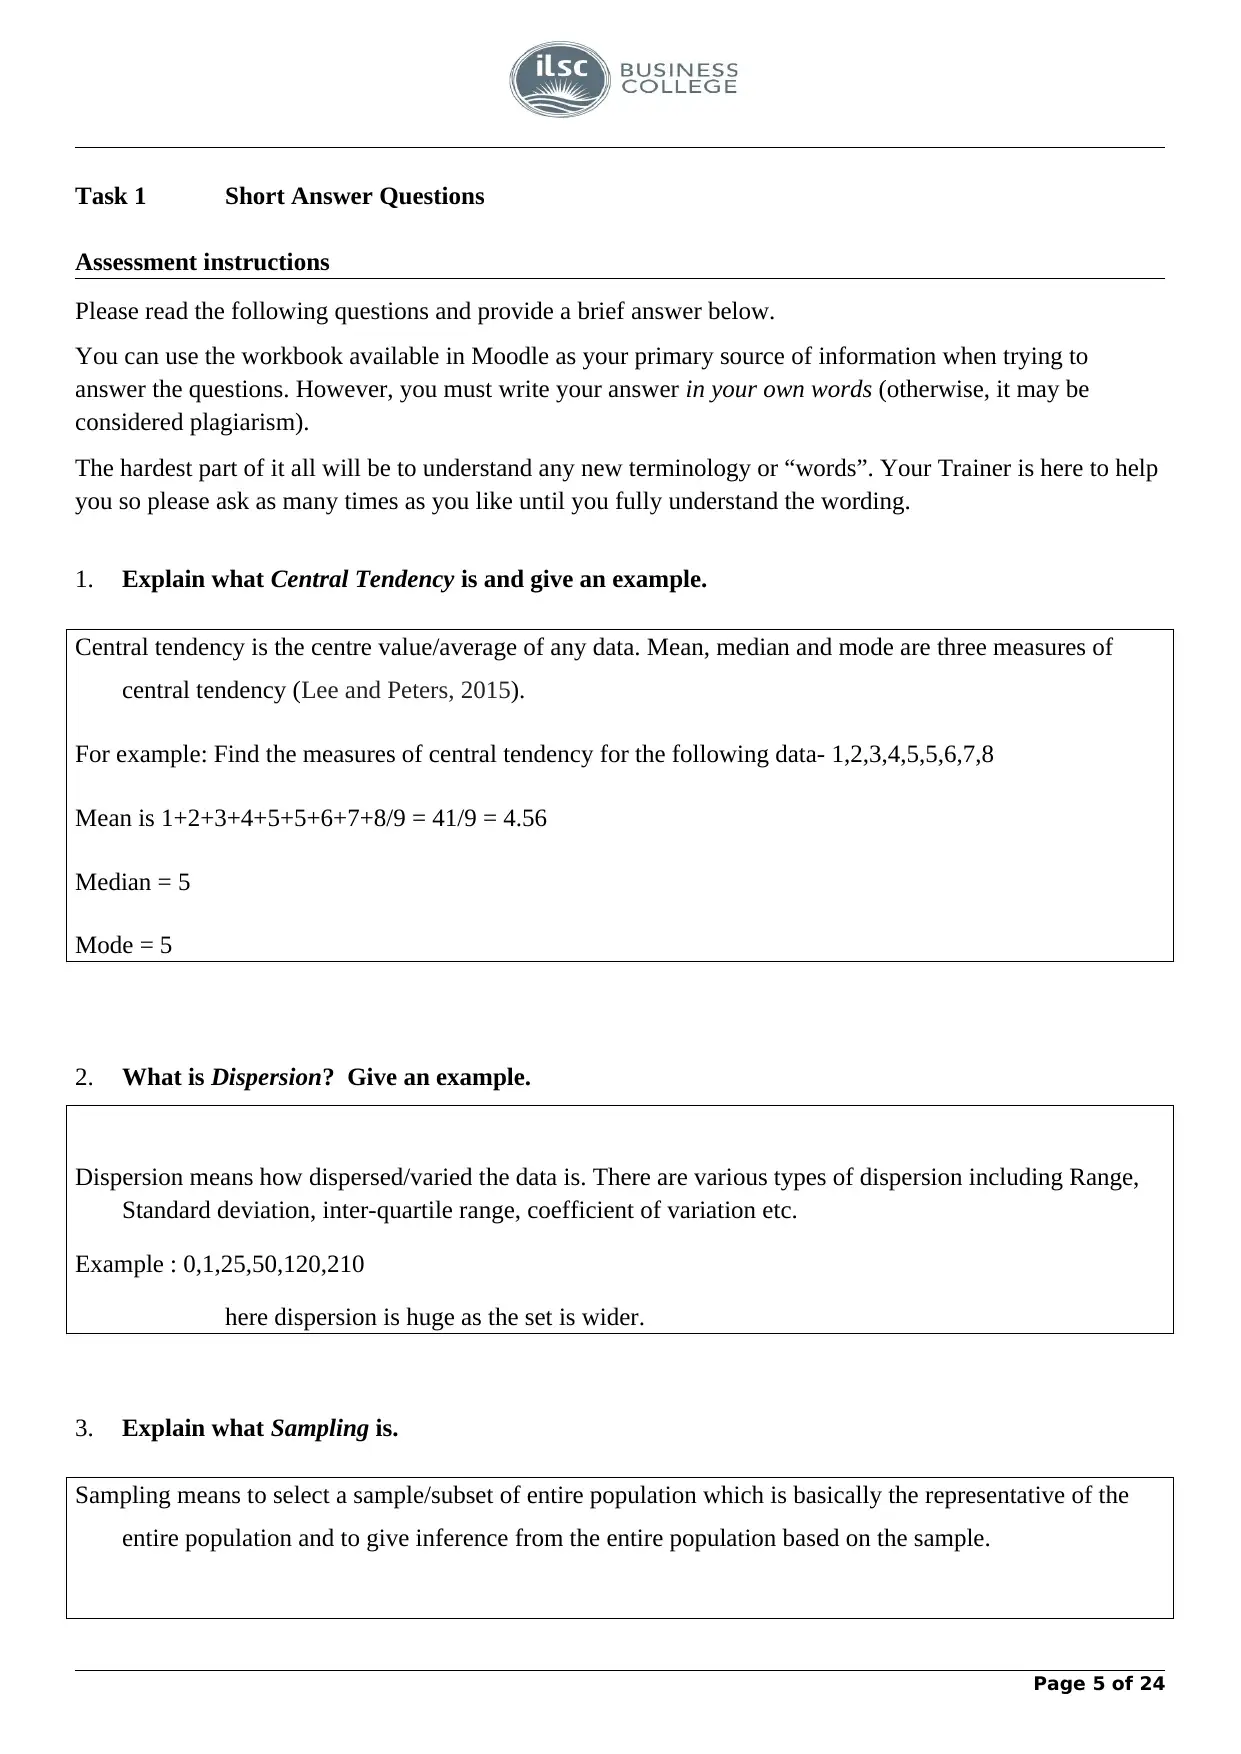
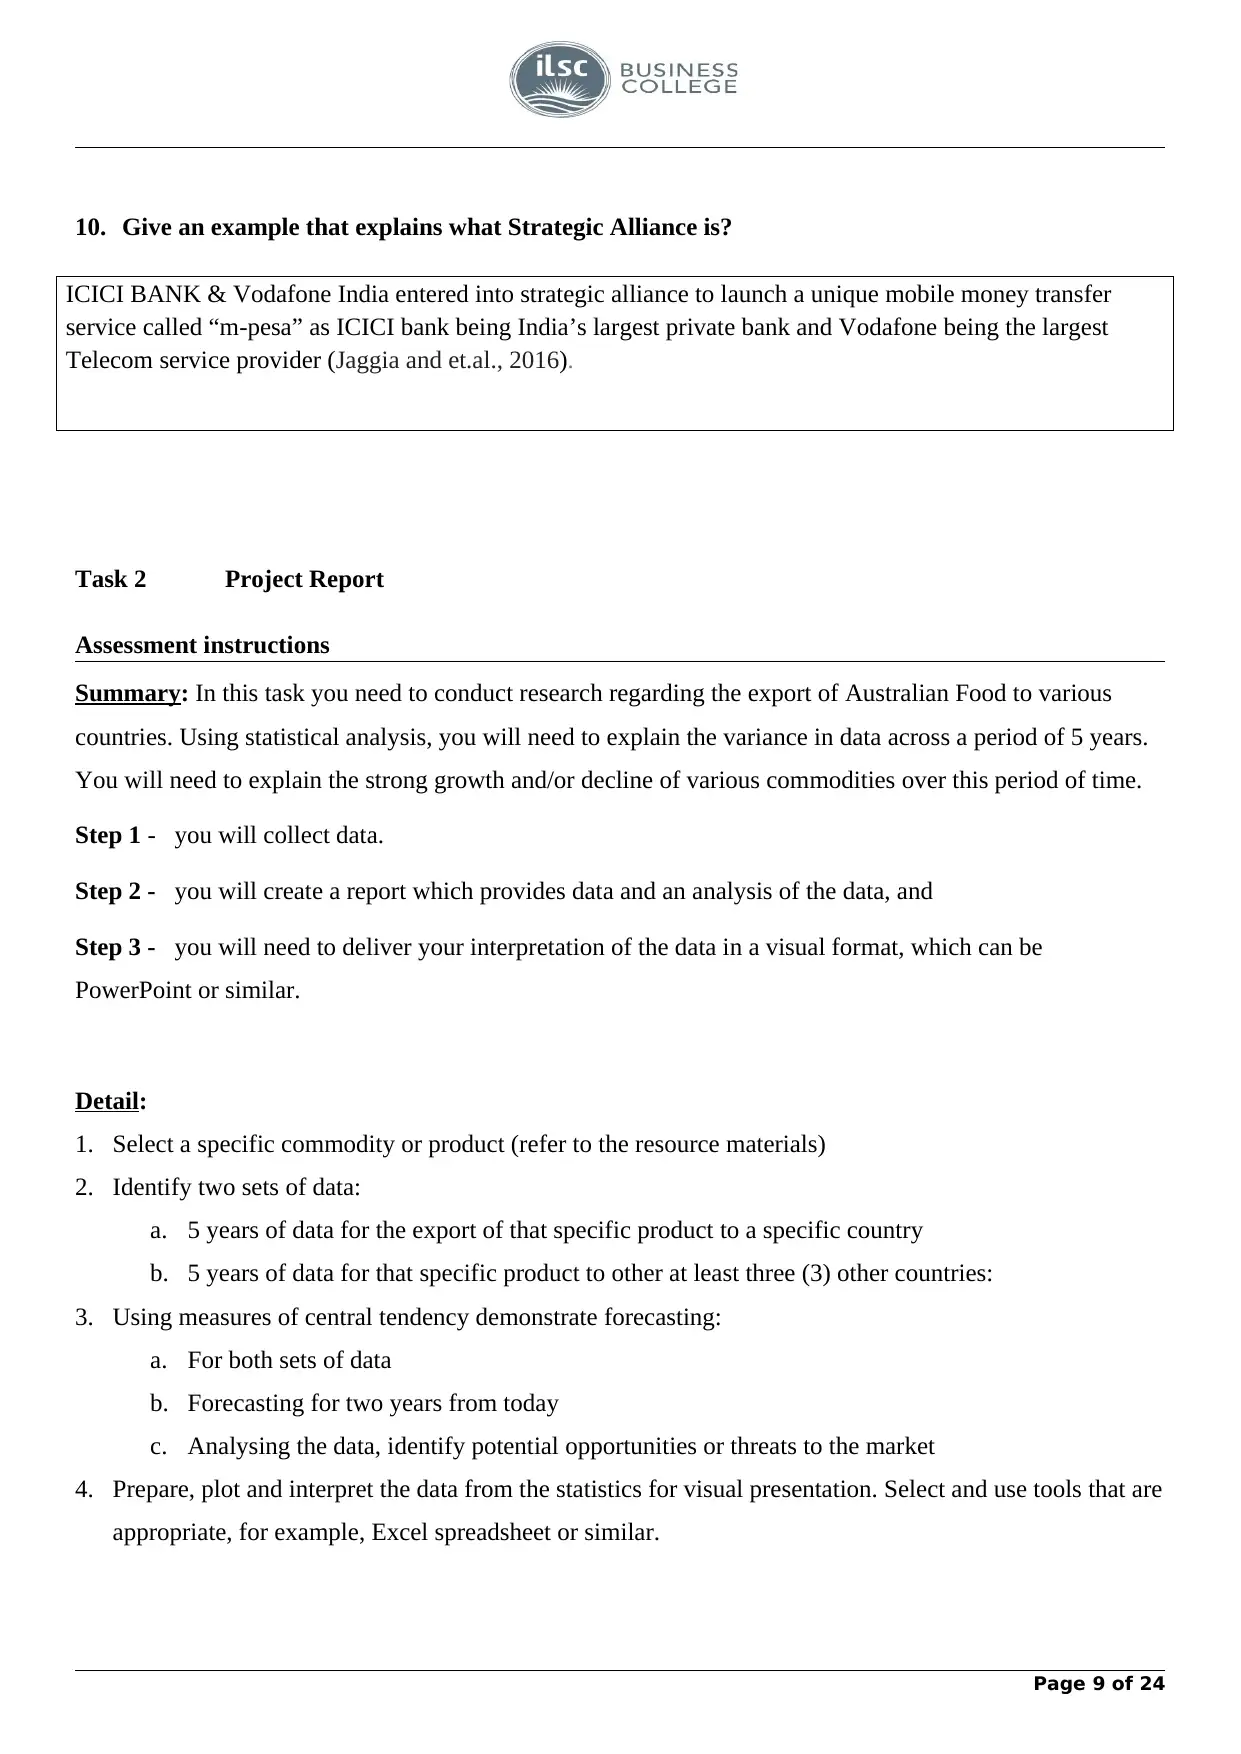
This project analyzes international market data, focusing on the export of Australian food products to various countries, specifically meat (excluding beef). The assignment involves two main tasks: short answer questions covering topics like central tendency, dispersion, sampling, PEST analysis, and cultural aspects in data analysis, and a project report. The project report requires collecting and analyzing five years of export data for a selected product to Algeria and at least three other countries. The analysis includes calculating measures of central tendency, forecasting future trends, and presenting the data visually using graphs and tables. The report also addresses potential market opportunities and threats, providing a comprehensive overview of the export market dynamics. The student has provided the data, calculations, and interpretations to fulfill the project requirements.

☐
BSBMKG511 Analyse data from
International markets
Note to Student: You are required to complete all areas of this Assessment Cover sheet where
coloured
To achieve competency in this unit you must complete the following assessment items. All tasks must be
submitted together. Tick the boxes to show that each task is attached.
Task 1. Short Answer Questions ☐
Task 2. Project Report ☐
Assessment cover sheet
Student’s name Click here to enter text. Student’s ID Click here to enter
text.
Qualification Qualification Code &
Title
Due date Click here to enter
text.
Date submitted Click here to enter
text.
Student’s declaration
Yes No
☐ ☐ I have read and understood the details of the assessment.
☐ ☐
I have been informed of the conditions of the assessment
and the appeals process and understand I may appeal if I
believe the assessment is not equitable, fair or just.
☐ ☐ I agree to participate in this assessment, and I am ready to
be assessed.
☐ ☐ I certify that the attached is my own work (or in
collaboration with other members of the group as required).
☐ ☐
I have acknowledged all sources where appropriate in
accordance with ILSC’s Academic Integrity Policy, and I
believe other group members have done the same.
Student’s signature Original Due Date
Submissi
on
Date(s)
1st
Submissi
on
Date:Clic
k here to
Page 1 of 24
Paraphrase This Document
Need a fresh take? Get an instant paraphrase of this document with our AI Paraphraser

enter text.
2nd
Submissi
on
Date:Clic
k here to
enter text.
3rd
Submissi
on
Date:Clic
k here to
enter text.
Assessment (ILSC
office use only)
Competent
Trainer’s
Fees
Result
Initial & Date
1st Submission
Yes
No
_____
_____
_____
_
Late
Fee =
$50
Re-
sub
Fee
2nd Submission
Yes
No
_____
_____
_____
_
No
fee
Fee
waive
Page 2 of 24

d
3rd Submission
Yes No
_________________
Fee paid
Page 3 of 24
3rd Submission
Yes No
_________________
Fee paid
Page 3 of 24
⊘ This is a preview!⊘
Do you want full access?
Subscribe today to unlock all pages.

Trusted by 1+ million students worldwide

Comments/Feedback from assessor to student
Click here to enter text.
Missing questions/Questions to resubmit:
Click here to enter text.
Reasonable Adjustments (if any):
Click here to enter text.
RESULT
Competent
☐ Congratulations! You have addressed the outcomes of this unit and have been deemed competent.
Not Yet Competent
☐ Please see your trainer to discuss (Trainer’s name below).
☐ You will need to address the above feedback and resubmit/provide the required answers before an
assessment decision can be made.
Assessor/Trainer Name:
Assessor Checklist Initial
Authentic: The assessor is assured that the evidence presented for assessment is
the learner’s own work. Click here to enter text.
Valid: The assessor is assured that the learner has the skills, knowledge and
attributes as described in the module or unit of competency and associated
assessment requirements.
Click here to enter text.
Current: The assessor is assured that the assessment evidence demonstrates
current competency. This requires the assessment evidence to be from the
present or the very recent past.
Click here to enter text.
Sufficient: The assessor is assured that the quality, quantity and relevance of
the assessment evidence enable a judgement to be made of a learner’s
competency.
Click here to enter text.
Assessor’s name Click here to enter text. Date Click here to
enter text.
Assessor’s signature Click here to enter text.
Page 4 of 24
Click here to enter text.
Missing questions/Questions to resubmit:
Click here to enter text.
Reasonable Adjustments (if any):
Click here to enter text.
RESULT
Competent
☐ Congratulations! You have addressed the outcomes of this unit and have been deemed competent.
Not Yet Competent
☐ Please see your trainer to discuss (Trainer’s name below).
☐ You will need to address the above feedback and resubmit/provide the required answers before an
assessment decision can be made.
Assessor/Trainer Name:
Assessor Checklist Initial
Authentic: The assessor is assured that the evidence presented for assessment is
the learner’s own work. Click here to enter text.
Valid: The assessor is assured that the learner has the skills, knowledge and
attributes as described in the module or unit of competency and associated
assessment requirements.
Click here to enter text.
Current: The assessor is assured that the assessment evidence demonstrates
current competency. This requires the assessment evidence to be from the
present or the very recent past.
Click here to enter text.
Sufficient: The assessor is assured that the quality, quantity and relevance of
the assessment evidence enable a judgement to be made of a learner’s
competency.
Click here to enter text.
Assessor’s name Click here to enter text. Date Click here to
enter text.
Assessor’s signature Click here to enter text.
Page 4 of 24
Paraphrase This Document
Need a fresh take? Get an instant paraphrase of this document with our AI Paraphraser

Task 1 Short Answer Questions
Assessment instructions
Please read the following questions and provide a brief answer below.
You can use the workbook available in Moodle as your primary source of information when trying to
answer the questions. However, you must write your answer in your own words (otherwise, it may be
considered plagiarism).
The hardest part of it all will be to understand any new terminology or “words”. Your Trainer is here to help
you so please ask as many times as you like until you fully understand the wording.
1. Explain what Central Tendency is and give an example.
Central tendency is the centre value/average of any data. Mean, median and mode are three measures of
central tendency (Lee and Peters, 2015).
For example: Find the measures of central tendency for the following data- 1,2,3,4,5,5,6,7,8
Mean is 1+2+3+4+5+5+6+7+8/9 = 41/9 = 4.56
Median = 5
Mode = 5
2. What is Dispersion? Give an example.
Dispersion means how dispersed/varied the data is. There are various types of dispersion including Range,
Standard deviation, inter-quartile range, coefficient of variation etc.
Example : 0,1,25,50,120,210
here dispersion is huge as the set is wider.
3. Explain what Sampling is.
Sampling means to select a sample/subset of entire population which is basically the representative of the
entire population and to give inference from the entire population based on the sample.
Page 5 of 24

4. Explain what PEST analysis is giving a brief example of each area in the analysis.
PEST analysis is undertaken to scan the external environment which have an impact on the organisation.
POLITICAL FACTORS- tax policy, environmental policies, tariffs etc.
ECONOMIC FACTORS- inflation rates, interest rates, monetary and fiscal policies etc.
SOCIAL FACTORS- demographics, culture & values, buying patterns etc.
TECHNOLOGICAL FACTORS- research & development, automation etc.
Page 6 of 24
⊘ This is a preview!⊘
Do you want full access?
Subscribe today to unlock all pages.

Trusted by 1+ million students worldwide

5. Give three examples of what Cultural Aspects mean when analysing international data.
When analysing international data the aspects of culture are-
religions
tradition
government.
6. Create a Quantitative question…
what is the average of the following data?
5,9,11,25,32,78,92,100
7. Create a Qualitative question…
How good is the communication skills of the people working in the XYZ Telecom company?
8. Describe what Best Practice is.
When the results which are achieved are superior to other means or alternatives, then that technique is
known as best practice.
9. Explain what Benchmarking is.
Page 7 of 24
Paraphrase This Document
Need a fresh take? Get an instant paraphrase of this document with our AI Paraphraser

When a specific indicators are used to measure the performance to a set standard, is known as benchmarking
(Levine, Krehbiel and Berenson, 2013).
Page 8 of 24
(Levine, Krehbiel and Berenson, 2013).
Page 8 of 24

10. Give an example that explains what Strategic Alliance is?
ICICI BANK & Vodafone India entered into strategic alliance to launch a unique mobile money transfer
service called “m-pesa” as ICICI bank being India’s largest private bank and Vodafone being the largest
Telecom service provider (Jaggia and et.al., 2016).
Task 2 Project Report
Assessment instructions
Summary: In this task you need to conduct research regarding the export of Australian Food to various
countries. Using statistical analysis, you will need to explain the variance in data across a period of 5 years.
You will need to explain the strong growth and/or decline of various commodities over this period of time.
Step 1 - you will collect data.
Step 2 - you will create a report which provides data and an analysis of the data, and
Step 3 - you will need to deliver your interpretation of the data in a visual format, which can be
PowerPoint or similar.
Detail:
1. Select a specific commodity or product (refer to the resource materials)
2. Identify two sets of data:
a. 5 years of data for the export of that specific product to a specific country
b. 5 years of data for that specific product to other at least three (3) other countries:
3. Using measures of central tendency demonstrate forecasting:
a. For both sets of data
b. Forecasting for two years from today
c. Analysing the data, identify potential opportunities or threats to the market
4. Prepare, plot and interpret the data from the statistics for visual presentation. Select and use tools that are
appropriate, for example, Excel spreadsheet or similar.
Page 9 of 24
⊘ This is a preview!⊘
Do you want full access?
Subscribe today to unlock all pages.

Trusted by 1+ million students worldwide

5. Write a report on your findings.
a. What happened to the amount of exports of that product?
b. Why do some countries want more or less of this product?
6. The report needs to contain the following:
a. All data in a table format and properly labelled
b. Line graphs to demonstrate increases, stabilization or decreases in past years
c. Line graphs to demonstrate increases, stabilization or decreases in forecasting
d. Pie graphs demonstrating the market breakdown of different countries
e. References & Appendixes
You may upload your report as a second file to Moodle – or include it at the end of this document.
Please follow your trainer’s final directions on this.
Report format guidelines (refer to template provided):
1. Use Microsoft Word/PDF or a similar program
2. Include the following:
Title page
Contents page
Your report
References
3. Follow these general report rules as well:
Use the same font throughout the document
Use the same font size throughout the document, except for headings which are a larger font
Use both a Header and a Footer in your document
Please note: ILSC can use third party software to detect plagiarism.
YOU CAN PASTE ASSESSMENT TASK 2 (Report) BELOW THIS LINE OR UPLOAD A
SEPARATE FILE TO MOODLE.
Please see your trainer for final instructions on this.
Page 10 of 24
Paraphrase This Document
Need a fresh take? Get an instant paraphrase of this document with our AI Paraphraser

TASK 2 PROJECT REPORT
Page 11 of 24
Page 11 of 24

Select a specific commodity
Meat (excl beef), f.c.f
Page 12 of 24
Meat (excl beef), f.c.f
Page 12 of 24
⊘ This is a preview!⊘
Do you want full access?
Subscribe today to unlock all pages.

Trusted by 1+ million students worldwide
1 out of 24
Related Documents

Your All-in-One AI-Powered Toolkit for Academic Success.
+13062052269
info@desklib.com
Available 24*7 on WhatsApp / Email
Unlock your academic potential
Copyright © 2020–2025 A2Z Services. All Rights Reserved. Developed and managed by ZUCOL.