Statistical Modelling of Gender Pay Gap in Australia - Report

Verified

Added on  2021/05/31

|11
|2022
|43
Report
AI Summary
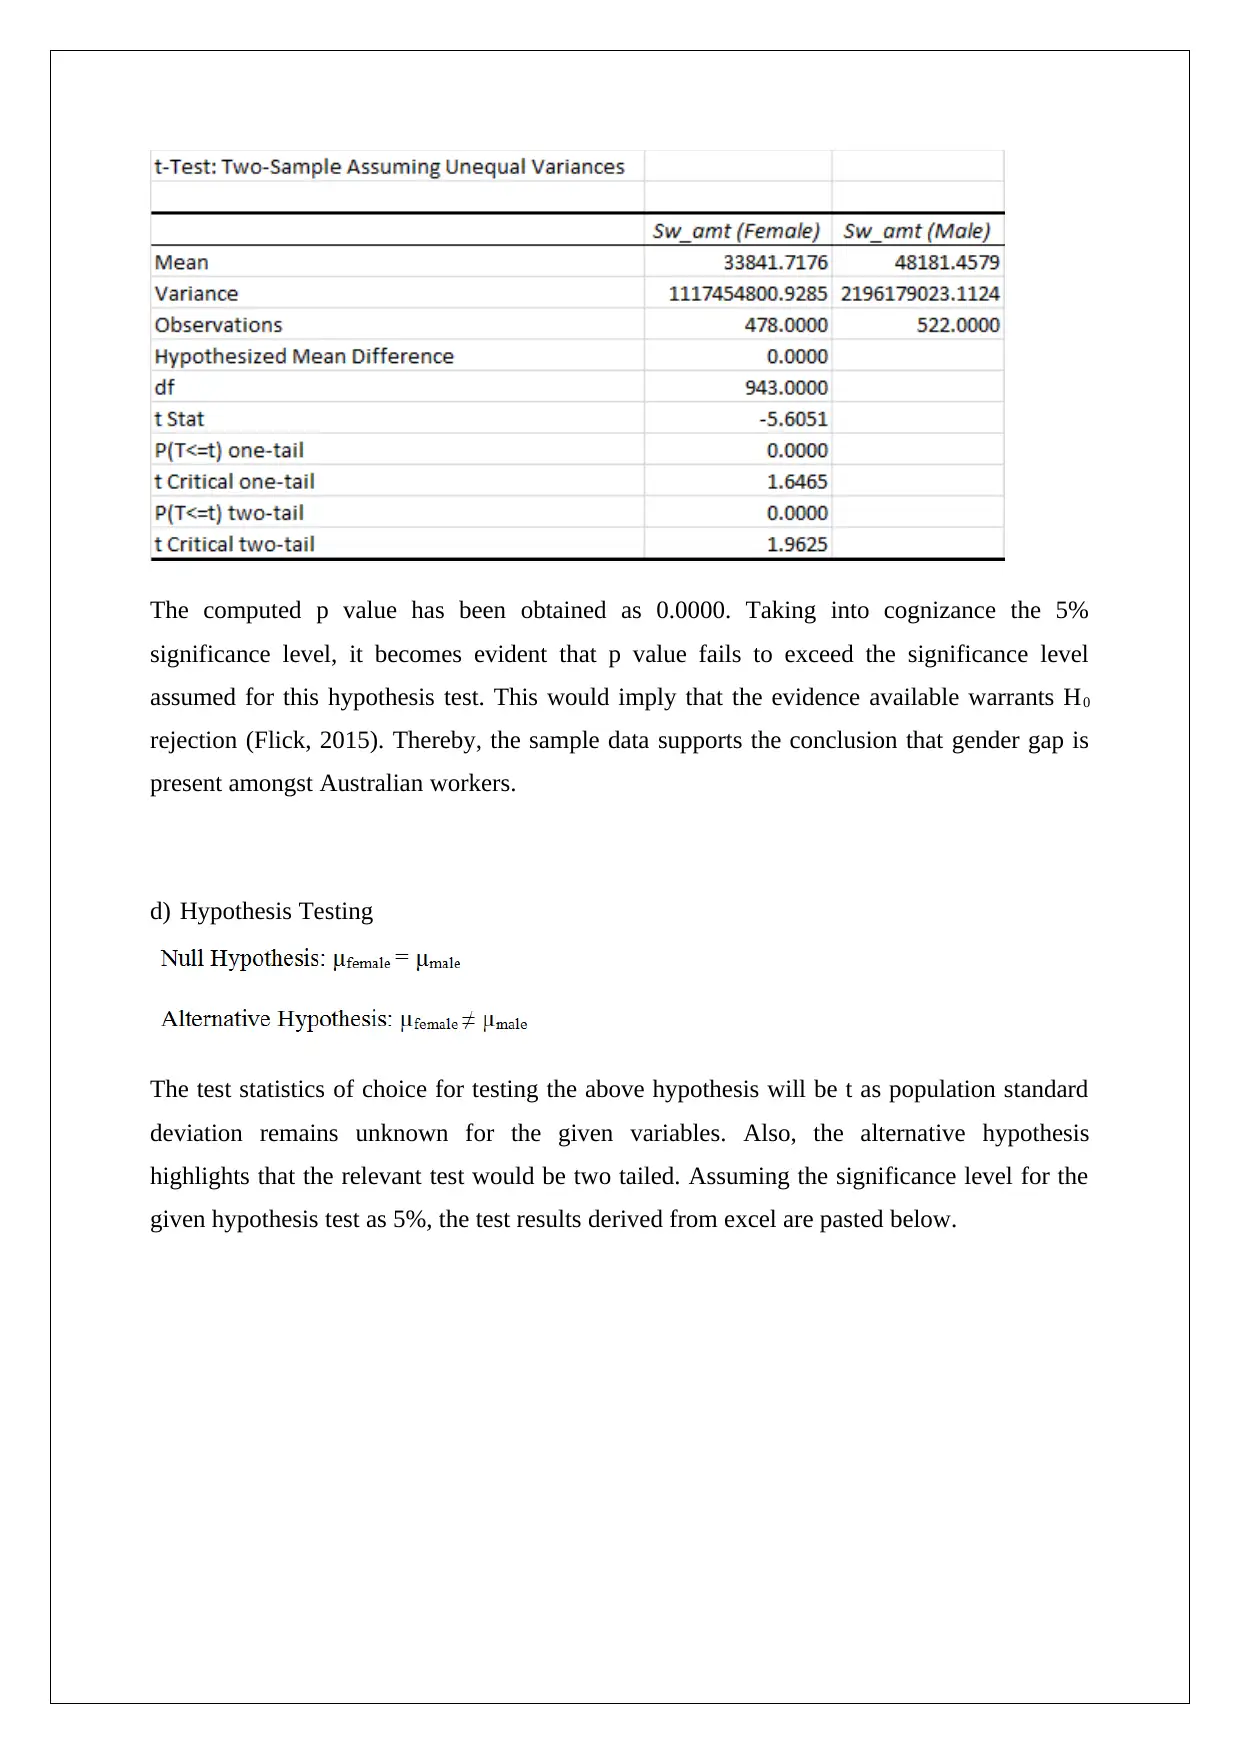
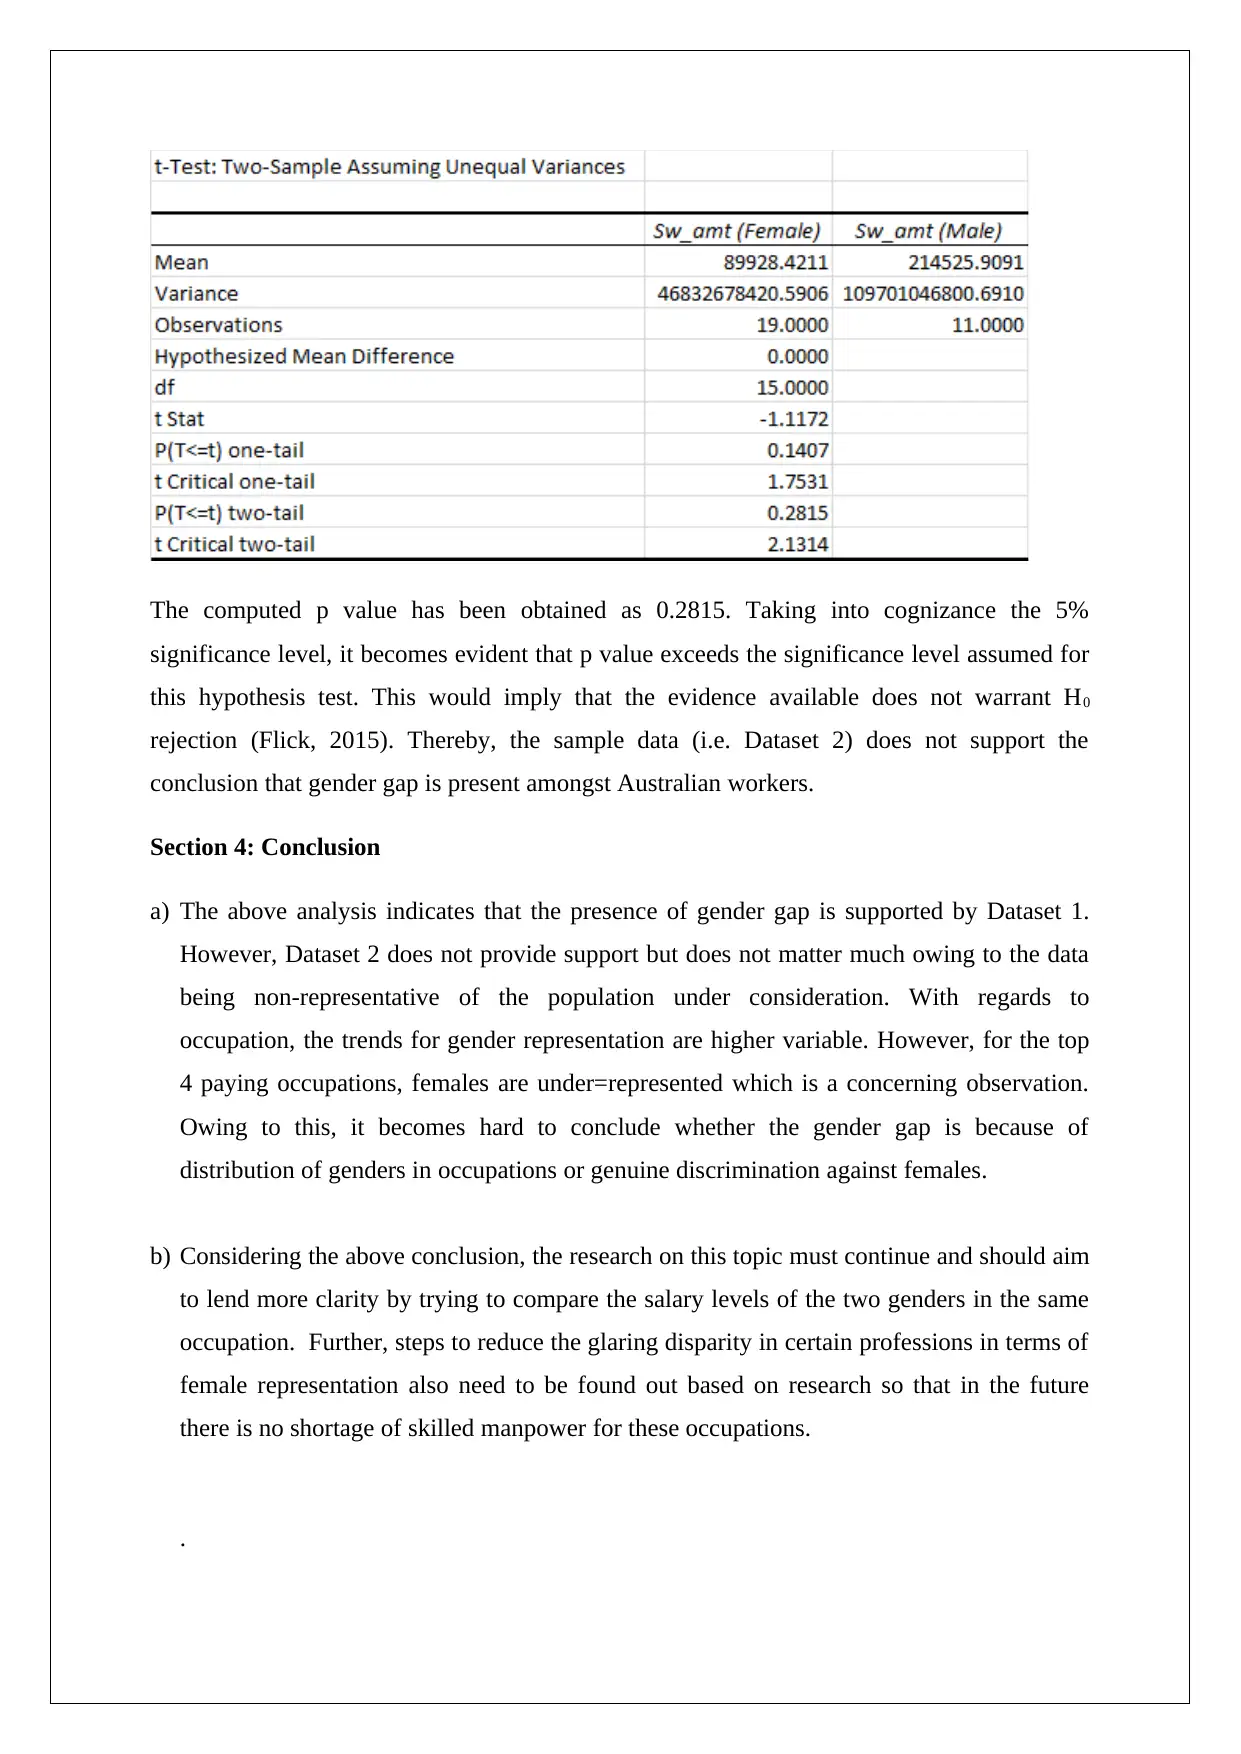
This report presents a statistical analysis of the gender pay gap in Australia, examining salary differences between genders and their distribution across various occupations. The analysis utilizes two datasets: one from the Australian Tax Office (ATO) providing information on taxpayers' gender, occupation, salary, and deductions; and another primary dataset collected through a survey. Descriptive statistics, including column charts, tables, and scatter diagrams, are employed to illustrate gender representation in different occupations and salary levels. Inferential statistics, such as confidence interval estimation and hypothesis testing (t-tests), are used to determine if statistically significant differences exist in salary levels and gender representation. The findings from Dataset 1 support the presence of a gender pay gap, while Dataset 2's results are less conclusive due to sampling limitations. The report concludes with a discussion on the implications of the findings and suggests avenues for future research, including a call for further investigation into the causes of the gender pay gap and strategies to address the under-representation of women in high-paying occupations.
Document Page
STATISTICAL MODELLING
STUDENT ID:
[Pick the date]
tabler-icon-diamond-filled.svg

Paraphrase This Document

Need a fresh take? Get an instant paraphrase of this document with our AI Paraphraser
Document Page
Section 1: Introduction
a) A trend apparent globally is that the females average salary level is lesser than the male
counterparts. Clearly, this is not a healthy trend as going forward it could discourage the
female participation and thus lead to shortage of manpower. This trend is also witnessed in
Australia where latest estimates indicate that the differential is quite significant. This
practice of females receiving average lower salary than the males is referred to as gender
gap and exists despite the presence of statutes prohibiting any gender based discrimination
in workplace. A more disturbing trend is the pervasiveness of this gender gap which also
can be seen at workplaces where the females represent the numerically superior gender
(Livsey, 2017). To explore this issue further, the key research question for the given
research is to find evidence for gender gap existence and possible linkage with occupation.
b) One of the datasets provided is Dataset 1 which contains specific information about 1000
Australian taxpayers and deals with their respective gender, occupation, salary amount and
gift amount claimed as deduction in the most recent tax returns. This particular dataset is
treated as secondary data since ATO acts as the data source. Thus, the collection of data
was completed by ATO and not by the researcher who is using the data provided by ATO
(Flick, 2015). The given datasets has two categorical variables measured using nominal
scale which include gender and occupation code. Also, there are two quantitative variables
measured using interval scale which include salary amount and deduction amount (Hair et.
al., 2015).
First five cases
.
c) Another dataset that has been used for the analysis in the case is dataset 2 which unlike the
dataset 1 is a primary dataset. This is because the data obtained has been computed using a
survey which focused on data collection regarding two critical variables pertaining to the
gender and also the annual salary level. This data would enable in conducting research on
Document Page
the presence of gender gap. Even though the data is primary here but there are issues
regarding the sampling method used and hence the derived sample information may not be
representative of the population. This problem also get aggravated due to the use of
convenience sampling coupled with sample size being only 30 compared to 1,000 for
dataset 1 (Eriksson and Kovalainen, 2015).
Section 2: Descriptive Statistics
a) The column chart illustrated as follows is indicative of the gender representation in various
occupations.
The main takeaway from the graph reflected above is that representation of two genders
across occupations shown sizable differences which cannot be ignored. This difference is
particular quite wide and hence disturbing in certain occupations such as the one with code 7
which represents drivers and machine operators. Clearly, it is not a profession that females
are ill-equipped to engage in. A comparable situation of female under-representation is also
visible in occupation code 3. However, males do not suffer the under-representation to the
same extent in any occupation that has been included here.
b) The column chart illustrated as follows is indicative of salary levels across genders
prevailing in the provided dataset 1.
Document Page
At the salary levels that are lower than $ 50,000, the dominant gender tends to be females.
However, as the salary levels tend to witness an increase, the proportional male share
increases in a disproportionate manner, thereby reducing female to a minority status. On an
average female have lower salary levels in comparison with males for the dataset 1 sample
data provided. A particular question that crops up on the basis of the data given below is the
role that uneven distribution of gender tends to play in the gender gap which is reflected by
the above graph. Further analysis is required in this regards to obtain lucid answers.
c) The table listed below highlights the distribution of the salary levels in accordance to the
gender.
The information contained in the above table provided clear evidence of gender gap prevalent
in the dataset 1 as females on average tends to draw lower annual salaries compared to males.
Also, with the increase in annual salary levels, the representation of females further dwindles
tabler-icon-diamond-filled.svg

Paraphrase This Document

Need a fresh take? Get an instant paraphrase of this document with our AI Paraphraser
Document Page
which highlights that presence of females that have high salary levels (above $ 150,000) is
very limited. It needs to be seen whether this gap is on account of males having high share is
higher paying jobs or just females being discriminated against in terms of pay.
d) The requisite relationship between salary levels and deduction levels is presented with the
aid the following scatter diagram.
Also, the correlation matrix in this case is indicated below.
The plotting of points in the scatter diagram along with the scatter matrix clearly provide
evidence that no relationship of any significance exists between the salary and gift deduction.
The correlation coefficient is close to zero which implies no relation between the given
variables. This should not be surprising considering the gift amount given by a particular
taxpayer should be dependent more on individual factors driving charity rather than salary
levels (Eriksson and Kovalainen, 2015).
Section 3: Inferential Statistics
a) There are two objectives here. The first one is to identify those occupations from the given
list of occupations which tend to offer a higher median salary. The top 4 occupations need
to be identified in this regards which have been identified as 1,2,3 and 7. The second
objective is to represent gender proportion especially with regards to female representation
Document Page
in these shortlisted professions. Considering that estimation about population is required
based on sample data, hence 95% confidence interval estimation using excel has been
carried out for proportion of females in a given occupation (Hillier, 2016).
The above output obtained using excel software indicates that there is a 95% chance that the
proportion of female employees in the manager occupation would be pegged within the range
(25.72%,46.78%).
The above output obtained using excel software indicates that there is a 95% chance that the
proportion of female employees in the professionals occupation would be pegged within the
range (7.64%,45.41%).
Document Page
The above output obtained using excel software indicates that there is a 95% chance that the
proportion of female employees in the technicians and trades workers occupation would be
pegged within the range (7.95%,11.19%).
The above output obtained using excel software indicates that there is a 95% chance that the
proportion of female employees in the driver and machine operator occupation would be
pegged within the range (0.00%,5.89%).
The above intervals clearly indicate that in all of the four occupations where females tend to
suffer from varying degrees of under-representation. This is apparent since the upper limit of
the confidence interval in neither of the professions is able to touch 0.5 or 50% mark. Further,
in some of the above professionals, the representation of females is so dismal that it seems as
though there is an informal entry barrier for females.
b) Hypothesis Testing
tabler-icon-diamond-filled.svg

Paraphrase This Document

Need a fresh take? Get an instant paraphrase of this document with our AI Paraphraser
Document Page
Considering that comparison of two independent samples with unknown σ has to be done,
hence the test statistics used would be T. This test would be two tailed as captured from the
alternative hypothesis for the test. The recommended approach for this hypothesis test is p
value and hence p value is obtained using excel as has been illustrated as follows.
The computed p value has been obtained as 0.0027. Taking into cognizance the 5%
significance level, it becomes evident that p value fails to exceed the significance level
assumed for this hypothesis test. This would imply that the evidence available warrants H0
rejection (Hillier, 2016). Thereby, the sample data supports the conclusion that occupation
code 7 has male representation that surpasses 80%.
c) Hypothesis Testing
Considering that comparison of two independent samples with unknown σ has to be done,
hence the test statistics used would be T. This test would be two tailed as captured from the
alternative hypothesis for the test. The recommended approach for this hypothesis test is p
value and hence p value is obtained using excel as has been illustrated as follows.
Document Page
The computed p value has been obtained as 0.0000. Taking into cognizance the 5%
significance level, it becomes evident that p value fails to exceed the significance level
assumed for this hypothesis test. This would imply that the evidence available warrants H0
rejection (Flick, 2015). Thereby, the sample data supports the conclusion that gender gap is
present amongst Australian workers.
d) Hypothesis Testing
The test statistics of choice for testing the above hypothesis will be t as population standard
deviation remains unknown for the given variables. Also, the alternative hypothesis
highlights that the relevant test would be two tailed. Assuming the significance level for the
given hypothesis test as 5%, the test results derived from excel are pasted below.
Document Page
The computed p value has been obtained as 0.2815. Taking into cognizance the 5%
significance level, it becomes evident that p value exceeds the significance level assumed for
this hypothesis test. This would imply that the evidence available does not warrant H0
rejection (Flick, 2015). Thereby, the sample data (i.e. Dataset 2) does not support the
conclusion that gender gap is present amongst Australian workers.
Section 4: Conclusion
a) The above analysis indicates that the presence of gender gap is supported by Dataset 1.
However, Dataset 2 does not provide support but does not matter much owing to the data
being non-representative of the population under consideration. With regards to
occupation, the trends for gender representation are higher variable. However, for the top
4 paying occupations, females are under=represented which is a concerning observation.
Owing to this, it becomes hard to conclude whether the gender gap is because of
distribution of genders in occupations or genuine discrimination against females.
b) Considering the above conclusion, the research on this topic must continue and should aim
to lend more clarity by trying to compare the salary levels of the two genders in the same
occupation. Further, steps to reduce the glaring disparity in certain professions in terms of
female representation also need to be found out based on research so that in the future
there is no shortage of skilled manpower for these occupations.
.
tabler-icon-diamond-filled.svg

Paraphrase This Document

Need a fresh take? Get an instant paraphrase of this document with our AI Paraphraser
Document Page
References
Eriksson, P. and Kovalainen, A. (2015) Quantitative methods in business research 3rd ed.
London: Sage Publications.
Flick, U. (2015) Introducing research methodology: A beginner's guide to doing a research
project. 4th ed. New York: Sage Publications.
Hair, J. F., Wolfinbarger, M., Money, A. H., Samouel, P., and Page, M. J. (2015) Essentials
of business research methods. 2nd ed. New York: Routledge.
Hillier, F. (2016) Introduction to Operations Research 6th ed. New York: McGraw Hill
Publications.
Livsey, A (2017) Australia's gender pay gap: why do women still earn less than men?
[online] Available at
https://www.theguardian.com/australia-news/datablog/2017/oct/18/australia-gender-pay-gap-
why-do-women-still-earn-less-than-men [Assessed at May 21, 2018]
chevron_up_icon
1 out of 11
circle_padding
hide_on_mobile
zoom_out_icon
[object Object]