Housing Finance: Australian City Price Analysis and Comparison
VerifiedAdded on 2021/06/14
|18
|3143
|35
Report
AI Summary
This report presents a comprehensive analysis of housing finance, focusing on property prices in Hobart, Newcastle, and Sydney over a 30-year period. It examines historical trends, comparing the performance of housing investments with Australian bonds and stocks. The report includes a comparison of property prices in the three cities, considering factors such as income levels of architects and house price-to-income ratios. It also explores mortgage usage in house financing, providing calculations for monthly repayments under different scenarios and analyzing the financial situations. The report concludes with a summary of key findings and implications for investors and potential homeowners.
RUNNING HEAD: Housing finance 0 | P a g e
Housing finance
Housing finance
Paraphrase This Document
Need a fresh take? Get an instant paraphrase of this document with our AI Paraphraser
Housing finance 1 | P a g e
Executive Summary
The performance has been measured on the basis of annual gross returns of 10 years
and 20 years delivered by the direct investment in housing property. In the second part of this
report, a comparison has been made among the house prises of above three cities. It also
includes the analyses of income level of architect in respective cities and a calculation of
income level ratio to house price.
Housing finance 2 | P a g e
Table of Contents
Executive Summary...............................................................................................................................2
Introduction...........................................................................................................................................3
Part 1.....................................................................................................................................................3
Housing prices over 30 years.............................................................................................................3
Part 2.....................................................................................................................................................7
Property prices in three cities:...........................................................................................................7
Comparing the prices.........................................................................................................................8
The house price to income level ratio................................................................................................9
Part 3...................................................................................................................................................10
Answer to question-A......................................................................................................................11
Answer to Question B......................................................................................................................13
Answer to Question C......................................................................................................................13
Conclusion...........................................................................................................................................15
References...........................................................................................................................................17
⊘ This is a preview!⊘
Do you want full access?
Subscribe today to unlock all pages.
Trusted by 1+ million students worldwide
Housing finance 3 | P a g e
Introduction
This report includes a complete study of housing prices in the cities named as Hobart,
Newcastle and Sydney. First part of this report describes the trend of change in housing
prices of each city that has been observed over three decades. It also evaluates the
performance of housing in comparison to Australian bonds and stocks. Further, the report
also focuses on the returns provided by the residential or housing property in relation with
Australian bonds and stocks.
Part 1
Housing prices over 30 years
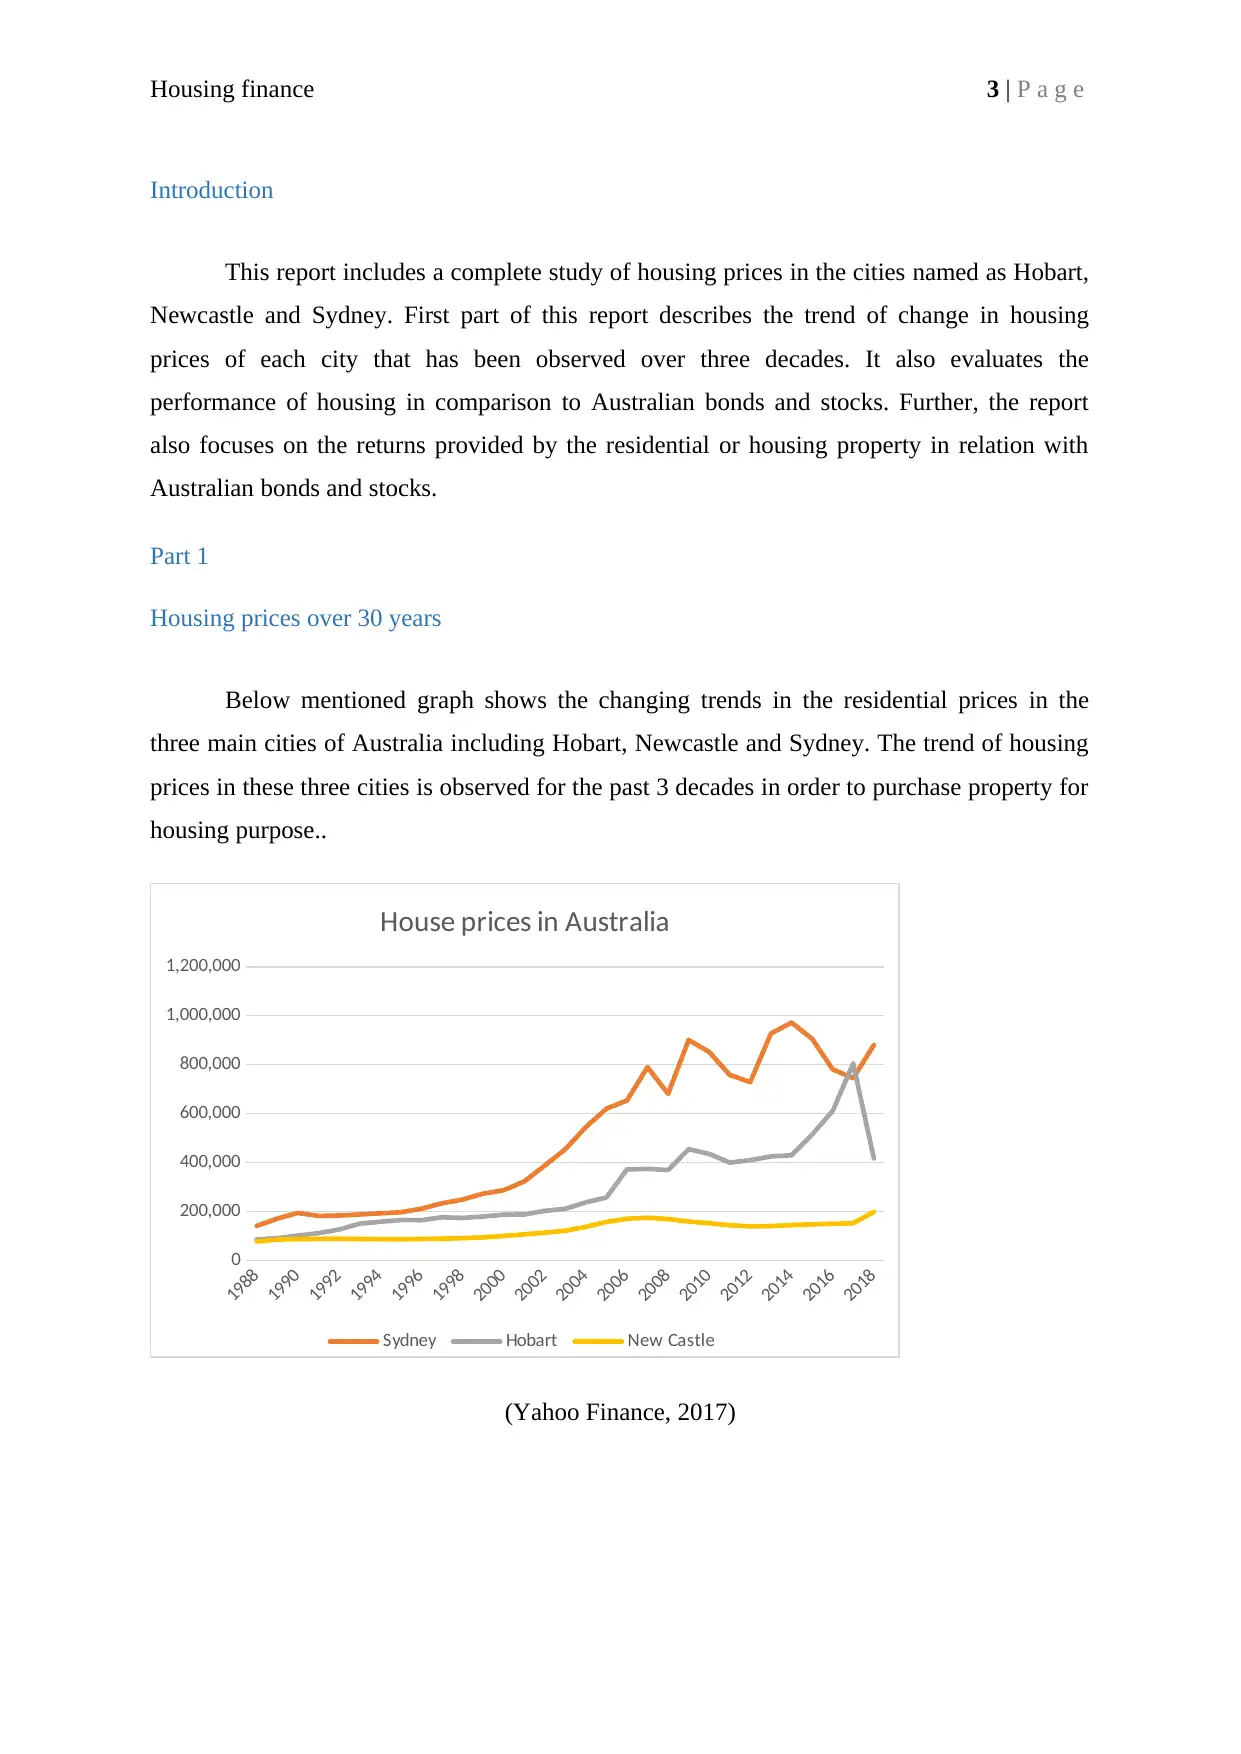
Below mentioned graph shows the changing trends in the residential prices in the
three main cities of Australia including Hobart, Newcastle and Sydney. The trend of housing
prices in these three cities is observed for the past 3 decades in order to purchase property for
housing purpose..
1988
1990
1992
1994
1996
1998
2000
2002
2004
2006
2008
2010
2012
2014
2016
2018
0
200,000
400,000
600,000
800,000
1,000,000
1,200,000
House prices in Australia
Sydney Hobart New Castle
(Yahoo Finance, 2017)
Introduction
This report includes a complete study of housing prices in the cities named as Hobart,
Newcastle and Sydney. First part of this report describes the trend of change in housing
prices of each city that has been observed over three decades. It also evaluates the
performance of housing in comparison to Australian bonds and stocks. Further, the report
also focuses on the returns provided by the residential or housing property in relation with
Australian bonds and stocks.
Part 1
Housing prices over 30 years
Below mentioned graph shows the changing trends in the residential prices in the
three main cities of Australia including Hobart, Newcastle and Sydney. The trend of housing
prices in these three cities is observed for the past 3 decades in order to purchase property for
housing purpose..
1988
1990
1992
1994
1996
1998
2000
2002
2004
2006
2008
2010
2012
2014
2016
2018
0
200,000
400,000
600,000
800,000
1,000,000
1,200,000
House prices in Australia
Sydney Hobart New Castle
(Yahoo Finance, 2017)
Paraphrase This Document
Need a fresh take? Get an instant paraphrase of this document with our AI Paraphraser
Housing finance 4 | P a g e
The graph indicates the movement or trends in the prices of houses in all three cities
of Australia. As an overview it can be said that Newcastle has the lowest prices and Sydney
reports the highest. In case of Sydney, it is noted that an increasing trend is been there the
housing prices of the city. The price was $141,000 in 1998 which has been reached to
$880,743 in present. The line denoting prices of Sydney is continuously increasing with
minimum fluctuations. The maximum prices charged for the purpose of purchasing house
property in Sydney in the period of 30 years was in 2014, $972,000. There was a constant
increase in prices for first twelve years. After that, the prices decreased in 2011 and 2012, and
then again increased in 2014 up to $972,000. After that, there has been observed in the prices.
Talking about Hobart, it always has an upward trend in terms of change in house
prices during the period of past 20-30 years. The purchasing price of house property was
$86,000 in 1998 which has now reached to $416,840. A noticeable increase in the housing
prices of Hobart was observed in 1992 and 1993. That was the main time when prices got a
vast hike that was $150,000 in 1993 in comparison to $126,125 for the year 1992. A
continuous rising trend was observed in the prices till 2017 and again there was a fall in
prices in 2018 (Realestate.com.au. 2018).
In the graph, a little upward movement can be observed in the trend line of Newcastle.
But it shows almost a stable trend during past 30 years. As compared to Hobart and Sydney,
this city is offering the lowest housing prices.
.
1992
1994
1996
1998
2000
2002
2004
2006
2008
2010
2012
2014
2016
2018
0
1000
2000
3000
4000
5000
6000
7000
S&P ASX 200
Adj Close
Housing finance 5 | P a g e
(Yahoo Finance, 2017).
Housing prices in Newcastle was $77,460 on 1998 which has now increased up to
$198,200. There was a continuously rise in the housing prices in Newcastle till 2007 but after
that, a decreasing trend was observed in the same.
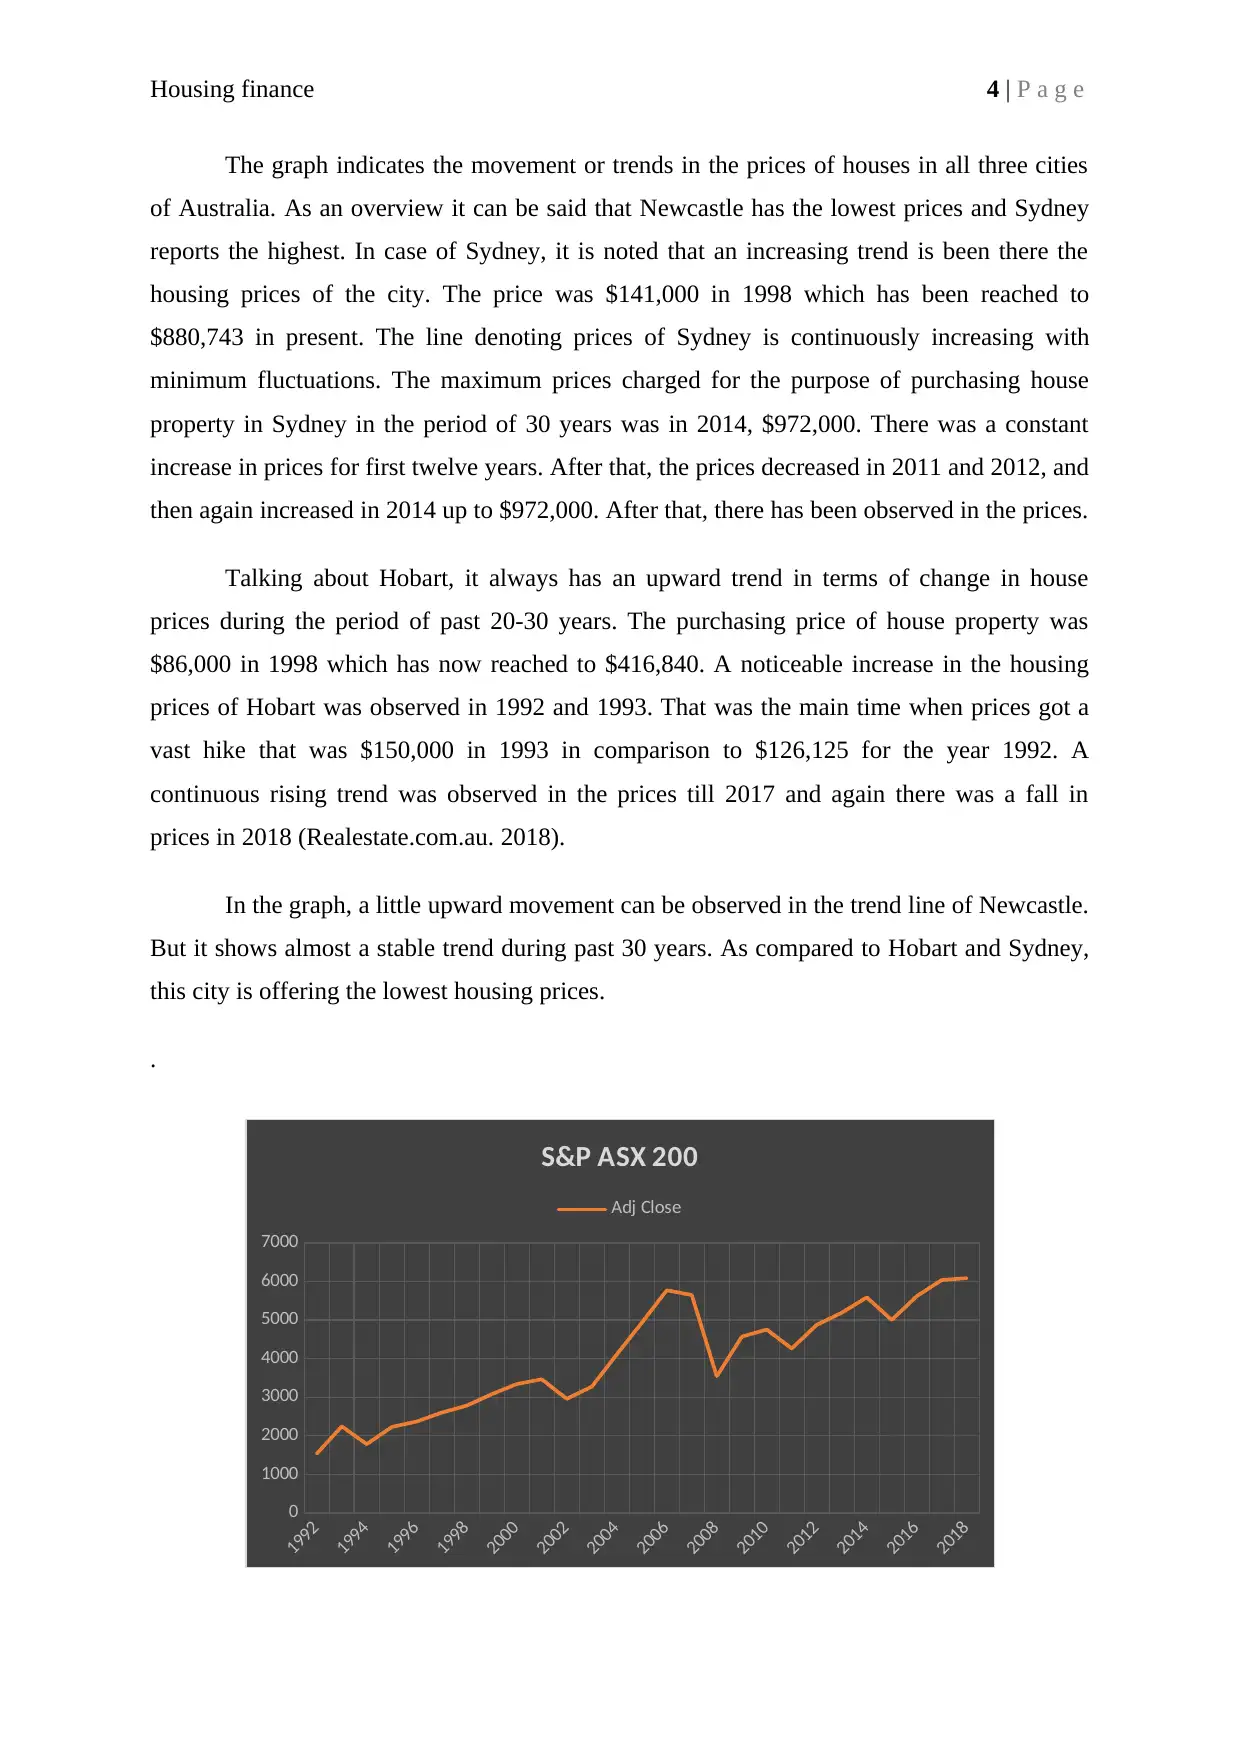
In relation with Australian Stocks, housing prices in Sydney are performing in a better
way as they are continuously increasing since 1988. Similar trend can also be observed in the
stock prices of S&P ASX 200. The prices are increasing continuously with minimum
fluctuations over the period and highest reported in 2006 as $5773.4. After that there was a
drop in prices and suddenly rises to great extent. At present, the stock is trading at 6087.4. In
a comparison is made among the trends of housing prices of Newcastle and Hobart, it can be
said that an upward trend has been showed by both the cities but still both have performed
less than the ASX 200.
Real estate returns VS stock and bond returns:
It is a statistically and historically proved truth that the residential property in real
estate market of Australia has offered stable and high returns for both, rental income and
capital growth. It is observed in the evaluation of past five years that properties located in the
capital cities has offered comparatively high returns on the basis of their previous
performance.
(Yahoo Finance, 2017).
Housing prices in Newcastle was $77,460 on 1998 which has now increased up to
$198,200. There was a continuously rise in the housing prices in Newcastle till 2007 but after
that, a decreasing trend was observed in the same.
In relation with Australian Stocks, housing prices in Sydney are performing in a better
way as they are continuously increasing since 1988. Similar trend can also be observed in the
stock prices of S&P ASX 200. The prices are increasing continuously with minimum
fluctuations over the period and highest reported in 2006 as $5773.4. After that there was a
drop in prices and suddenly rises to great extent. At present, the stock is trading at 6087.4. In
a comparison is made among the trends of housing prices of Newcastle and Hobart, it can be
said that an upward trend has been showed by both the cities but still both have performed
less than the ASX 200.
Real estate returns VS stock and bond returns:
It is a statistically and historically proved truth that the residential property in real
estate market of Australia has offered stable and high returns for both, rental income and
capital growth. It is observed in the evaluation of past five years that properties located in the
capital cities has offered comparatively high returns on the basis of their previous
performance.
⊘ This is a preview!⊘
Do you want full access?
Subscribe today to unlock all pages.
Trusted by 1+ million students worldwide
Housing finance 6 | P a g e
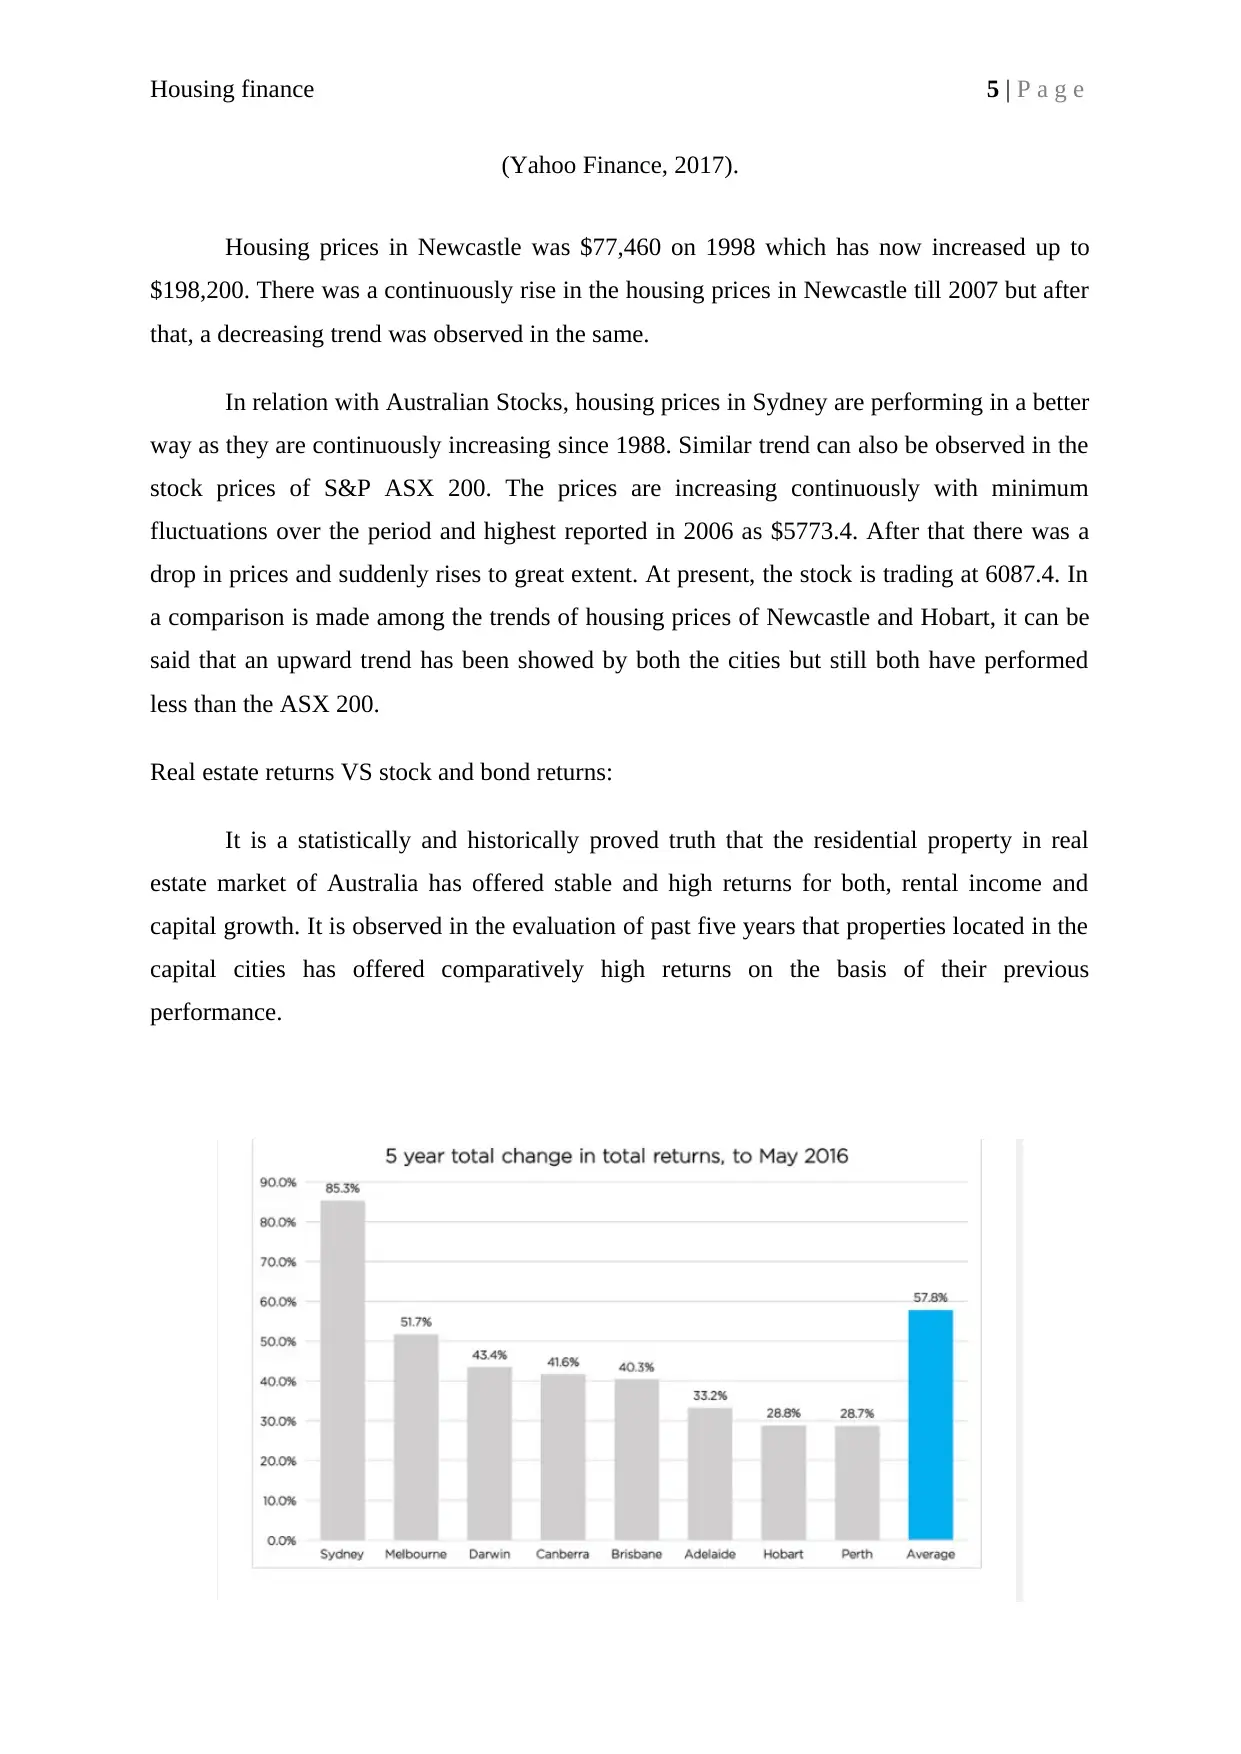
(Brickx.com. (2017).
Returns generated in real estate by the capital cities of Australia can be understood by
the study of above graph. The graph shows that Sydney has provided highest returns during
past five years that is 85.3% with constant rise in prices. On the other hand, Hobart has
offered only 28.8% returns as per its previous performance and Melbourne offered 51.7%
returns, which was good but less in comparison to Sydney Brickx.com. (2017
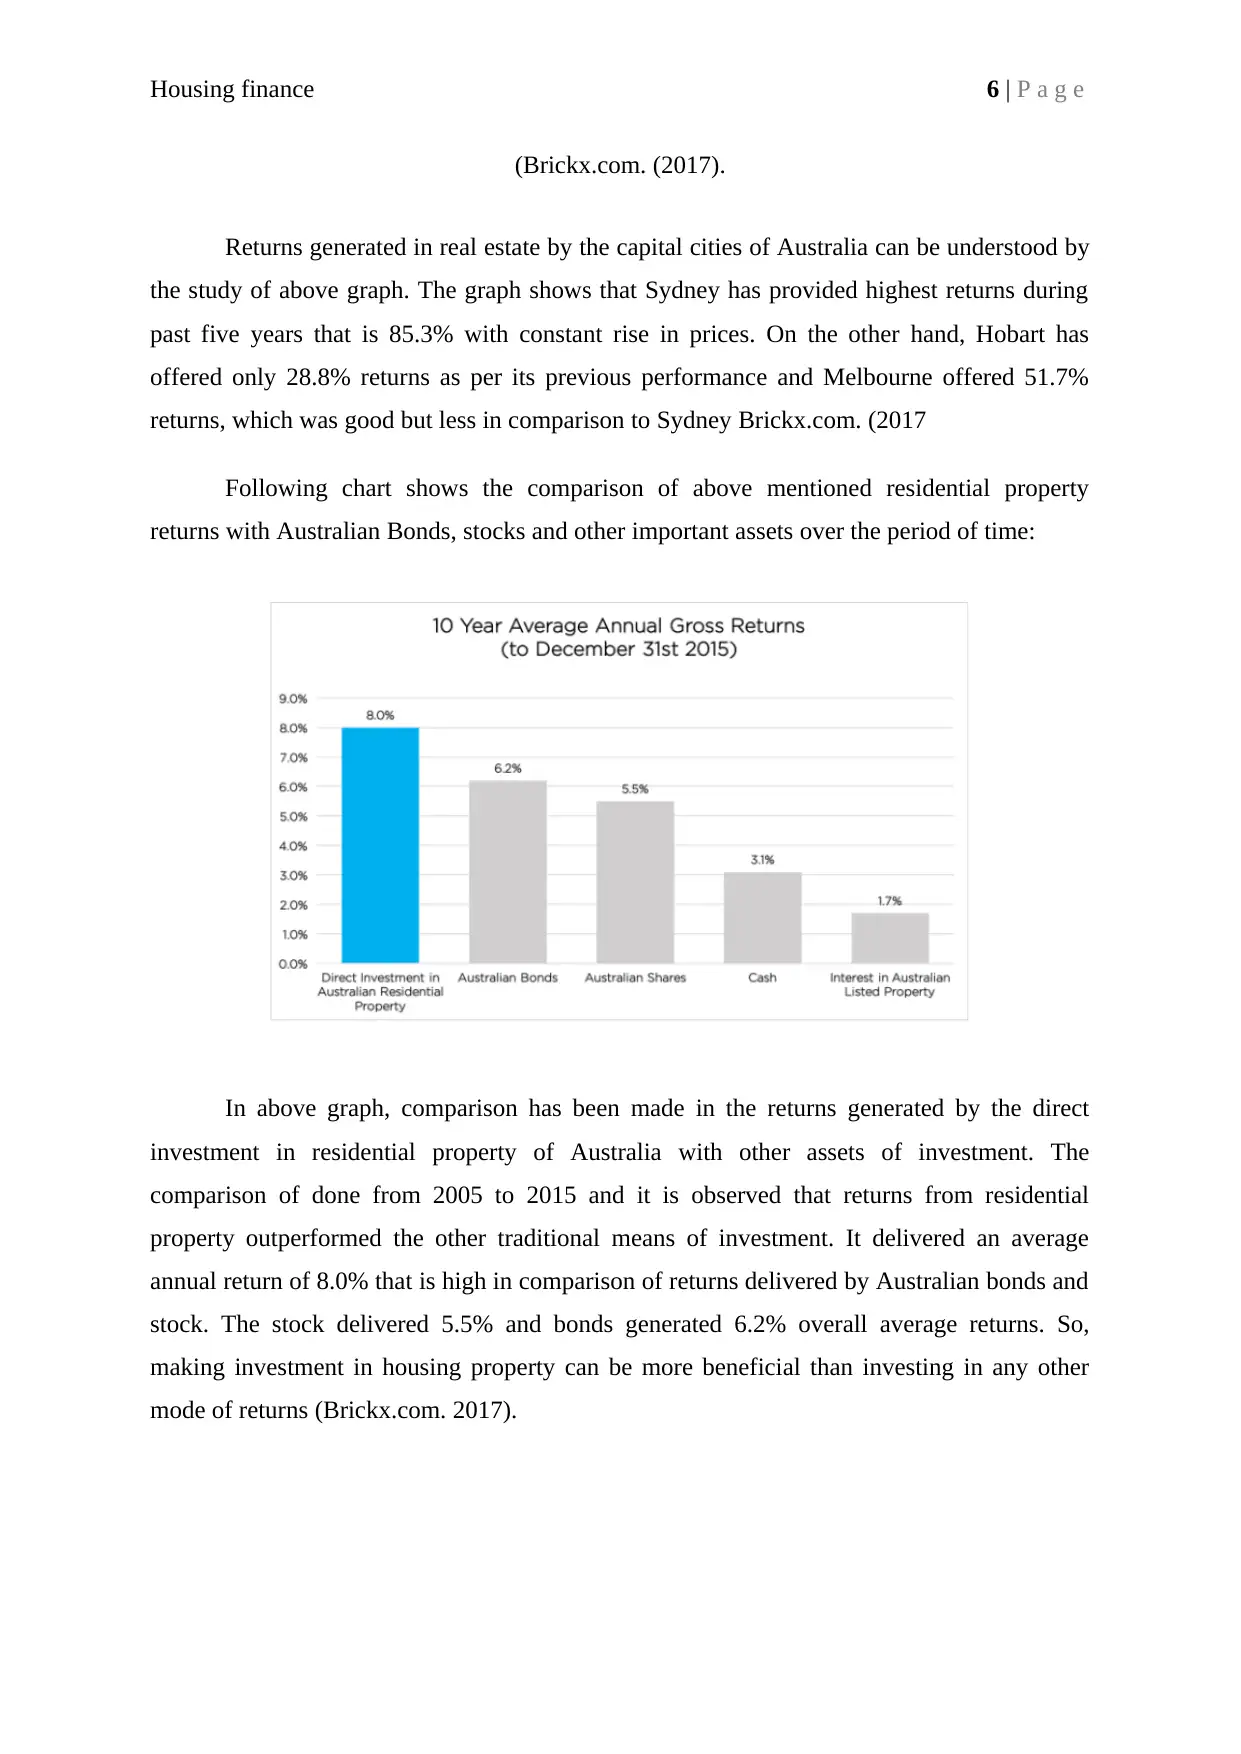
Following chart shows the comparison of above mentioned residential property
returns with Australian Bonds, stocks and other important assets over the period of time:
In above graph, comparison has been made in the returns generated by the direct
investment in residential property of Australia with other assets of investment. The
comparison of done from 2005 to 2015 and it is observed that returns from residential
property outperformed the other traditional means of investment. It delivered an average
annual return of 8.0% that is high in comparison of returns delivered by Australian bonds and
stock. The stock delivered 5.5% and bonds generated 6.2% overall average returns. So,
making investment in housing property can be more beneficial than investing in any other
mode of returns (Brickx.com. 2017).
(Brickx.com. (2017).
Returns generated in real estate by the capital cities of Australia can be understood by
the study of above graph. The graph shows that Sydney has provided highest returns during
past five years that is 85.3% with constant rise in prices. On the other hand, Hobart has
offered only 28.8% returns as per its previous performance and Melbourne offered 51.7%
returns, which was good but less in comparison to Sydney Brickx.com. (2017
Following chart shows the comparison of above mentioned residential property
returns with Australian Bonds, stocks and other important assets over the period of time:
In above graph, comparison has been made in the returns generated by the direct
investment in residential property of Australia with other assets of investment. The
comparison of done from 2005 to 2015 and it is observed that returns from residential
property outperformed the other traditional means of investment. It delivered an average
annual return of 8.0% that is high in comparison of returns delivered by Australian bonds and
stock. The stock delivered 5.5% and bonds generated 6.2% overall average returns. So,
making investment in housing property can be more beneficial than investing in any other
mode of returns (Brickx.com. 2017).
Paraphrase This Document
Need a fresh take? Get an instant paraphrase of this document with our AI Paraphraser
Housing finance 7 | P a g e
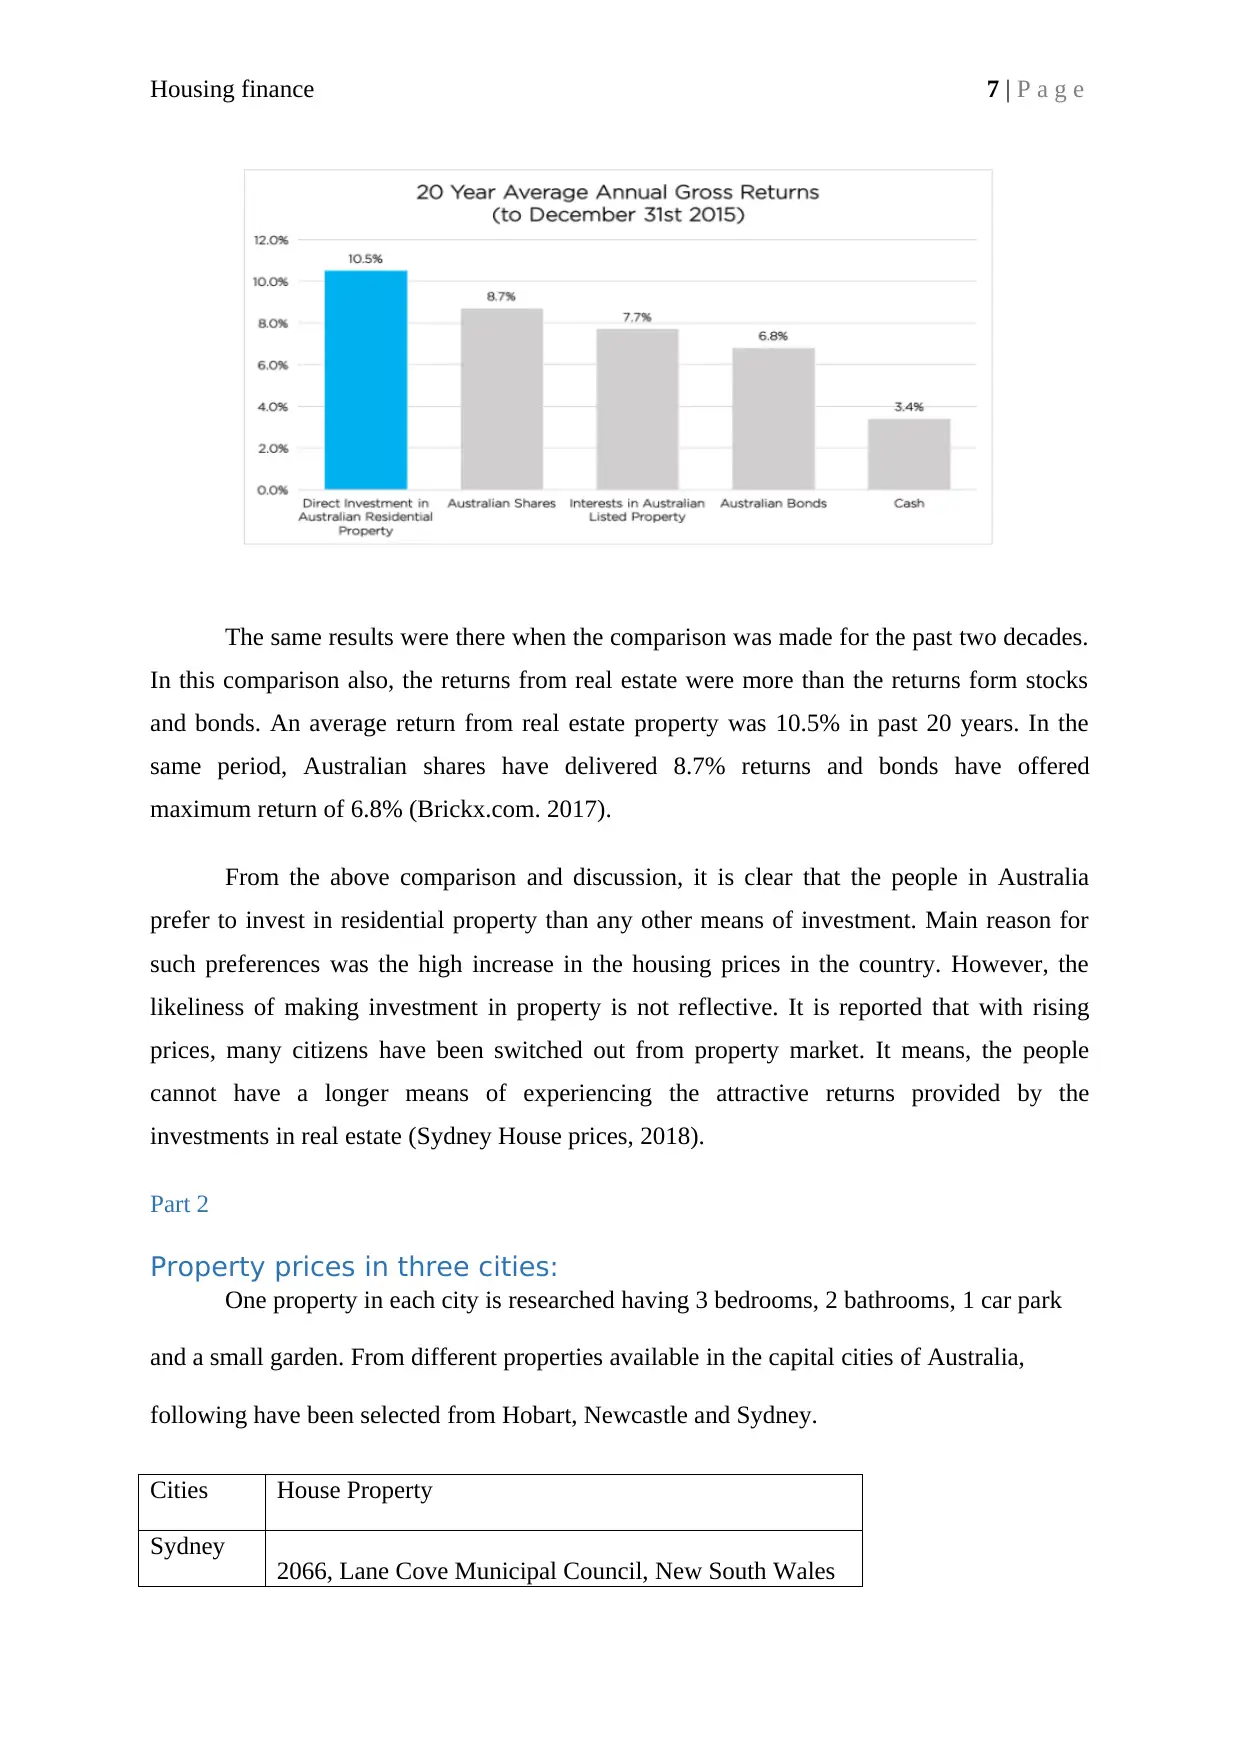
The same results were there when the comparison was made for the past two decades.
In this comparison also, the returns from real estate were more than the returns form stocks
and bonds. An average return from real estate property was 10.5% in past 20 years. In the
same period, Australian shares have delivered 8.7% returns and bonds have offered
maximum return of 6.8% (Brickx.com. 2017).
From the above comparison and discussion, it is clear that the people in Australia
prefer to invest in residential property than any other means of investment. Main reason for
such preferences was the high increase in the housing prices in the country. However, the
likeliness of making investment in property is not reflective. It is reported that with rising
prices, many citizens have been switched out from property market. It means, the people
cannot have a longer means of experiencing the attractive returns provided by the
investments in real estate (Sydney House prices, 2018).
Part 2
Property prices in three cities:
One property in each city is researched having 3 bedrooms, 2 bathrooms, 1 car park
and a small garden. From different properties available in the capital cities of Australia,
following have been selected from Hobart, Newcastle and Sydney.
Cities House Property
Sydney 2066, Lane Cove Municipal Council, New South Wales
Housing finance 8 | P a g e
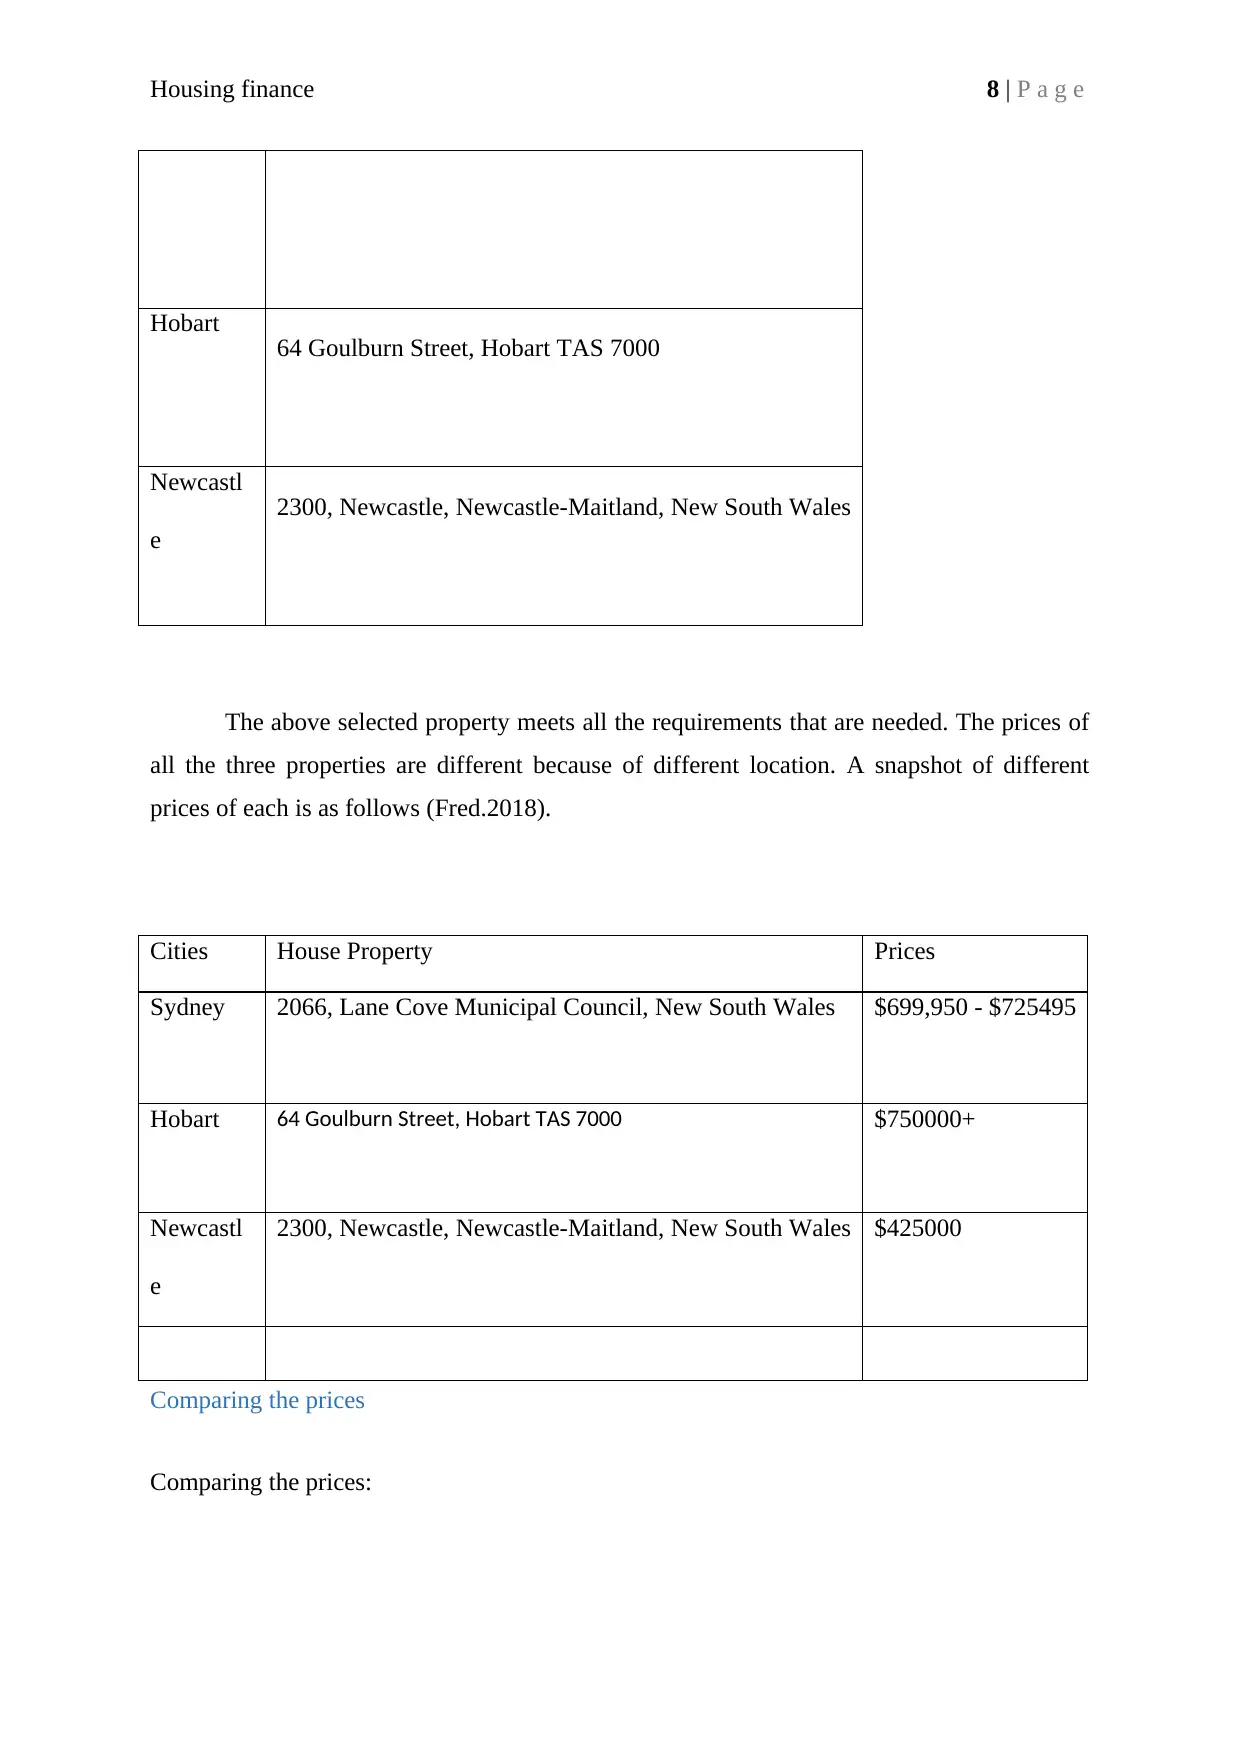
Hobart 64 Goulburn Street, Hobart TAS 7000
Newcastl
e
2300, Newcastle, Newcastle-Maitland, New South Wales
The above selected property meets all the requirements that are needed. The prices of
all the three properties are different because of different location. A snapshot of different
prices of each is as follows (Fred.2018).
Cities House Property Prices
Sydney 2066, Lane Cove Municipal Council, New South Wales $699,950 - $725495
Hobart 64 Goulburn Street, Hobart TAS 7000 $750000+
Newcastl
e
2300, Newcastle, Newcastle-Maitland, New South Wales $425000
Comparing the prices
Comparing the prices:
⊘ This is a preview!⊘
Do you want full access?
Subscribe today to unlock all pages.
Trusted by 1+ million students worldwide
Housing finance 9 | P a g e
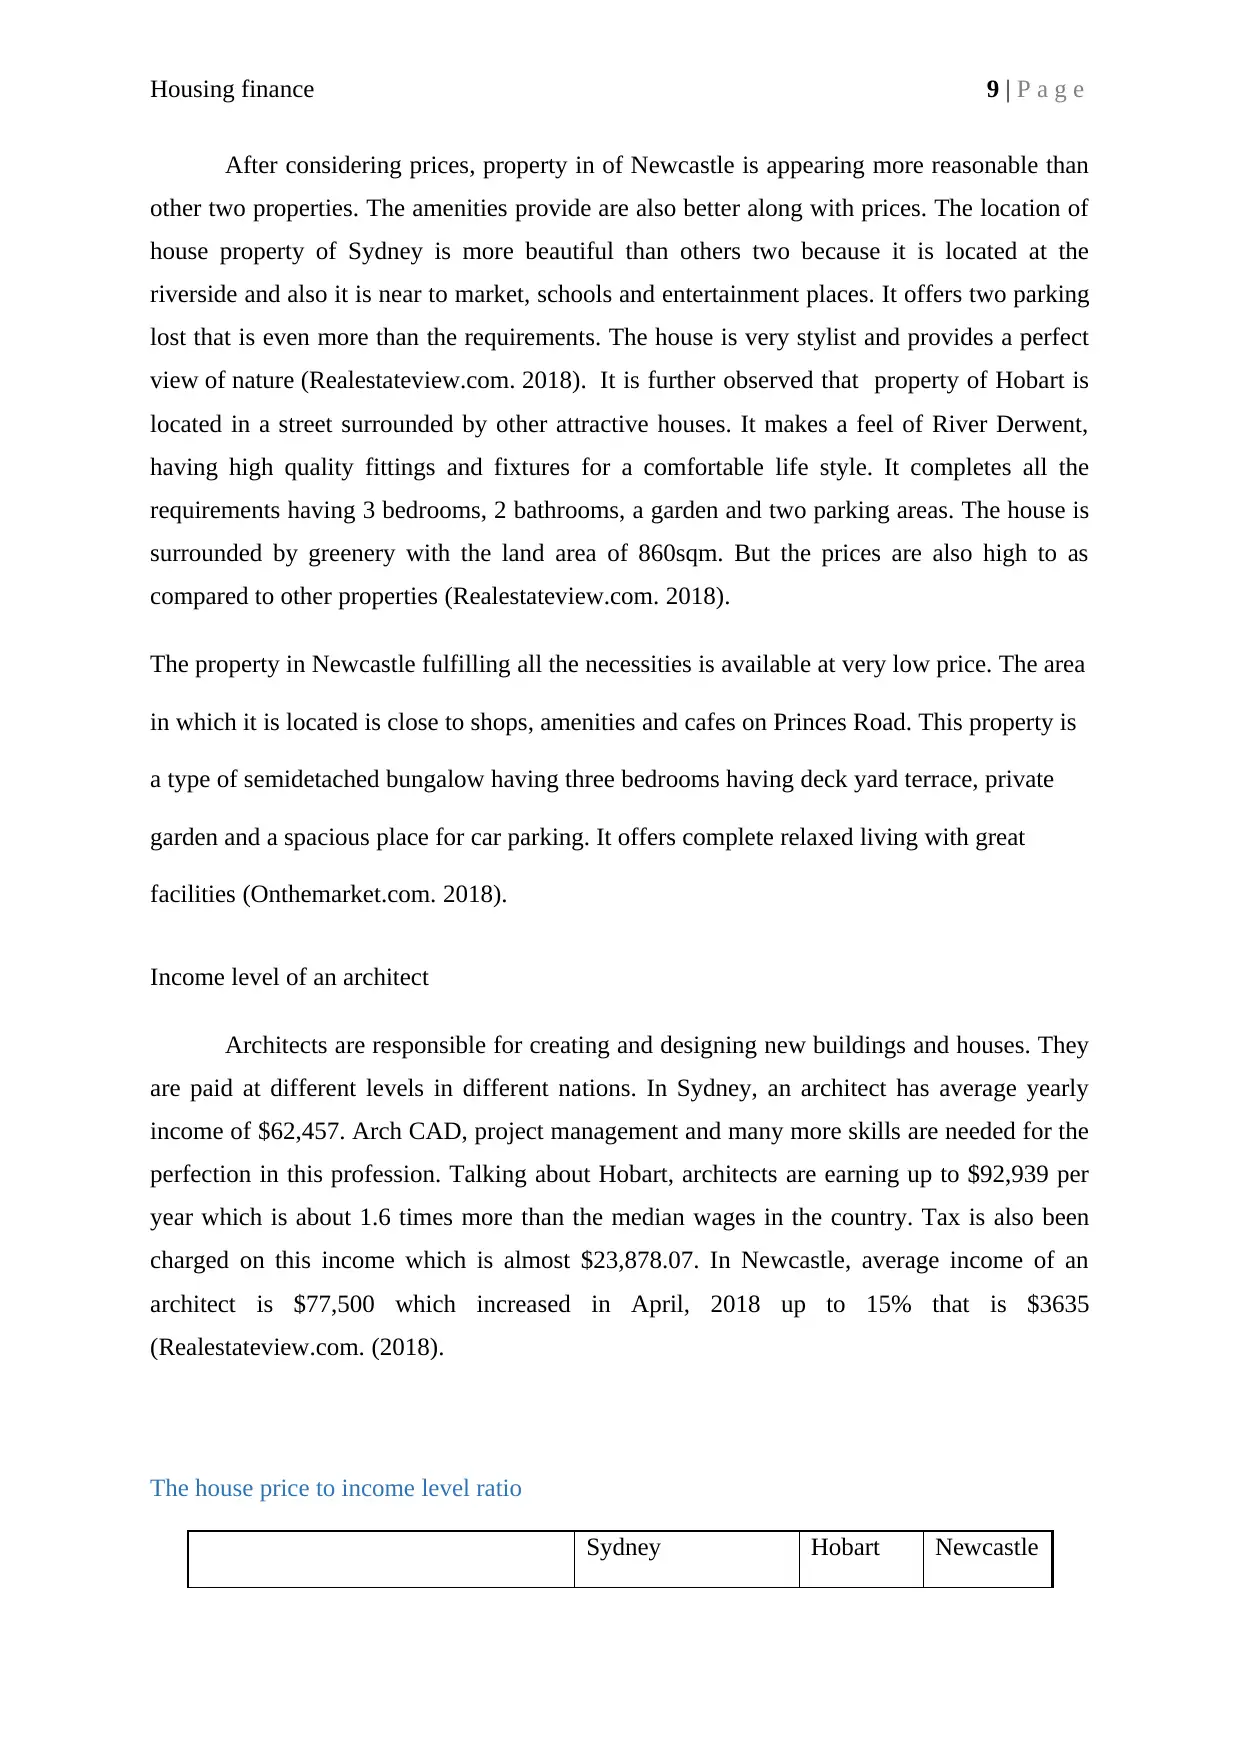
After considering prices, property in of Newcastle is appearing more reasonable than
other two properties. The amenities provide are also better along with prices. The location of
house property of Sydney is more beautiful than others two because it is located at the
riverside and also it is near to market, schools and entertainment places. It offers two parking
lost that is even more than the requirements. The house is very stylist and provides a perfect
view of nature (Realestateview.com. 2018). It is further observed that property of Hobart is
located in a street surrounded by other attractive houses. It makes a feel of River Derwent,
having high quality fittings and fixtures for a comfortable life style. It completes all the
requirements having 3 bedrooms, 2 bathrooms, a garden and two parking areas. The house is
surrounded by greenery with the land area of 860sqm. But the prices are also high to as
compared to other properties (Realestateview.com. 2018).
The property in Newcastle fulfilling all the necessities is available at very low price. The area
in which it is located is close to shops, amenities and cafes on Princes Road. This property is
a type of semidetached bungalow having three bedrooms having deck yard terrace, private
garden and a spacious place for car parking. It offers complete relaxed living with great
facilities (Onthemarket.com. 2018).
Income level of an architect
Architects are responsible for creating and designing new buildings and houses. They
are paid at different levels in different nations. In Sydney, an architect has average yearly
income of $62,457. Arch CAD, project management and many more skills are needed for the
perfection in this profession. Talking about Hobart, architects are earning up to $92,939 per
year which is about 1.6 times more than the median wages in the country. Tax is also been
charged on this income which is almost $23,878.07. In Newcastle, average income of an
architect is $77,500 which increased in April, 2018 up to 15% that is $3635
(Realestateview.com. (2018).
The house price to income level ratio
Sydney Hobart Newcastle
Paraphrase This Document
Need a fresh take? Get an instant paraphrase of this document with our AI Paraphraser
Housing finance 10 | P a g e
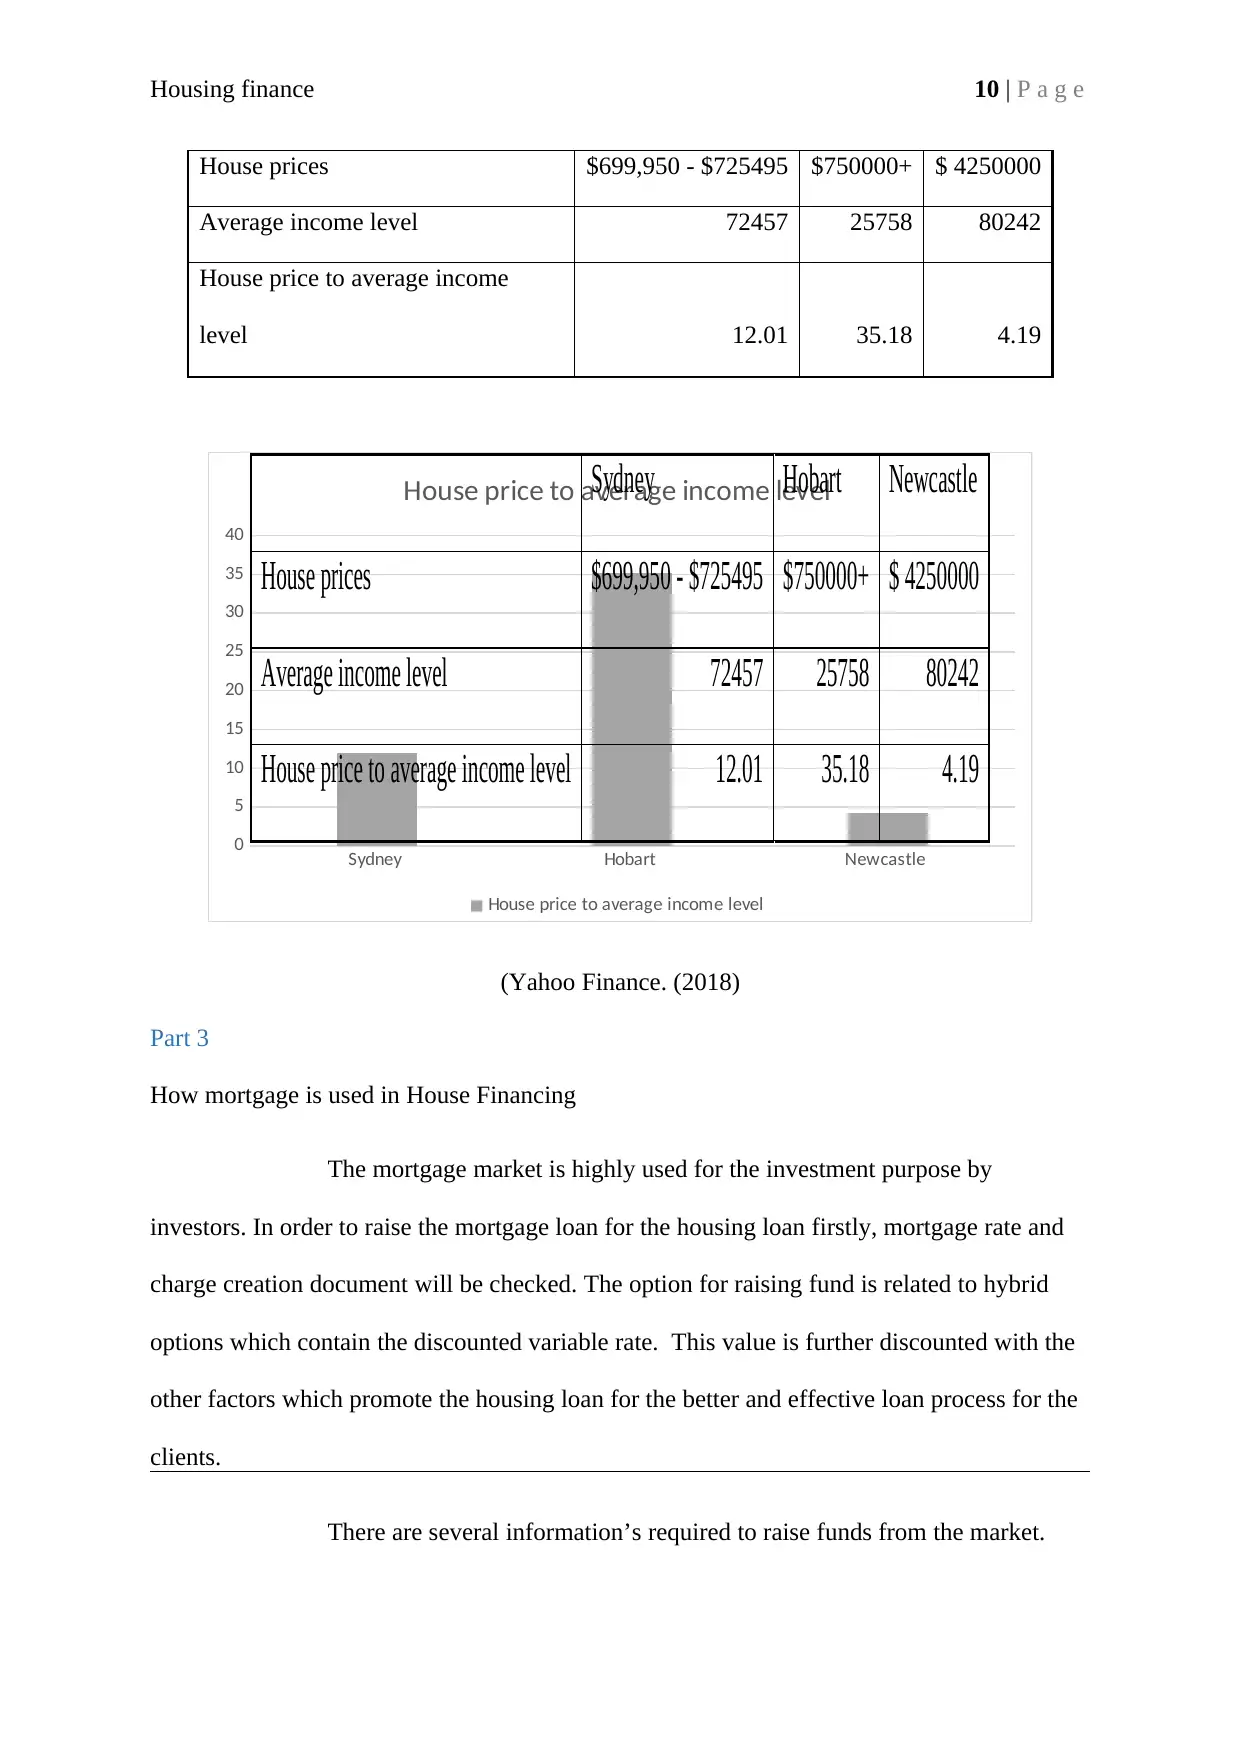
House prices $699,950 - $725495 $750000+ $ 4250000
Average income level 72457 25758 80242
House price to average income
level 12.01 35.18 4.19
Sydney Hobart Newcastle
0
5
10
15
20
25
30
35
40
House price to average income level
House price to average income level
Sydney Hobart Newcastle
House prices $699,950 - $725495 $750000+ $ 4250000
Average income level 72457 25758 80242
House price to average income level 12.01 35.18 4.19
(Yahoo Finance. (2018)
Part 3
How mortgage is used in House Financing
The mortgage market is highly used for the investment purpose by
investors. In order to raise the mortgage loan for the housing loan firstly, mortgage rate and
charge creation document will be checked. The option for raising fund is related to hybrid
options which contain the discounted variable rate. This value is further discounted with the
other factors which promote the housing loan for the better and effective loan process for the
clients.
There are several information’s required to raise funds from the market.
House prices $699,950 - $725495 $750000+ $ 4250000
Average income level 72457 25758 80242
House price to average income
level 12.01 35.18 4.19
Sydney Hobart Newcastle
0
5
10
15
20
25
30
35
40
House price to average income level
House price to average income level
Sydney Hobart Newcastle
House prices $699,950 - $725495 $750000+ $ 4250000
Average income level 72457 25758 80242
House price to average income level 12.01 35.18 4.19
(Yahoo Finance. (2018)
Part 3
How mortgage is used in House Financing
The mortgage market is highly used for the investment purpose by
investors. In order to raise the mortgage loan for the housing loan firstly, mortgage rate and
charge creation document will be checked. The option for raising fund is related to hybrid
options which contain the discounted variable rate. This value is further discounted with the
other factors which promote the housing loan for the better and effective loan process for the
clients.
There are several information’s required to raise funds from the market.
Housing finance 11 | P a g e
Personal information of the applicant such as employment history, pass book copy, bank
statement, credit rating and other securities documents which would be required to create
charge on the assets (Favilukis, Ludvigson, & Van Nieuwerburgh, 2017).
The last six month of the inflow and outflow of the bank accounts and collateral securities
will be undertaken to evaluate credit rating of the applicant.
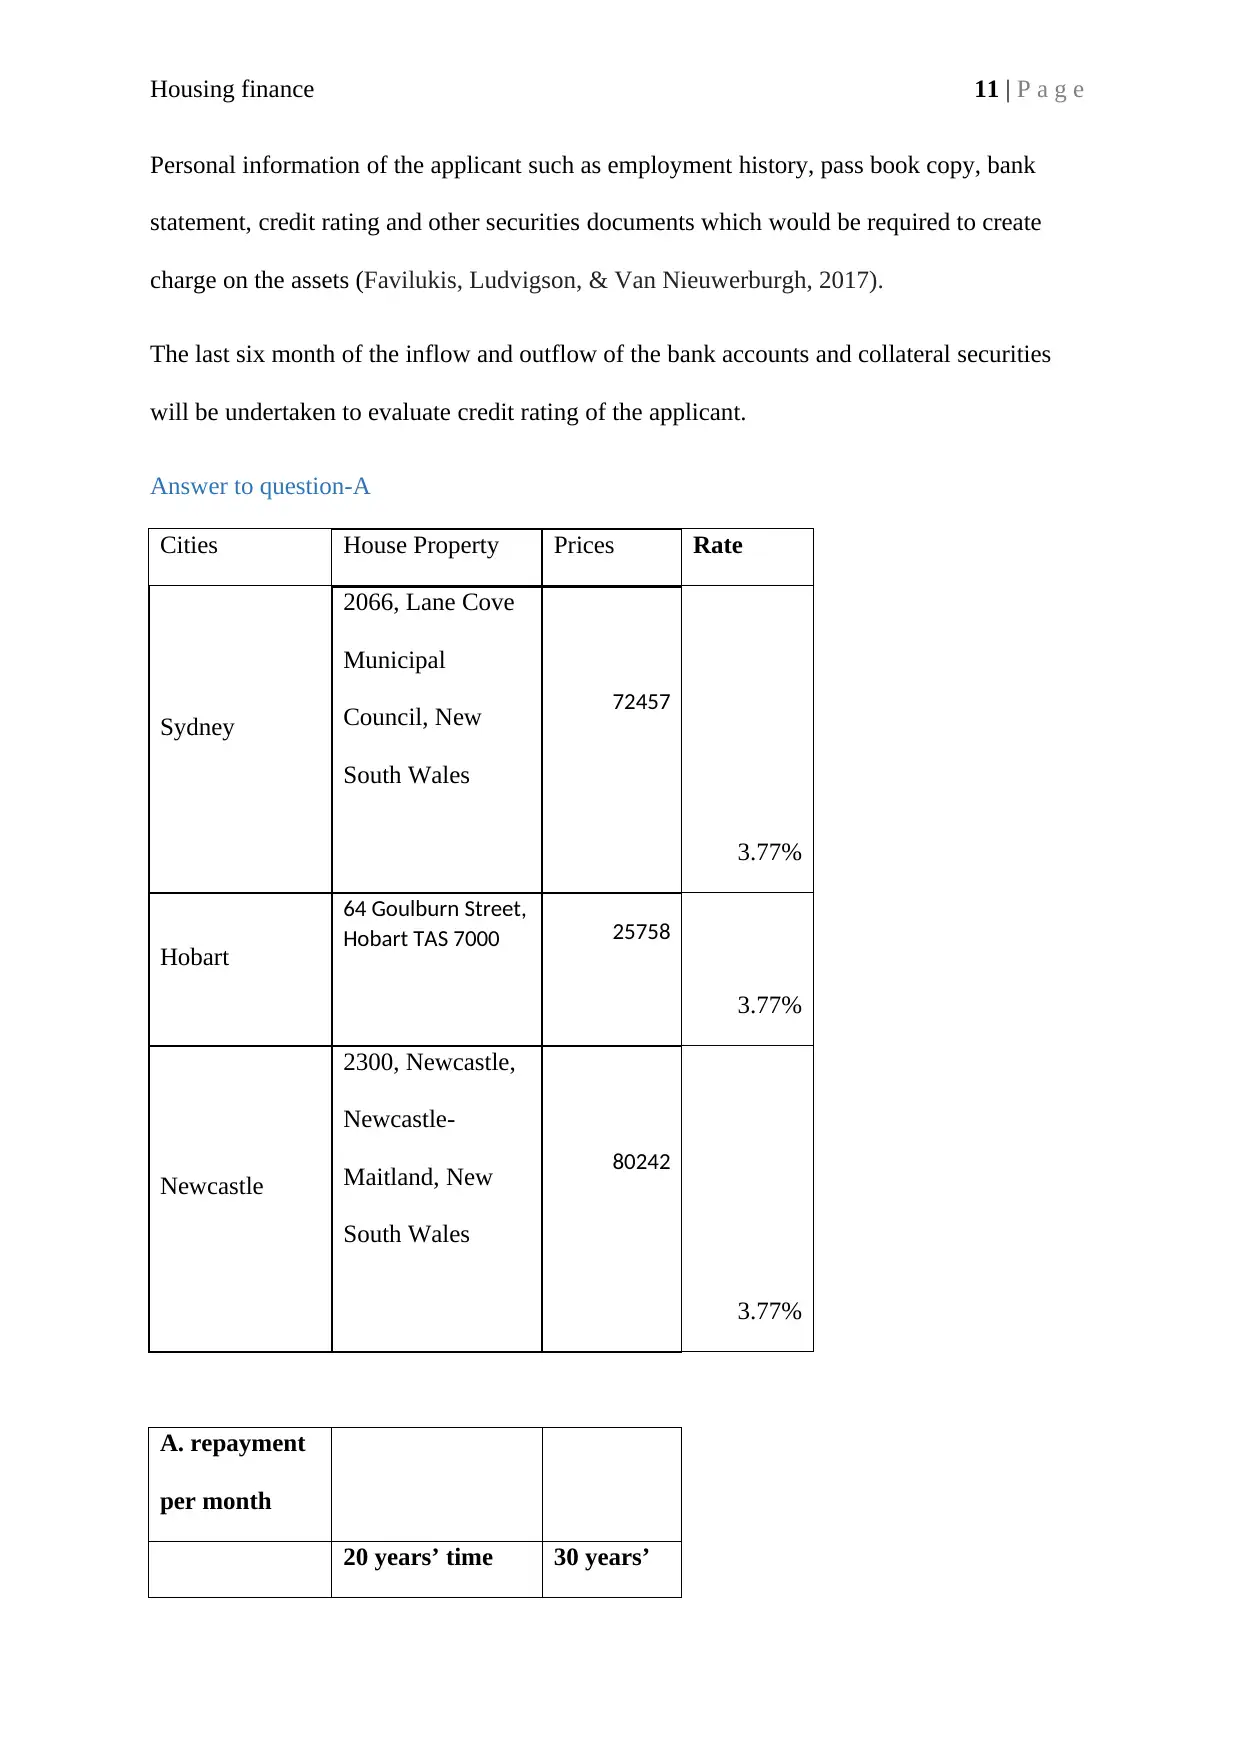
Answer to question-A
Cities House Property Prices Rate
Sydney
2066, Lane Cove
Municipal
Council, New
South Wales
72457
3.77%
Hobart
64 Goulburn Street,
Hobart TAS 7000 25758
3.77%
Newcastle
2300, Newcastle,
Newcastle-
Maitland, New
South Wales
80242
3.77%
A. repayment
per month
20 years’ time 30 years’
Personal information of the applicant such as employment history, pass book copy, bank
statement, credit rating and other securities documents which would be required to create
charge on the assets (Favilukis, Ludvigson, & Van Nieuwerburgh, 2017).
The last six month of the inflow and outflow of the bank accounts and collateral securities
will be undertaken to evaluate credit rating of the applicant.
Answer to question-A
Cities House Property Prices Rate
Sydney
2066, Lane Cove
Municipal
Council, New
South Wales
72457
3.77%
Hobart
64 Goulburn Street,
Hobart TAS 7000 25758
3.77%
Newcastle
2300, Newcastle,
Newcastle-
Maitland, New
South Wales
80242
3.77%
A. repayment
per month
20 years’ time 30 years’
⊘ This is a preview!⊘
Do you want full access?
Subscribe today to unlock all pages.
Trusted by 1+ million students worldwide
1 out of 18
Related Documents


Your All-in-One AI-Powered Toolkit for Academic Success.
+13062052269
info@desklib.com
Available 24*7 on WhatsApp / Email
![[object Object]](/_next/static/media/star-bottom.7253800d.svg)
Unlock your academic potential
Copyright © 2020–2026 A2Z Services. All Rights Reserved. Developed and managed by ZUCOL.