An Analysis of Income Levels and Their Effect on Individual Happiness

Verified

Added on  2020/07/22

|21
|2821
|233
Report
AI Summary
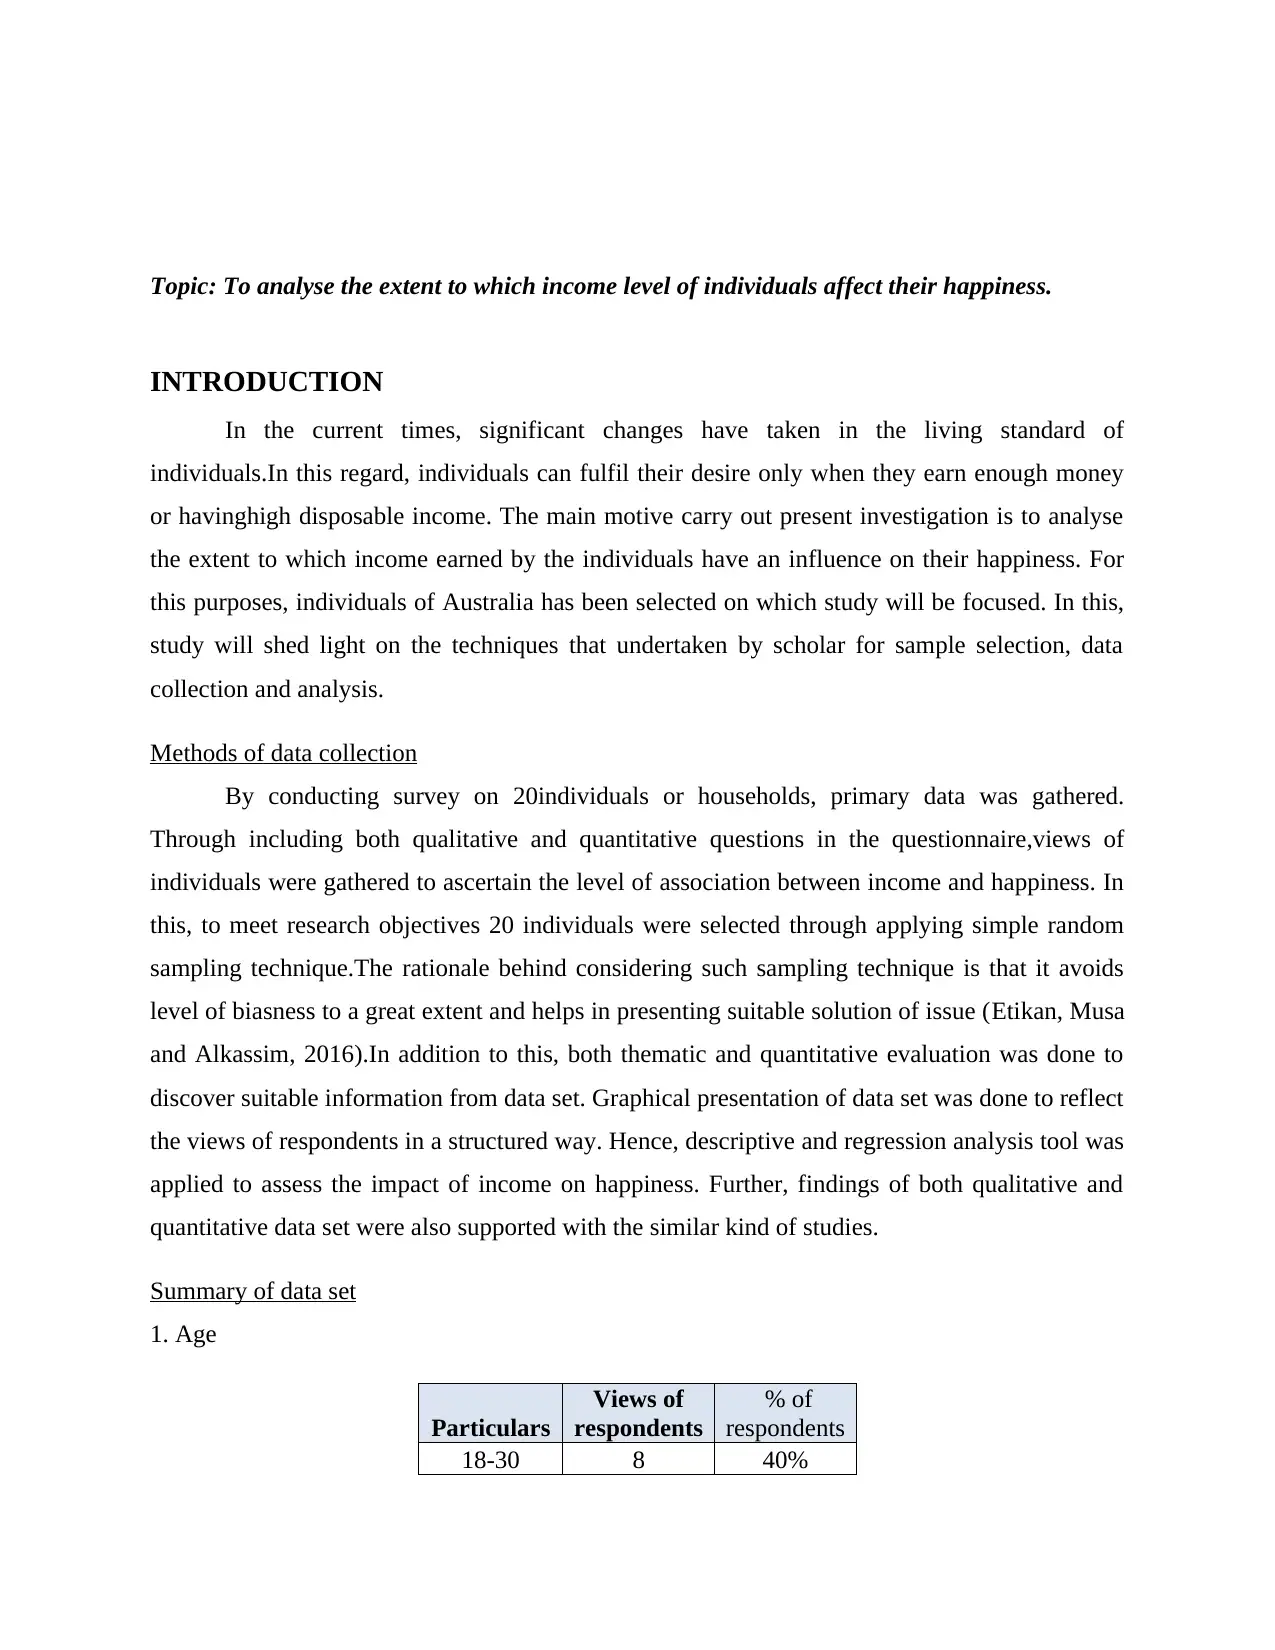
This report investigates the impact of income on individual happiness, focusing on an Australian context. The study employs both primary and secondary data, including a survey of 20 individuals, to analyze the correlation between income levels and happiness. The methodology includes descriptive statistics and regression analysis to assess the relationship. Key findings reveal that a majority of respondents reported being happy with their income. The analysis also acknowledges that factors beyond income, such as stress and work-life balance, significantly influence happiness levels. The report provides detailed data summaries, statistical evaluations, and interpretations, culminating in a conclusion that emphasizes the complex interplay between income and overall well-being, supported by existing research. The report includes an executive summary, introduction, methods of data collection, data set summaries, descriptive statistics, regression analysis, conclusion, recommendations, and references.
Document Page
Income Increase Happiness?
tabler-icon-diamond-filled.svg

Paraphrase This Document

Need a fresh take? Get an instant paraphrase of this document with our AI Paraphraser
Document Page
Executive Summary
In the current investigation, emphasis has been placed by the researcher on analysing the
effect of income on happiness. In addition to this, to address research questions data has been
gathered from both primary and secondary sources. By conducting survey on 20 individuals, data
have been gathered. Descriptive and regression analysis tool has been applied by the researcher
to evaluate research issue. From evaluation, it has assessed that majority of the respondents were
happy from their income. It can be depicted from evaluation that along with the income,
happiness influences from several factors such as stress, improper balance in life etc.
Document Page
TABLE OF CONTENTS
INTRODUCTION...........................................................................................................................1
Methods of data collection...........................................................................................................1
Summary of data set....................................................................................................................1
Descriptive statistics or data analysis........................................................................................10
Simple linear regression............................................................................................................11
CONCLUSION..............................................................................................................................16
RECOMMENDATIONS...............................................................................................................16
REFERENCES..............................................................................................................................17
APPENDIX....................................................................................................................................18
Document Page
Topic: To analyse the extent to which income level of individuals affect their happiness.
INTRODUCTION
In the current times, significant changes have taken in the living standard of
individuals.In this regard, individuals can fulfil their desire only when they earn enough money
or havinghigh disposable income. The main motive carry out present investigation is to analyse
the extent to which income earned by the individuals have an influence on their happiness. For
this purposes, individuals of Australia has been selected on which study will be focused. In this,
study will shed light on the techniques that undertaken by scholar for sample selection, data
collection and analysis.
Methods of data collection
By conducting survey on 20individuals or households, primary data was gathered.
Through including both qualitative and quantitative questions in the questionnaire,views of
individuals were gathered to ascertain the level of association between income and happiness. In
this, to meet research objectives 20 individuals were selected through applying simple random
sampling technique.The rationale behind considering such sampling technique is that it avoids
level of biasness to a great extent and helps in presenting suitable solution of issue (Etikan, Musa
and Alkassim, 2016).In addition to this, both thematic and quantitative evaluation was done to
discover suitable information from data set. Graphical presentation of data set was done to reflect
the views of respondents in a structured way. Hence, descriptive and regression analysis tool was
applied to assess the impact of income on happiness. Further, findings of both qualitative and
quantitative data set were also supported with the similar kind of studies.
Summary of data set
1. Age
Particulars
Views of
respondents
% of
respondents
18-30 8 40%
tabler-icon-diamond-filled.svg

Paraphrase This Document

Need a fresh take? Get an instant paraphrase of this document with our AI Paraphraser
Document Page
31-40 4 20%
41 and
older 8 40%
Total 20 100%
18-30 31-40 41 and older
0%
5%
10%
15%
20%
25%
30%
35%
40%
% of respondents
% of respondents
Interpretation: Graphical presentation shows that 20% respondents fallen within the age
group of 31-40 years. On the other side, 40% individuals having age of 18-30, whereas
remaining 40% accounted for the category of 31 and older.
2. Gender
Particulars
Views of
respondents
% of
respondents
Male 11 55%
Female 9 45%
Total 20 100%
Document Page
Male Female
0%
10%
20%
30%
40%
50%
60%
% of respondents
% of respondents
Interpretation: Outcome of survey shows that majority of the respondents
(approximately 55%) were male and remaining 45% accounted for females.
3. Marital status
Particulars
Views of
respondents
% of
respondents
Single 8 40%
Married 10 50%
Divorced 8 10%
Total 20 100%
Single Married Divorced
0%
5%
10%
15%
20%
25%
30%
35%
40%
45%
50%
% of respondents
% of respondents
Document Page
Interpretation: Tabular presentation exhibits that 50% respondents were married. On the
other side, 40% respondents presented in the survey they were single and remaining 10 %
divorced.
4.Earnings weekly
Particulars
Views of
respondents
% of
respondents
0 - 500
AUD - -
500 - 1000
AUD 10 50%
More than
1000 AUD 10 50%
Total 20 100%
0 - 500 AUD 500 - 1000
AUD More than
1000 AUD
0
0.05
0.1
0.15
0.2
0.25
0.3
0.35
0.4
0.45
0.5
% of respondents
% of respondents
Interpretation: The above depicted graph entails that 50% respondents are earning 500-
1000 AUD weekly. In contrast to this, weekly income of remaining 50% individuals implied for
more than 1000 AUD. Thus, considering such aspect it can be stated that weekly income of
selected respondents were good.
5. Working hours weekly
Particulars Views of respondents % of respondents
Less than 20 - -
20-40 4 20%
tabler-icon-diamond-filled.svg

Paraphrase This Document

Need a fresh take? Get an instant paraphrase of this document with our AI Paraphraser
Document Page
More than 40 16 80%
Total 20 100%
20-40 More than 40
0%
10%
20%
30%
40%
50%
60%
70%
80%
% of respondents
% of respondents
Interpretation: In survey, 80% respondents shared their views that they work for more
than 40 hours in a week. Further, 20% respondents said that they are working 20-40 hours in a
week.
6. Weekly spending on utilities and necessities from income
Particulars Views of respondents % of respondents
Less than 10% 7 35%
10% - 25% 10 50%
25% - 50% 3 15%
More than 50% - -
Total 20 100%
Document Page
Lees than 10% 10% - 25% 25% - 50%
0%
5%
10%
15%
20%
25%
30%
35%
40%
45%
50%
% of respondents
% of respondents
Interpretation:Primary data outcome entails that 50% individuals selected for
investigation spends 10-25% of their income weekly. On the other side, spending of 35%
respondents on utilities and other necessities implies for less than 10%. Further, graphexhibits
that 15% individuals prefer to spend 25-30% of their income on necessities.
7. Weekly savings from income
Particulars Views of respondents % of respondents
Less than 10% 6 30%
10% - 25% 7 35%
25% - 50% 4 20%
More than 50% 3 15%
Total 20 100%
Document Page
Lees than
10% 10% - 25% 25% - 50% More than
50%
0%
5%
10%
15%
20%
25%
30%
35%
% of respondents
% of respondents
Interpretation: By doing primary investigation, it has identified that 35% respondents
tend to make focus on saving 10% to 25% weekly. Out of 20, only 3 individuals stated that their
weekly saving isgreater than 50%. Further, 6 individualsparticipated in survey entails that saving
of them isless thanpertaining to10% of income.On the other hand, weekly savings of 20%
individuals fall within the range of 25 to 50%.
8. Supporting individuals from income
Particulars Views of respondents % of respondents
Yes 10 50%
None 10 50%
Total 20 100%
tabler-icon-diamond-filled.svg

Paraphrase This Document

Need a fresh take? Get an instant paraphrase of this document with our AI Paraphraser
Document Page
Yes None
0%
5%
10%
15%
20%
25%
30%
35%
40%
45%
50%
% of respondents
% of respondents
Interpretation: Graph presented above exhibits that 50% respondents support individuals
from their income, whereas remaining not. It shows that ratio of the outcome generated
pertaining to such question is equal.
9. Income level ensures happiness and comfortable
Particulars Views of respondents % of respondents
Agree 14 70%
Somewhat agree 4 20%
Somewhat disagree 2 10%
Disagree - -
Total 20 100%
Document Page
Agree Somewhat
agree Somewhat
disagree
0%
10%
20%
30%
40%
50%
60%
70%
% of respondents
% of respondents
Interpretation:In survey, 70% agreed with the aspect that income level closely influences
their comfort and happiness. From assessment, it has identified that disposable income of
individuals increase when they earn high. Hence, high income level enables people to meet their
desires on time and live luxurious life (Latif, 2016). Considering the same, 20% respondents also
agreed with the asked statement to some extent. On the contrary to this, 10%people disagreed
with the statementpresented above. Moreover, such individuals believe that needs and wants of
individuals are never satisfied. Further, along with the income there are several other factors
which in turn impacts happiness such as stress, lack of family support etc (Ahuvia, 2018).
10. Individuals are very happy with their income
Particulars Views of respondents % of respondents
Very happy 8 40%
Somewhat happy 8 40%
Neither happy nor unhappy 2 10%
Somewhat unhappy 2 10%
Very unhappy - -
Total 20 100%
chevron_up_icon
1 out of 21
circle_padding
hide_on_mobile
zoom_out_icon
[object Object]