Finance Report: Australian IPO Activities and Performance
VerifiedAdded on 2023/02/01
|12
|2494
|93
Report
AI Summary
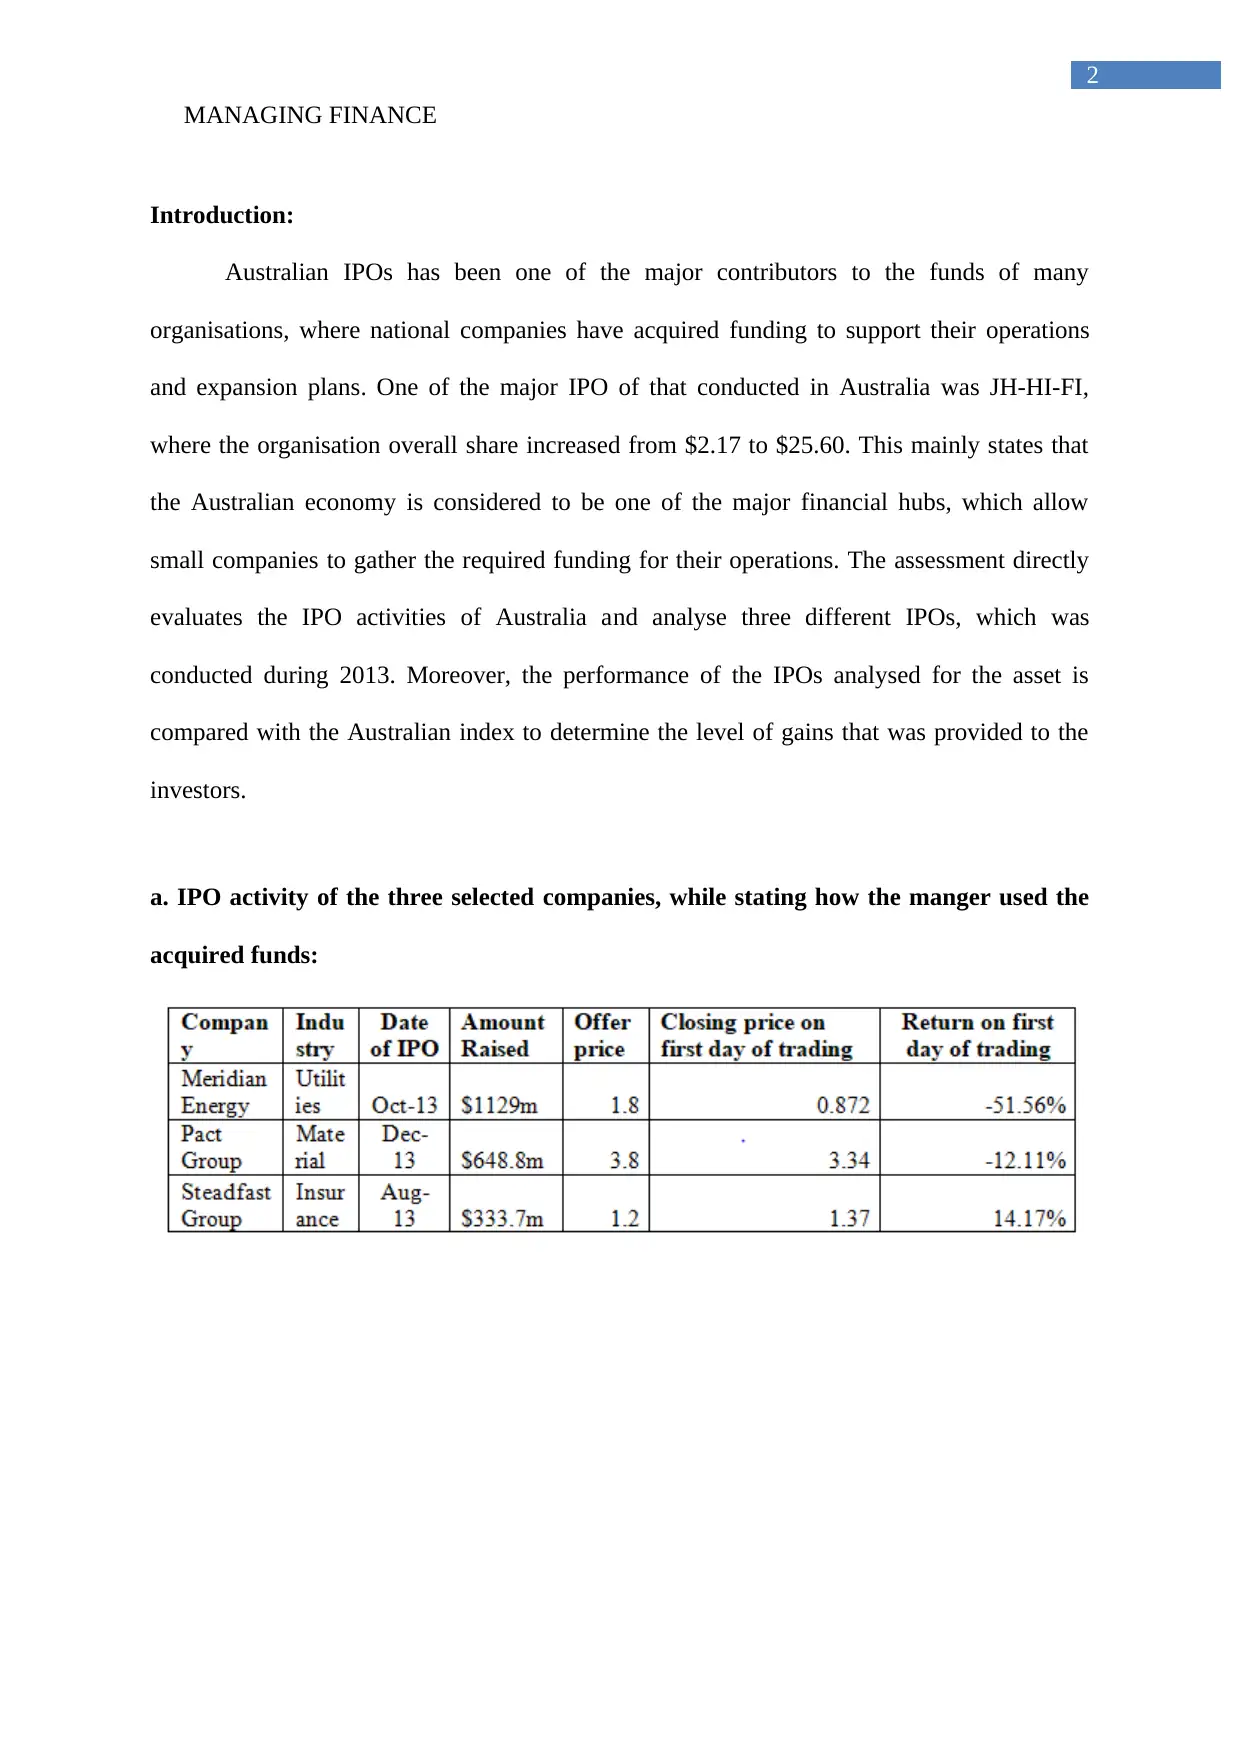
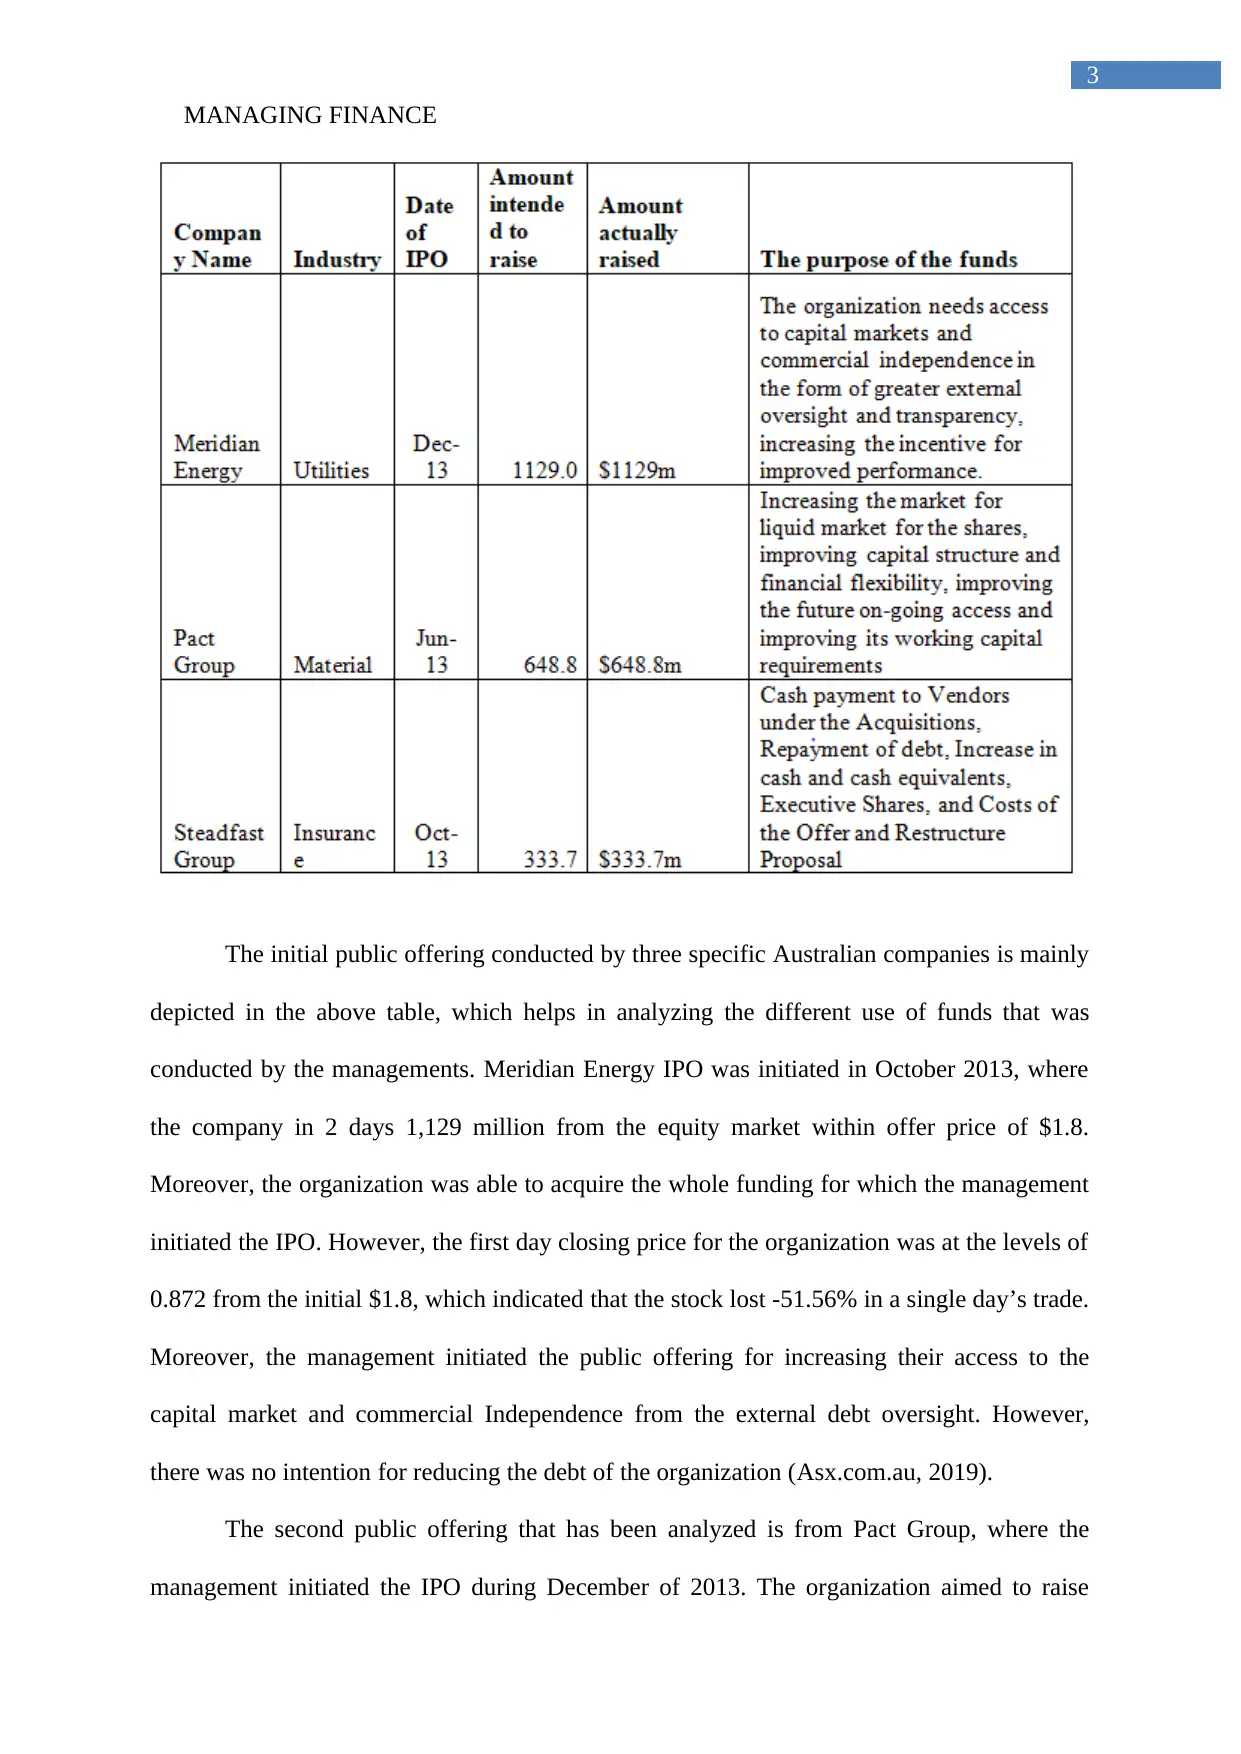
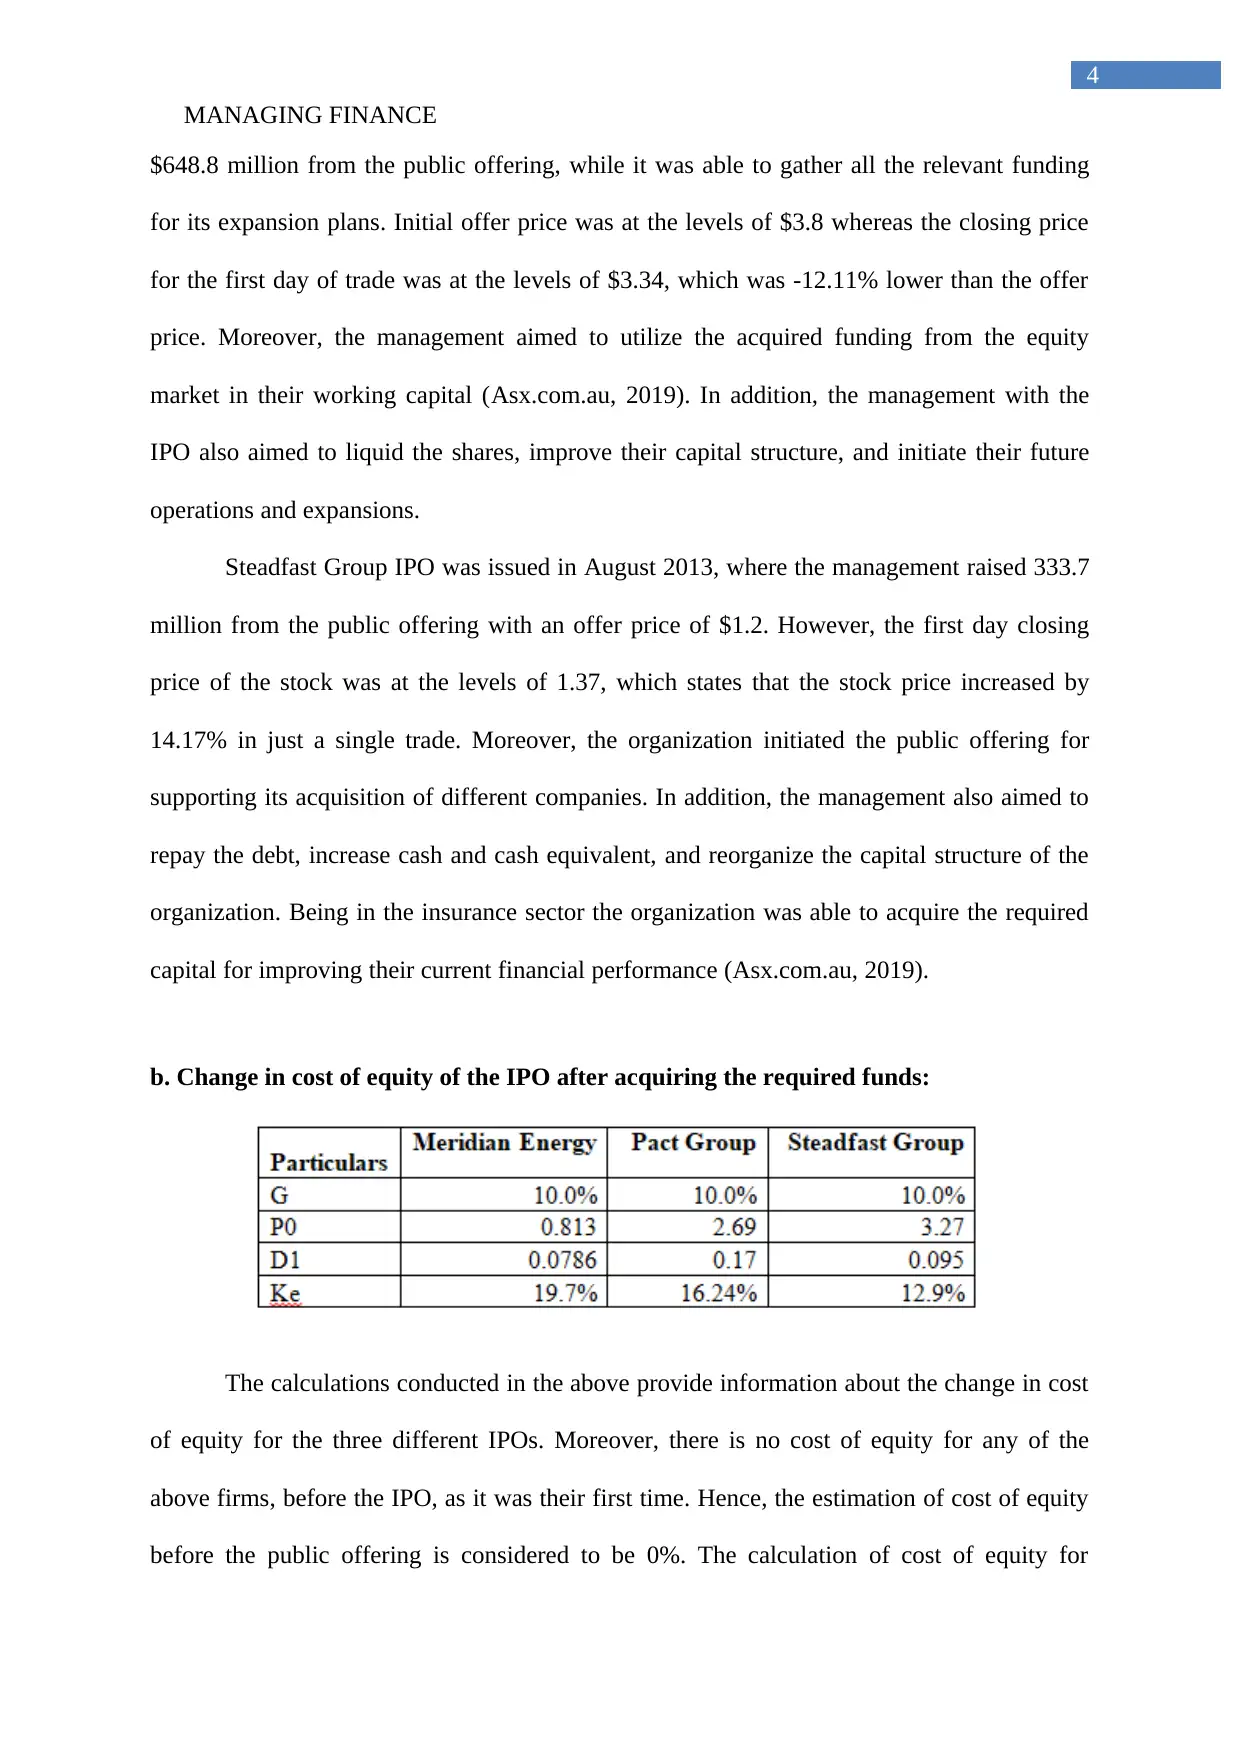
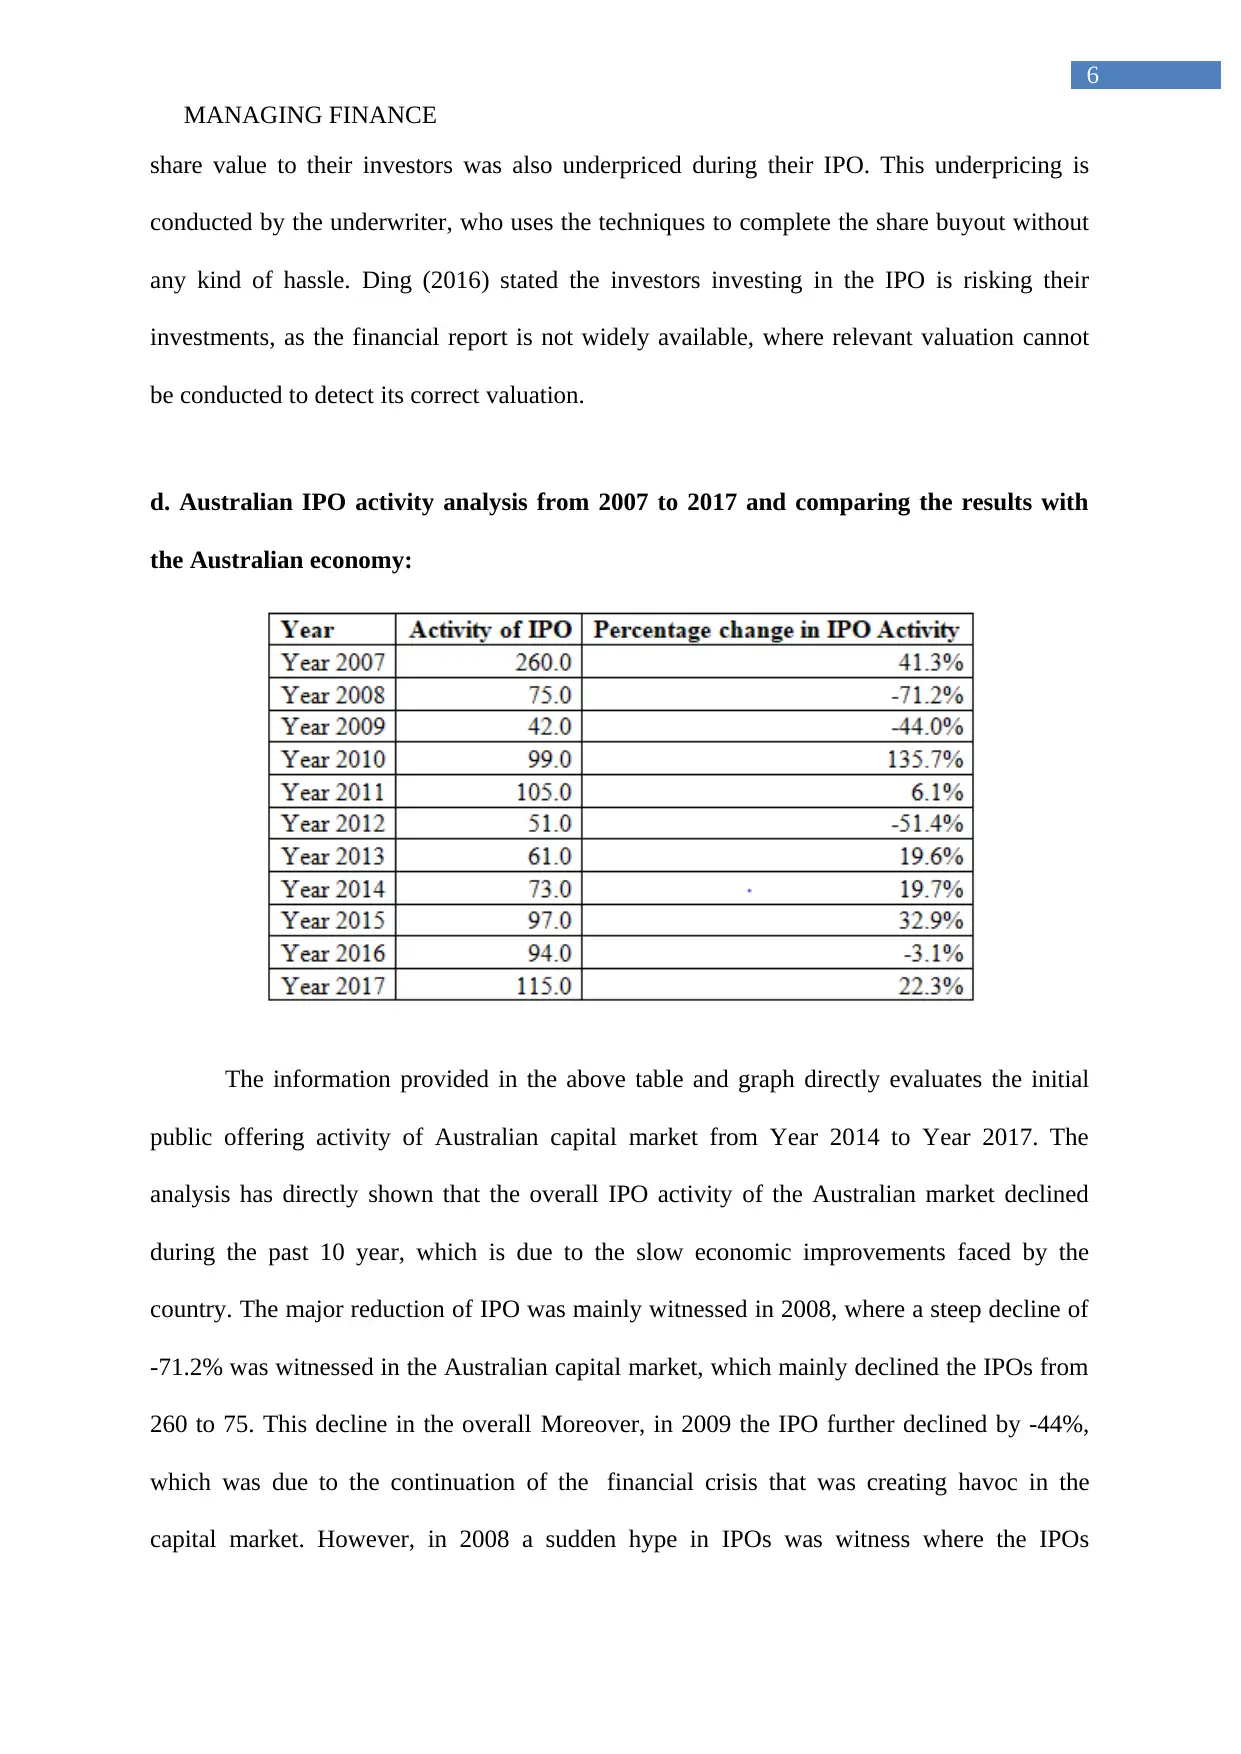
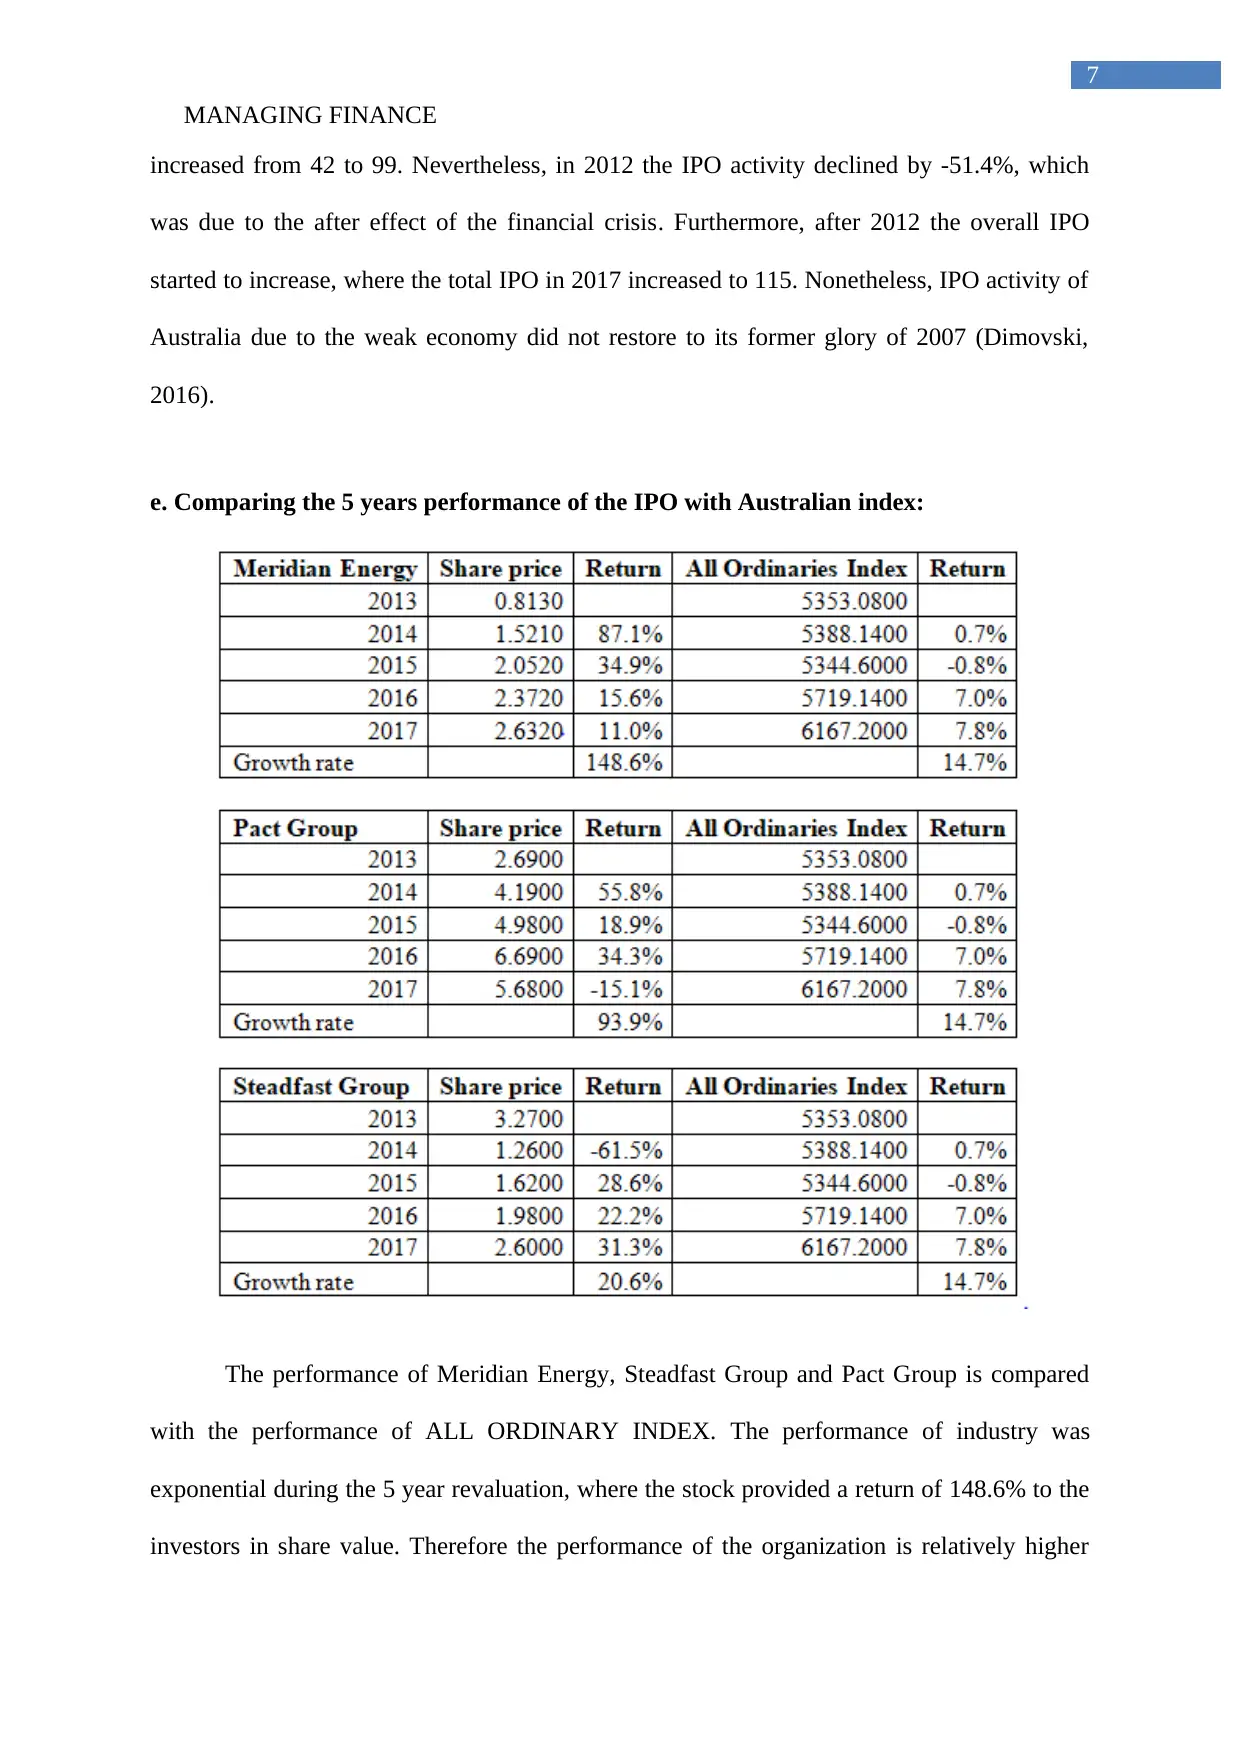
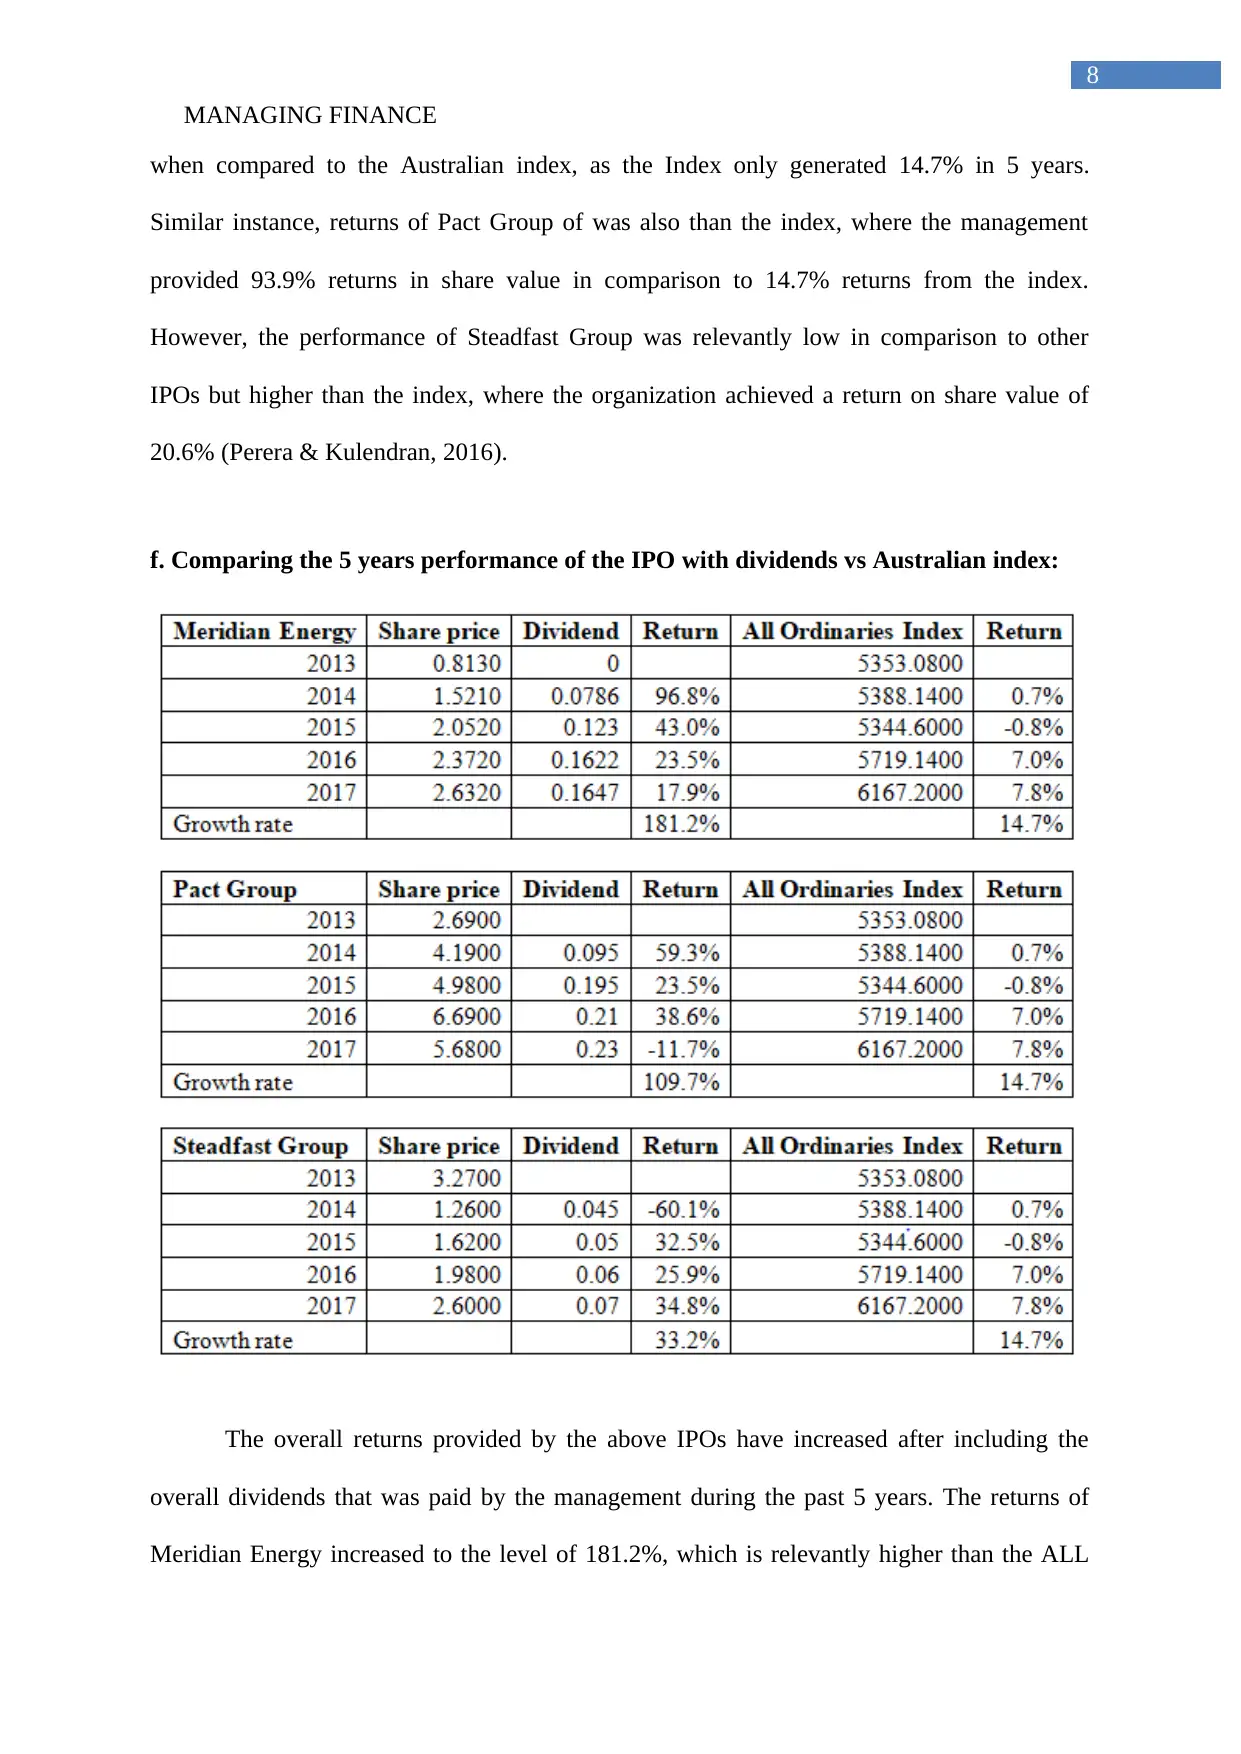
This report provides a comprehensive analysis of Initial Public Offerings (IPOs) in Australia, focusing on the period around 2013. It examines the IPO activities of three specific companies: Meridian Energy, Pact Group, and Steadfast Group, detailing how the management utilized the acquired funds. The report calculates and compares the change in the cost of equity for each IPO after acquiring funds. It also critically discusses the implications of underpricing in IPOs and how it varies across industries. Furthermore, the report analyzes Australian IPO activity from 2007 to 2017, comparing the results with the overall Australian economy. The performance of the selected IPOs is compared with the Australian index over a five-year period, both with and without dividends, to assess their investment returns relative to the broader market. The analysis highlights the role of IPOs in the Australian financial market and provides insights into their performance and financial implications for investors. The report also discusses the overall returns provided by the IPOs after including dividends. The conclusion summarizes the key findings and emphasizes the importance of IPOs and their impact on the market. The report provides an analysis of the three selected IPOs and compares their performance with the Australian index.
Contribute Materials
Your contribution can guide someone’s learning journey. Share your
documents today.

Running head: MANAGING FINANCE
Managing Finance
Name of the Student:
Name of the University:
Authors Note:
Managing Finance
Name of the Student:
Name of the University:
Authors Note:
Secure Best Marks with AI Grader
Need help grading? Try our AI Grader for instant feedback on your assignments.

MANAGING FINANCE
1
Table of Contents
Introduction:...............................................................................................................................2
a. IPO activity of the three selected companies, while stating how the manger used the
acquired funds:...........................................................................................................................2
b. Change in cost of equity of the IPO after acquiring the required funds:...............................4
c. Critically discussing about the implication of the under-pricing and how it changes from
industry to industry:...................................................................................................................5
d. Australian IPO activity analysis from 2007 to 2017 and comparing the results with the
Australian economy:..................................................................................................................6
e. Comparing the 5 years performance of the IPO with Australian index:................................7
f. Comparing the 5 years performance of the IPO with dividends vs Australian index:...........8
Conclusion:................................................................................................................................9
References and Bibliography:..................................................................................................10

MANAGING FINANCE
2
Introduction:
Australian IPOs has been one of the major contributors to the funds of many
organisations, where national companies have acquired funding to support their operations
and expansion plans. One of the major IPO of that conducted in Australia was JH-HI-FI,
where the organisation overall share increased from $2.17 to $25.60. This mainly states that
the Australian economy is considered to be one of the major financial hubs, which allow
small companies to gather the required funding for their operations. The assessment directly
evaluates the IPO activities of Australia and analyse three different IPOs, which was
conducted during 2013. Moreover, the performance of the IPOs analysed for the asset is
compared with the Australian index to determine the level of gains that was provided to the
investors.
a. IPO activity of the three selected companies, while stating how the manger used the
acquired funds:

MANAGING FINANCE
3
The initial public offering conducted by three specific Australian companies is mainly
depicted in the above table, which helps in analyzing the different use of funds that was
conducted by the managements. Meridian Energy IPO was initiated in October 2013, where
the company in 2 days 1,129 million from the equity market within offer price of $1.8.
Moreover, the organization was able to acquire the whole funding for which the management
initiated the IPO. However, the first day closing price for the organization was at the levels of
0.872 from the initial $1.8, which indicated that the stock lost -51.56% in a single day’s trade.
Moreover, the management initiated the public offering for increasing their access to the
capital market and commercial Independence from the external debt oversight. However,
there was no intention for reducing the debt of the organization (Asx.com.au, 2019).
The second public offering that has been analyzed is from Pact Group, where the
management initiated the IPO during December of 2013. The organization aimed to raise
Secure Best Marks with AI Grader
Need help grading? Try our AI Grader for instant feedback on your assignments.

MANAGING FINANCE
4
$648.8 million from the public offering, while it was able to gather all the relevant funding
for its expansion plans. Initial offer price was at the levels of $3.8 whereas the closing price
for the first day of trade was at the levels of $3.34, which was -12.11% lower than the offer
price. Moreover, the management aimed to utilize the acquired funding from the equity
market in their working capital (Asx.com.au, 2019). In addition, the management with the
IPO also aimed to liquid the shares, improve their capital structure, and initiate their future
operations and expansions.
Steadfast Group IPO was issued in August 2013, where the management raised 333.7
million from the public offering with an offer price of $1.2. However, the first day closing
price of the stock was at the levels of 1.37, which states that the stock price increased by
14.17% in just a single trade. Moreover, the organization initiated the public offering for
supporting its acquisition of different companies. In addition, the management also aimed to
repay the debt, increase cash and cash equivalent, and reorganize the capital structure of the
organization. Being in the insurance sector the organization was able to acquire the required
capital for improving their current financial performance (Asx.com.au, 2019).
b. Change in cost of equity of the IPO after acquiring the required funds:
The calculations conducted in the above provide information about the change in cost
of equity for the three different IPOs. Moreover, there is no cost of equity for any of the
above firms, before the IPO, as it was their first time. Hence, the estimation of cost of equity
before the public offering is considered to be 0%. The calculation of cost of equity for

MANAGING FINANCE
5
Meridian Energy is at the levels of 19.7%, which is due to the low dividends made by the
organization to the investors. In addition, the cost of equity for Pact Group is at the levels of
16.24%, which is due to the demands of returns from investors. Furthermore, the calculation
also evaluates the cost of capital for Steadfast Group, which is mainly at the levels of 12.9%,
as the organization’s overall expected divided is lower in comparison to its share price. Dutta
(2016) stated that with the help of cost of equity investors are able to detect the accurate level
of returns that needs to be provided by the organization. Henceforth, the analysis directly
states that the overall cost of equity of each IPO has increased after the inclusion of the equity
capital in their capital structure.
c. Critically discussing about the implication of the under-pricing and how it changes
from industry to industry:
There is a direct link between underpricing and initial public offering, which directly
allows the investors to obtain abnormal gains from their Investments. The Australian
economy is considered to be a financial hub where organizations are able to acquire the
required funding from there IPOs. However, the presence of underpricing of shares is still
present in maximum of the economy is around the world, as it allows the organization to
attract more investors and complete their fundraising activity. The underpricing activity does
not vary significantly from industry to industry, as the study conducted in US stated. The
study in USA indicated that there is underpricing conducted on majority of the IPOs, as the
researcher evaluated 8000 IPOs Conducted in the US economy.
The Australia economy is witnessed to have an average 16.6% reduction in their offer
price, which is a major proof of the existence of underpricing activity. Moreover, in USA the
underpricing levels are at 18%, where each IPO needs to be underpriced for attracting more
investors to the offering. IPO like JB-Hi-Fi current producing a return of more than 1800% in

MANAGING FINANCE
6
share value to their investors was also underpriced during their IPO. This underpricing is
conducted by the underwriter, who uses the techniques to complete the share buyout without
any kind of hassle. Ding (2016) stated the investors investing in the IPO is risking their
investments, as the financial report is not widely available, where relevant valuation cannot
be conducted to detect its correct valuation.
d. Australian IPO activity analysis from 2007 to 2017 and comparing the results with
the Australian economy:
The information provided in the above table and graph directly evaluates the initial
public offering activity of Australian capital market from Year 2014 to Year 2017. The
analysis has directly shown that the overall IPO activity of the Australian market declined
during the past 10 year, which is due to the slow economic improvements faced by the
country. The major reduction of IPO was mainly witnessed in 2008, where a steep decline of
-71.2% was witnessed in the Australian capital market, which mainly declined the IPOs from
260 to 75. This decline in the overall Moreover, in 2009 the IPO further declined by -44%,
which was due to the continuation of the financial crisis that was creating havoc in the
capital market. However, in 2008 a sudden hype in IPOs was witness where the IPOs
Paraphrase This Document
Need a fresh take? Get an instant paraphrase of this document with our AI Paraphraser

MANAGING FINANCE
7
increased from 42 to 99. Nevertheless, in 2012 the IPO activity declined by -51.4%, which
was due to the after effect of the financial crisis. Furthermore, after 2012 the overall IPO
started to increase, where the total IPO in 2017 increased to 115. Nonetheless, IPO activity of
Australia due to the weak economy did not restore to its former glory of 2007 (Dimovski,
2016).
e. Comparing the 5 years performance of the IPO with Australian index:
The performance of Meridian Energy, Steadfast Group and Pact Group is compared
with the performance of ALL ORDINARY INDEX. The performance of industry was
exponential during the 5 year revaluation, where the stock provided a return of 148.6% to the
investors in share value. Therefore the performance of the organization is relatively higher

MANAGING FINANCE
8
when compared to the Australian index, as the Index only generated 14.7% in 5 years.
Similar instance, returns of Pact Group of was also than the index, where the management
provided 93.9% returns in share value in comparison to 14.7% returns from the index.
However, the performance of Steadfast Group was relevantly low in comparison to other
IPOs but higher than the index, where the organization achieved a return on share value of
20.6% (Perera & Kulendran, 2016).
f. Comparing the 5 years performance of the IPO with dividends vs Australian index:
The overall returns provided by the above IPOs have increased after including the
overall dividends that was paid by the management during the past 5 years. The returns of
Meridian Energy increased to the level of 181.2%, which is relevantly higher than the ALL

MANAGING FINANCE
9
ORDINARY INDEX. Moreover, the returns of Pact Group reached to the levels of 109.7%,
while Steadfast Group provide a return of 33.2% to their investors in share value after their
IPOs. Therefore, it is estimated that after the inclusion of the dividends provided by the IPO
companies their overall returns increased and was higher than the Australian index
(Chatalova, How & Verhoeven, 2016).
Conclusion:
The analysis of the assessment has mainly indicated that IPOs all around the world ae
under-priced for attracting more investors, as it helps in acquiring the required funds for
operations. In addition, the analysis of Meridian Energy, Steadfast Group and Pact Group has
indicated that the IPOs have provided higher returns to the investors in the long run.
Secure Best Marks with AI Grader
Need help grading? Try our AI Grader for instant feedback on your assignments.

MANAGING FINANCE
10
References and Bibliography:
Alanazi, A. S., Liu, B., & Al-Zoubi, H. A. (2016). IPO underpricing in supply and demand
framework: evidence from a market of retailers. Applied Economics, 48(60), 5835-
5849.
Alhadab, M. M. (2016). IPO underpricing and audit quality: Evidence from the alternative
investment market in the UK. Corporate Board: Role, Duties and Composition, 104.
Asx.com.au. (2019). Asx.com.au. Retrieved 28 April 2019, from https://www.asx.com.au/
Bédard, J., Coulombe, D., & Courteau, L. (2016). The credibility of earnings forecasts in IPO
prospectuses and underpricing. Accounting Perspectives, 15(4), 235-267.
Bird, R., & Ajmal, H. (2016). Mispricing of Australian IPOs. JASSA, (1), 27.
Boulanouar, Z., & Alqahtani, F. (2016). IPO underpricing in the insurance industry and the
effect of Sharia compliance: Evidence from Saudi Arabian market. International
Journal of Islamic and Middle Eastern Finance and Management, 9(3), 314-332.
Chatalova, N., How, J. C., & Verhoeven, P. (2016). Analyst coverage and IPO management
forecasts. Journal of Corporate Finance, 39, 263-277.
Dimovski, B. (2016). Differences in underpricing of A-REIT IPOs and Australian property
company IPOs. Journal of Property Investment & Finance, 34(2), 107-115.
Ding, R. (2016). Disclosure of Downside Risk and Investors' Use of Qualitative Information:
Evidence from the IPO Prospectus's Risk Factor Section. International Review of
Finance, 16(1), 73-126.

MANAGING FINANCE
11
Dutta, A. (2016). Reassessing the long-term performance of Indian IPOs. Journal of Statistics
and Management Systems, 19(1), 141-150.
Esfahanipour, A., Goodarzi, M., & Jahanbin, R. (2016). Analysis and forecasting of IPO
underpricing. Neural Computing and Applications, 27(3), 651-658.
Fitza, M., & Dean, T. J. (2016). How much do VCS and underwriters matter? A comparative
investigation of venture capitalist and underwriter effects on IPO
underpricing. Venture Capital, 18(2), 95-114.
Mumtaz, M. Z., Smith, Z. A., & Maqsood, A. (2016). An examination of short-run
performance of IPOs using Extreme Bounds Analysis. Estudios de Economía, 43(1).
Otchere, I., & Vong, A. P. (2016). Venture capitalist participation and the performance of
Chinese IPOs. Emerging Markets Review, 29, 226-245.
Perera, W., & Kulendran, N. (2016). New evidence of short-run underpricing in Australian
IPOs. Investment Management and Financial Innovations, 13(2), 99-108.
Sieradzki, R., & Zasępa, P. (2016). Underpricing of Private Equity/Venture Capital Backed
Ipos. Do they Differ from Other Offers?. Argumenta Oeconomica, (1 (36)), 261-289.
1 out of 12
Related Documents

Your All-in-One AI-Powered Toolkit for Academic Success.
+13062052269
info@desklib.com
Available 24*7 on WhatsApp / Email
Unlock your academic potential
© 2024 | Zucol Services PVT LTD | All rights reserved.