Finance Report: Descriptive Analysis of Australian IPO Market

Verified

Added on  2021/05/31

|16
|3772
|14
Report
AI Summary
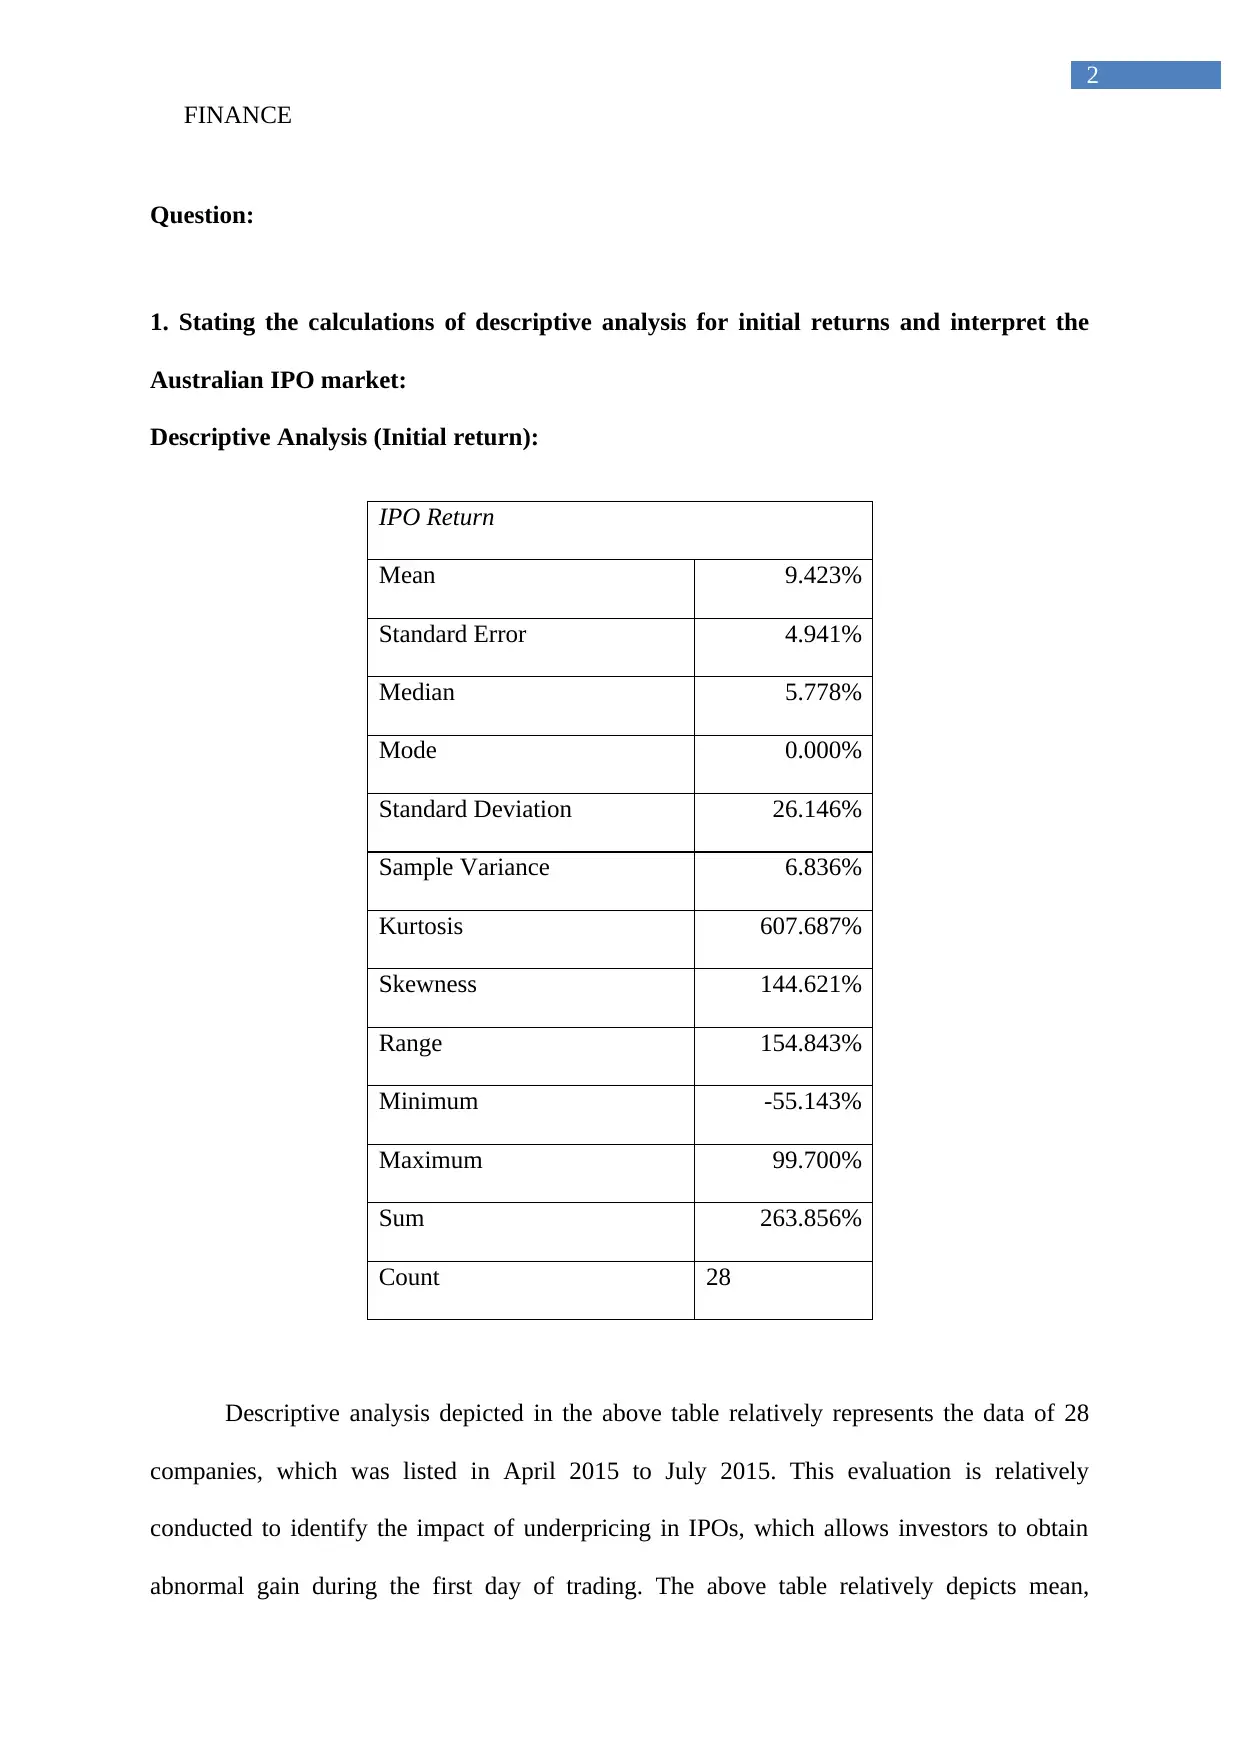
This finance report provides a detailed analysis of the Australian IPO market. It begins with a descriptive analysis of initial returns, examining the performance of companies listed between April and July 2015, and interprets the impact of underpricing on investor gains. The report calculates the Holding Period Return (HPR) to assess the long-run IPO performance and evaluates the returns of financial sector companies from 2015 to 2017. Furthermore, it explores the theories and empirical studies related to short-run IPO underpricing in the US and Australia, focusing on asymmetric information and behavioral theories. The analysis includes sector-specific descriptive statistics and a comparison of returns, volatility, and risk involved in IPO investments, concluding that IPO investments in the Australian market could be risky and may not always provide high returns. The report emphasizes the importance of evaluating investments before participating in IPO initiations.
Document Page
Running head: FINANCE
Finance
Name of the Student:
Name of the University:
Authors Note:
tabler-icon-diamond-filled.svg

Paraphrase This Document

Need a fresh take? Get an instant paraphrase of this document with our AI Paraphraser
Document Page
FINANCE
1
Table of Contents
Question:....................................................................................................................................2
1. Stating the calculations of descriptive analysis for initial returns and interpret the
Australian IPO market:..............................................................................................................2
2. Calculating HPR of percentage return on the long run IPO performance:..........................11
3. Analysing different theories and empirical study for identifying the occurrence of short run
IPO under-pricing in US and Australia:...................................................................................12
Reference and Bibliography:....................................................................................................15
Document Page
FINANCE
2
Question:
1. Stating the calculations of descriptive analysis for initial returns and interpret the
Australian IPO market:
Descriptive Analysis (Initial return):
IPO Return
Mean 9.423%
Standard Error 4.941%
Median 5.778%
Mode 0.000%
Standard Deviation 26.146%
Sample Variance 6.836%
Kurtosis 607.687%
Skewness 144.621%
Range 154.843%
Minimum -55.143%
Maximum 99.700%
Sum 263.856%
Count 28
Descriptive analysis depicted in the above table relatively represents the data of 28
companies, which was listed in April 2015 to July 2015. This evaluation is relatively
conducted to identify the impact of underpricing in IPOs, which allows investors to obtain
abnormal gain during the first day of trading. The above table relatively depicts mean,
Document Page
FINANCE
3
median, and standard deviation of the returns generated on the day of IPO initiation.
Moreover, from the calculation it is detected that the Companies listed in Australian Stock
Exchange provided 9.423% average returns. During this period, the median generated from
the returns fees at the levels of 5.778%, which indicates that 50% of the IPO returns during
the first day was more than 5.778%. Furthermore, from the descriptive analysis the risk
involved in IPO reading is also detected, where the standard deviation is at the levels of
26.146%. This is relatively indicates that the return generation capacity of IPO is higher but
the risk attributes of the investment is also high. This relevant evaluation indicates that
investments in IPOs could eventually allow investors to generate higher rate of return from
investment for a short duration. In addition, the volatility identified in IPOs indicates the
presence of underpricing in the Australian market, which would benefit investors to generate
higher rate of return from Investments. Kotlar et al. (2017) mentioned that investors during
the IPO initiation are able to acquire stocks with low share valuation, which could eventually
help them increase the returns from investment.
1ST
AER
ALI
AYS
CGC
FFT
GDF
GTY
KSL
MUA
NCL
PPL
RFN
SLC
-80.0000%
-60.0000%
-40.0000%
-20.0000%
0.0000%
20.0000%
40.0000%
60.0000%
80.0000%
100.0000%
120.0000%
Return %
The returns provided by the 28 IPOs in the first day of trading are depicted in the
above figure, where the returns that could allow investors to generate higher income from
investment are effectively identified. However, the evaluation relatively indicates that the
first day trading would only benefit some investors as maximum of the IPS got losses or low
tabler-icon-diamond-filled.svg

Paraphrase This Document

Need a fresh take? Get an instant paraphrase of this document with our AI Paraphraser
Document Page
FINANCE
4
returns on the first day of trading. This relatively indicates inconsistency of the returns that is
provided by IPO companies, while it increases risk from investments for the investors
(Boulton, Smart and Zutter 2017).
With the relevant assumptions in the assessment, the overall analysis is being
conducted for different sectors that are listed in ASX stock market. The descriptive analysis
of only those sector is being conducted who has more than one stocks listed in the IPO
section. The sector with no more than one stock is ignored as the output from the analysis
would be weak and portray wrong results to the investors. Consumer staples, Industrials, and
Utilities sector is not evaluated in the descriptive analysis, as results will not portray accurate
output and will be vague due to low data (Khurana, Ni and Shi 2017). Descriptive analysis on
different GICS sector is depicted as follows.
Descriptive analysis (Consumer Discretionary):
Consumer Discretionary
Mean 9.931%
Standard Error 1.888%
Median 9.208%
Mode #N/A
Standard Deviation 3.777%
Sample Variance 0.143%
Kurtosis 37.116%
Skewness 93.546%
Range 8.692%
Minimum 6.308%
Maximum 15.000%
Document Page
FINANCE
5
Sum 39.724%
Count 4
From the calculation, the average returns provided by the consumer discretionary
sector is at the levels of 9.931%, with overall standard deviation of 3.777 %. This relatively
indicates that the returns provided by the sector are higher than the risk involved in
Investments. Therefore investors could eventually utilise this opportunity to generate higher
rate of return from the IPO initiation, which is conducted by consumer discretionary sector.
Furthermore, the median of 9.208% relatively indicates that 50% of the companies listed for
the IPOs issued during April 2015 to July 2015 generated returns higher than median value.
This relatively indicates that investors could use the opportunity to investment during the IPO
initiation to generate higher rate of return while reducing the risk from investment (Beck
2017).
Descriptive Analysis (Financials):
Financials
Mean 17.018%
Standard Error 11.842%
Median 9.935%
Mode #N/A
Standard Deviation 29.008%
Sample Variance 8.415%
Kurtosis 78.157%
Skewness 105.673%
Document Page
FINANCE
6
Range 79.348%
Minimum -12.681%
Maximum 66.667%
Sum 102.105%
Count 6
The descriptive analysis conducted on financial sector relatively indicated a total
mean of 17.018%, which indicates that the average returns provided by the IPO conducted in
the sector. Moreover, the standard deviation of the stocks listed during April 2015 to July
2015 is at the levels of 29.008 %, which is comparatively two other investment sectors.
Furthermore, the median value generated from the RTO initiation is at the levels of 9.935%,
which indicates that 50% of the IPO stocks listed in ASX stock have provided higher returns
from the median. This descriptive analysis directly evaluates stocks of the IPO companies,
which are related to financial sector and could provide investors with high rate of return
(Nielsson and Wójcik 2016).
Descriptive Analysis (Healthcare):
Health Care
Mean -12.536%
Standard Error 14.321%
Median -0.500%
Mode #N/A
Standard Deviation 28.642%
Sample Variance 8.204%
tabler-icon-diamond-filled.svg

Paraphrase This Document

Need a fresh take? Get an instant paraphrase of this document with our AI Paraphraser
Document Page
FINANCE
7
Kurtosis 366.862%
Skewness -190.205%
Range 61.143%
Minimum -55.143%
Maximum 6.000%
Sum -50.143%
Count 4
The Healthcare sector relatively value a stock, which eventually helps in identifying
the return and risk involved in the IPO initiation. The descriptive analysis relatively indicates
that average returns provided from healthcare sector during the first day of trading is at the
levels of -12.536%, which relatively and negative returns provided by the companies.
Moreover, the Standard deviation is at the levels of 28.64 to percentage with a median of -
0.500% this relatively indicates that 50% of the stocks listed in the IPO have generated
returns less than -0.500% during the first day of trading. Therefore, from the valuation of the
descriptive analysis it could be identified that Healthcare sector does not provide adequate
returns to the investor on the day of initial public offering. On the other hand, investors
should ignore the investments conducted on eyebrows of Healthcare sector to minimise the
losses from Investments. Francis (2017) argued that due to the involvement of external
factors the risk attributes in investments really increases while reducing the profits that could
be generated from investment.
Descriptive Analysis (Information Technology):
Information Technology
Document Page
FINANCE
8
Mean 8.969%
Standard Error 5.519%
Median 6.621%
Mode #N/A
Standard Deviation 13.520%
Sample Variance 1.828%
Kurtosis -9.907%
Skewness 55.286%
Range 38.000%
Minimum -8.000%
Maximum 30.000%
Sum 53.813%
Count 6
Descriptive analysis of Information Technology Sector relatively in uses 6 different
IPS conducted during April 2015 to July 2015. The relative period used for the analysis as
provided a standard deviation of 13.520% with average returns of 8.969%. This relatively
indicates that Return and risk attribute of Information Technology Sector companies is
adequate, which would allow investors to generate higher rate of returns. Moreover, the
median value is at the levels of 6.621%, which indicates that 50% of the stocks have provided
higher returns from the median value. This relatively indicates a positive investment
opportunity for investors, as the risk attribute is relatively low while the returns high. In this
context, Daniel (2017) stated that with the help of risk and return attribute investors are able
to formulate their portfolio which has low risk and high return investment.
Document Page
FINANCE
9
Descriptive Analysis (Real Estate):
Real Estate
Mean 2.800%
Standard Error 0.300%
Median 2.800%
Mode #N/A
Standard Deviation 0.424%
Sample Variance 0.002%
Kurtosis #DIV/0!
Skewness #DIV/0!
Range 0.600%
Minimum 2.500%
Maximum 3.100%
Sum 5.600%
Count 2
The descriptive statistics of real estate sector indicates the change in return generation
capacity of the companies during the IPO initiation. There are only two companies evaluated
for the assessment, real estate sector companies were not listed during April 2015 to July
2015. From the relevant evaluation it could be identified that average returns provided by the
stock is at the level of 2.800 % it is at the levels of 0.424%. Moreover, the median value is at
is at the levels of 2.800%, as only 2 stock is been used in the descriptive analysis (Wong and
Ting 2017).
Descriptive Analysis (Telecommunications Services):
tabler-icon-diamond-filled.svg

Paraphrase This Document

Need a fresh take? Get an instant paraphrase of this document with our AI Paraphraser
Document Page
FINANCE
10
Telecommunication Services
Mean 35.085%
Standard Error 32.347%
Median 5.556%
Mode #N/A
Standard Deviation 56.027%
Sample Variance 31.390%
Kurtosis #DIV/0!
Skewness 171.291%
Range 99.700%
Minimum 0.000%
Maximum 99.700%
Sum 105.256%
Count 3
With the use of Telecommunication, descriptive analysis the overall average returns
of 35.085% from the sector could be identified. The evaluation also indicated that the median
value is at the levels of 5.556%, which indicates that 50% of the stocks have provided higher
returns than the median value. On the other hand, the standard deviation is also at the levels
of 56.027%, which relatively indicates the high risk involved in investment. Evaluation of the
telecommunication service sector directly indicates that investments provide both high risk
and returns to the investors. Therefore, investors need to evaluate the investments before
completing the buying process during the IPO initiation (Qiming, Hui and Li 2017).
Document Page
FINANCE
11
2. Calculating HPR of percentage return on the long run IPO performance:
ASX Code Company Name Close price Price (2 years) HPR
AFG Australian Finance Group Ltd 1.38 1.34 -2.899%
ALI
Argo Global Listed Infrastructure
Limited 2.00 2.00 0.000%
ECX Eclipx Group Limited 2.30 3.78 64.348%
IQ3 IQ3CORP Limited 0.30 0.29 -3.333%
KSL Kina Securities Limited 1.00 0.77 -23.000%
WDE Wealth Defender Equities Limited 1.00 0.79 -21.500%
^AORD All Ordinary Index 5,869.700 5,773.900 -1.63%
AFG ALI ECX IQ3 KSL WDE ^AORD
-30.000%
-20.000%
-10.000%
0.000%
10.000%
20.000%
30.000%
40.000%
50.000%
60.000%
70.000%
HPR-2 years
The above table and graph relatively represents the returns of financial sector
companies from 2015 to 2017. The holding period return is a relatively calculated for the
above message sector identifying the viability of IPO and the return that it could provide to
investors. From the valuation it is indicated that maximum of the financial sector stocks has
lost ground in 2 years as compared to the initial close price of first day trade. This relatively
chevron_up_icon
1 out of 16
circle_padding
hide_on_mobile
zoom_out_icon
[object Object]