FIN205 Business Finance Project: Australian Market and Stock Analysis

Verified

Added on  2023/06/04

|15
|2942
|309
Report
AI Summary
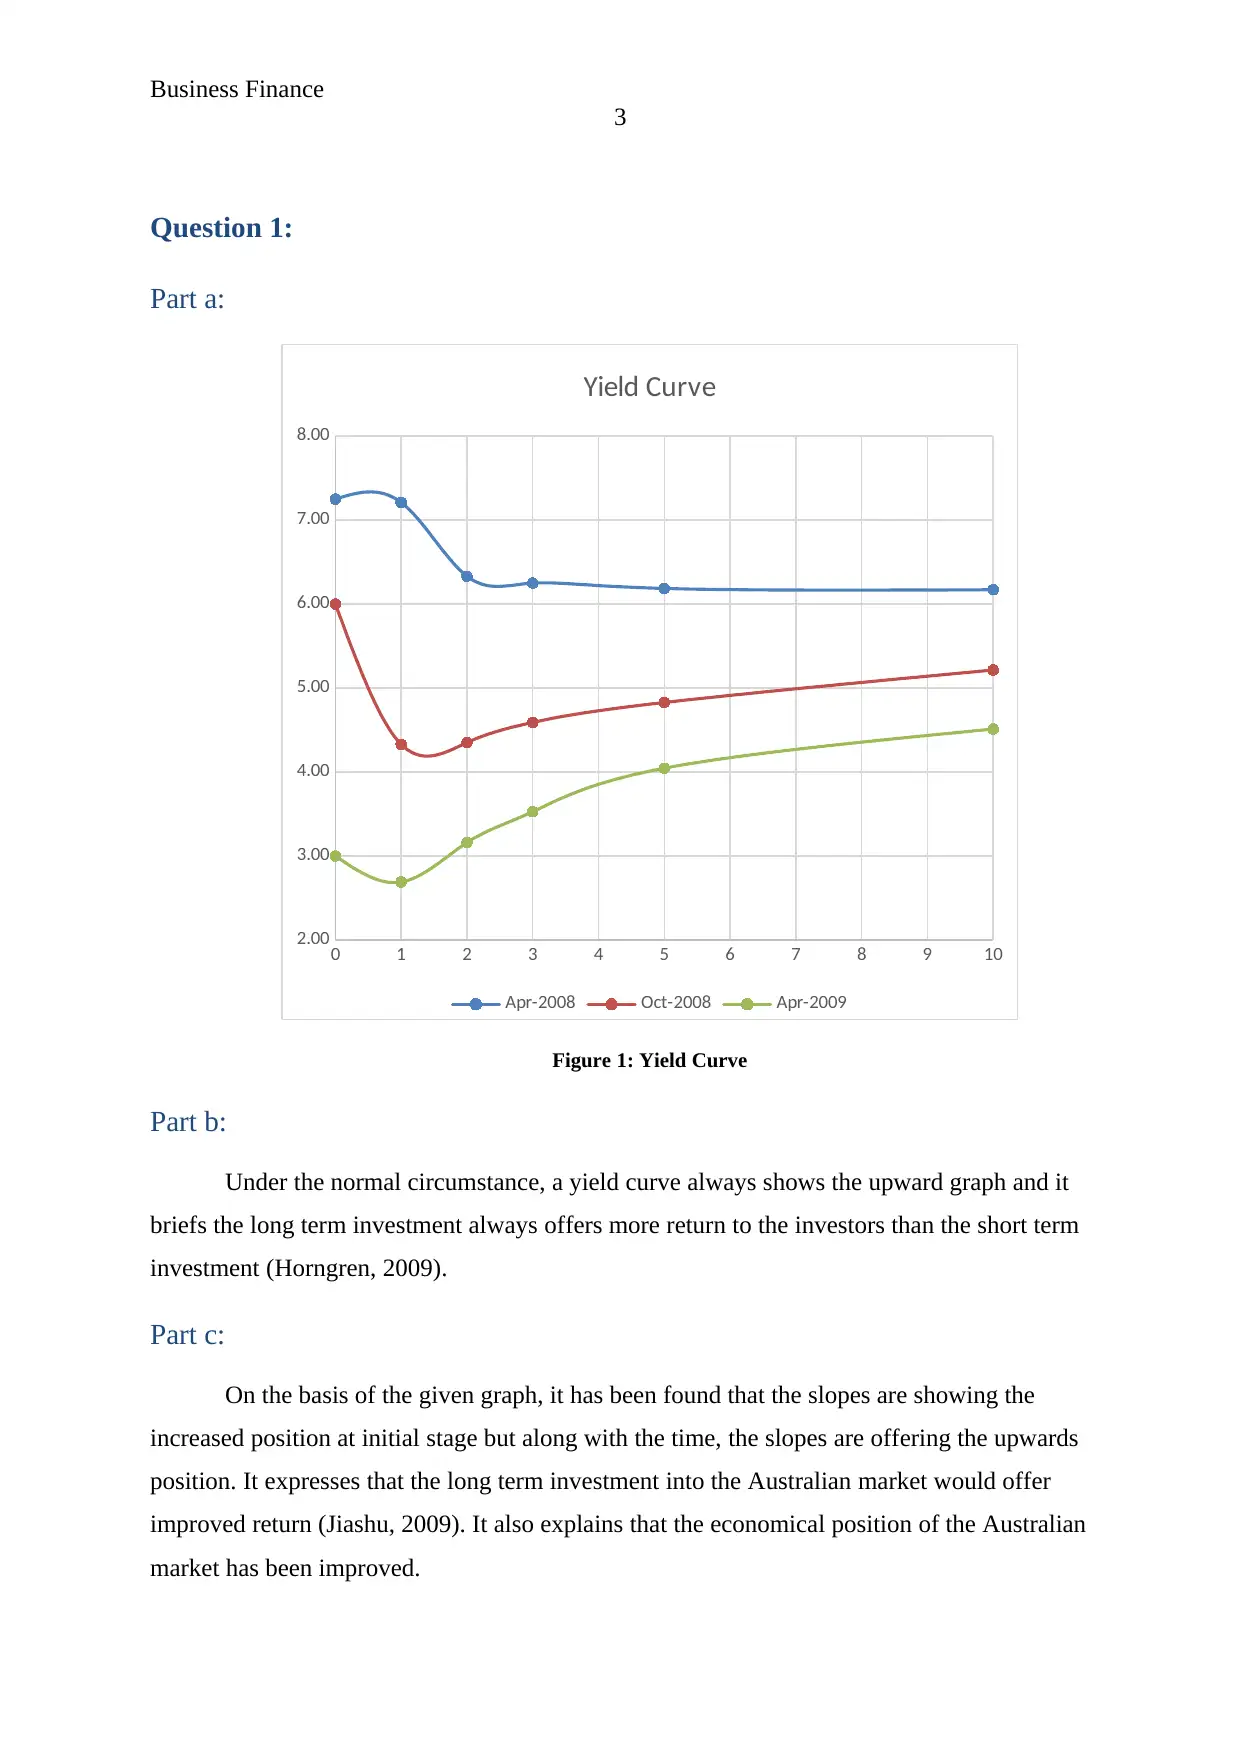
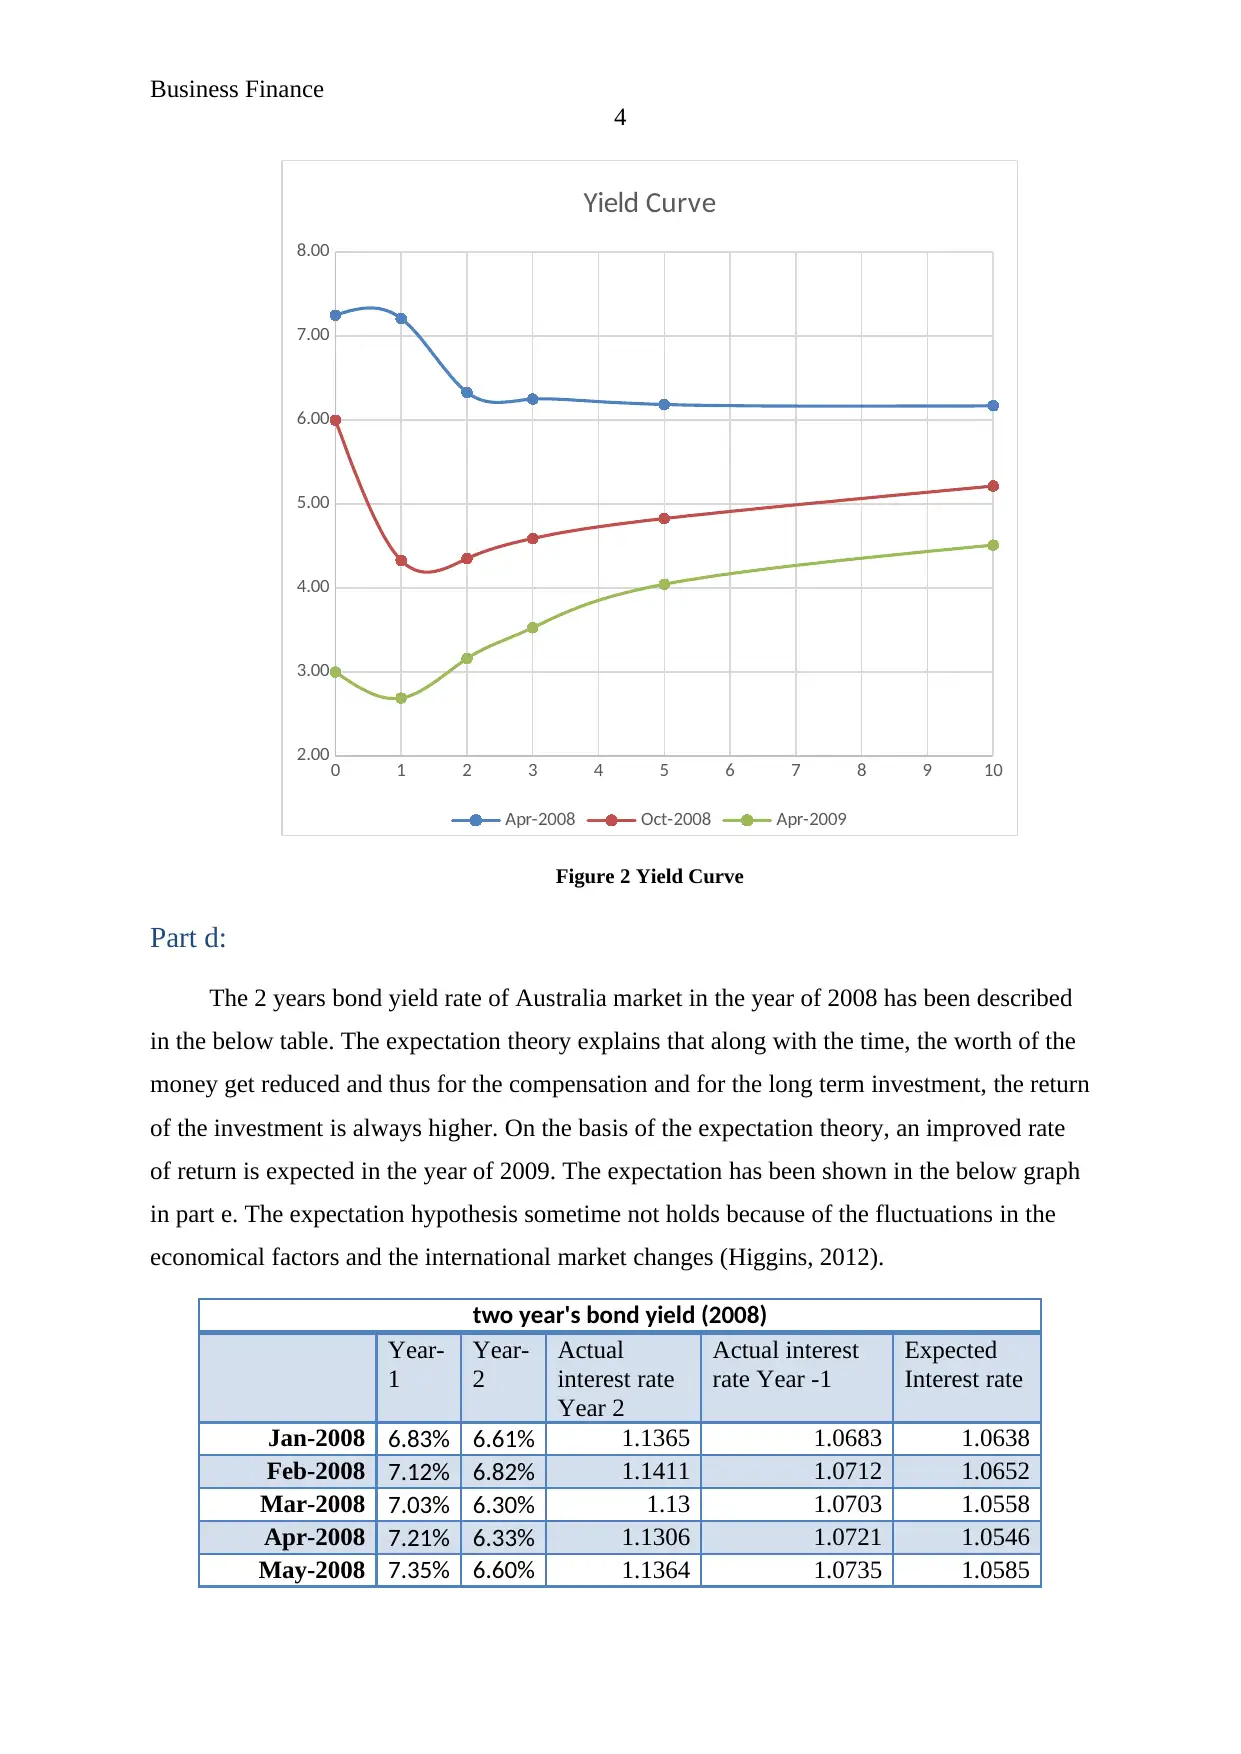
This report provides a comprehensive analysis of business finance concepts, focusing on the Australian market. It begins with an examination of the yield curve, interpreting its shape and relating it to economic conditions and expectation theory. The report then delves into a stock analysis of Qantas (QAN) and AMP, evaluating their stock prices, returns, mean, variance, standard deviation, and covariance. Beta calculations are performed to assess the systematic risk of each stock, and the Capital Asset Pricing Model (CAPM) is used to determine the required rate of return and assess whether the stocks are under or overpriced. The analysis compares the performance of QAN and AMP, considering factors like stock fluctuations, market position, and associated risks, ultimately providing insights into the past performance and future perspectives of both companies.
Document Page
Running Head: Business Finance
1
Project Report: Business Finance
tabler-icon-diamond-filled.svg

Paraphrase This Document

Need a fresh take? Get an instant paraphrase of this document with our AI Paraphraser
Document Page
Business Finance
2
Contents
Question 1:........................................................................................................................3
Part a:............................................................................................................................3
Part b:............................................................................................................................3
Part c:............................................................................................................................3
Part d:............................................................................................................................4
Part e:............................................................................................................................5
Part f:............................................................................................................................6
Part g:............................................................................................................................7
Question 2:........................................................................................................................9
Part a:............................................................................................................................9
Part b:............................................................................................................................9
Part c:..........................................................................................................................11
Part d:..........................................................................................................................11
Part e:..........................................................................................................................11
Part f:..........................................................................................................................12
References.......................................................................................................................14
Document Page
Business Finance
3
Question 1:
Part a:
0 1 2 3 4 5 6 7 8 9 10
2.00
3.00
4.00
5.00
6.00
7.00
8.00
Yield Curve
Apr-2008 Oct-2008 Apr-2009
Figure 1: Yield Curve
Part b:
Under the normal circumstance, a yield curve always shows the upward graph and it
briefs the long term investment always offers more return to the investors than the short term
investment (Horngren, 2009).
Part c:
On the basis of the given graph, it has been found that the slopes are showing the
increased position at initial stage but along with the time, the slopes are offering the upwards
position. It expresses that the long term investment into the Australian market would offer
improved return (Jiashu, 2009). It also explains that the economical position of the Australian
market has been improved.
Document Page
Business Finance
4
0 1 2 3 4 5 6 7 8 9 10
2.00
3.00
4.00
5.00
6.00
7.00
8.00
Yield Curve
Apr-2008 Oct-2008 Apr-2009
Figure 2 Yield Curve
Part d:
The 2 years bond yield rate of Australia market in the year of 2008 has been described
in the below table. The expectation theory explains that along with the time, the worth of the
money get reduced and thus for the compensation and for the long term investment, the return
of the investment is always higher. On the basis of the expectation theory, an improved rate
of return is expected in the year of 2009. The expectation has been shown in the below graph
in part e. The expectation hypothesis sometime not holds because of the fluctuations in the
economical factors and the international market changes (Higgins, 2012).
two year's bond yield (2008)
Year-
1
Year-
2
Actual
interest rate
Year 2
Actual interest
rate Year -1
Expected
Interest rate
Jan-2008 6.83% 6.61% 1.1365 1.0683 1.0638
Feb-2008 7.12% 6.82% 1.1411 1.0712 1.0652
Mar-2008 7.03% 6.30% 1.13 1.0703 1.0558
Apr-2008 7.21% 6.33% 1.1306 1.0721 1.0546
May-2008 7.35% 6.60% 1.1364 1.0735 1.0585
tabler-icon-diamond-filled.svg

Paraphrase This Document

Need a fresh take? Get an instant paraphrase of this document with our AI Paraphraser
Document Page
Business Finance
5
Jun-2008 7.26% 6.97% 1.1442 1.0726 1.0668
Jul-2008 6.87% 6.64% 1.1372 1.0687 1.0641
Aug-2008 6.34% 5.83% 1.12 1.0634 1.0532
Sep-2008 5.63% 5.51% 1.1133 1.0563 1.0539
Oct-2008 4.33% 4.35% 1.0889 1.0433 1.0437
Nov-2008 3.09% 3.64% 1.074 1.0309 1.0419
Dec-2008 2.67% 3.07% 1.0624 1.0267 1.0347
Yield on two year's bond
Year-
1
Year-
2
Actual interest
rate Year 2
Actual interest
rate Year -1
Expected
Interest rate
Jan-2009 2.69% 2.83
%
1.05741 1.0269 1.02971
Feb-2009 2.59% 2.80
%
1.05685 1.0259 1.03017
Mar-2009 2.74% 2.87
%
1.05826 1.0274 1.03004
Apr-2009 2.69% 3.16
%
1.06419 1.0269 1.03631
May-2009 2.87% 3.46
%
1.07039 1.0287 1.04053
Jun-2009 2.95% 3.90
%
1.07961 1.0295 1.04867
Jul-2009 3.00% 4.04
%
1.08242 1.03 1.0509
Aug-2009 3.19% 4.57
%
1.09349 1.0319 1.05968
Sep-2009 3.23% 4.42
%
1.0904 1.0323 1.05628
Oct-2009 3.66% 4.82
%
1.09877 1.0366 1.05998
Nov-2009 3.73% 4.71
%
1.09645 1.0373 1.05702
Dec-2009 3.83% 4.54
%
1.09282 1.0383 1.05251
Part e:
The expected rate of 2008 has been compared with the rate of 2009 to measure that
whether the expectation in the next year is getting higher. And as described in the expectation
theory that along with the time, the worth of the money get reduced and thus for the
compensation and for the long term investment, the return of the investment is always higher;
Document Page
Business Finance
6
same has taken place in the Australian economical position (Hillier, Grinblatt and Titman,
2011).
Jan
Feb
Mar
Apr
May
Jun
Jul
Aug
Sep
Oct
Nov
Dec
0.96
0.98
1
1.02
1.04
1.06
1.08
1.1
1.12
1.14
1.16
Actual interest rate Year 2
Actual interst rate Year -1
Expected interest rate Year
1
Expected interest rate Year
2
Figure 3: Comparison among actual and expected interest rates
Part f:
The spread of both the economy of different years has been shown in the below table:
spread between Australian Government Bonds and NSW Treasury bonds
F2 CAPITAL MARKET YIELDS - GOVERNMENT
BONDS
Per cent per
annum
Australian
Federal
Governmen
t
NSW
Treasury
Difference
Years to
Maturity
Years to Maturity Years to Maturity
Date 3
yrs
5 yrs 10
yrs
3
yrs
5
yrs
10
yrs
3
yrs
5
yrs
10
yrs
Jan-2008 6.5
8
6.34 6.08 6.9
9
6.9
2
6.58 -
0.4
1
-
0.5
7
-
0.50
Feb-2008 6.7
5
6.50 6.29 7.3
3
7.2
6
6.96 -
0.5
9
-
0.7
6
-
0.67
Mar-2008 6.2 6.10 6.09 6.9 6.9 6.82 - - -
Document Page
Business Finance
7
1 4 0 0.7
4
0.8
0
0.73
Apr-2008 6.2
5
6.19 6.17 6.8
9
6.8
4
6.78 -
0.6
4
-
0.6
5
-
0.61
May-2008 6.4
7
6.33 6.36 7.0
2
6.9
1
6.89 -
0.5
4
-
0.5
8
-
0.54
Jun-2008 6.8
4
6.69 6.59 7.3
6
7.2
3
7.10 -
0.5
2
-
0.5
4
-
0.51
Jul-2008 6.4
9
6.40 6.37 7.1
4
7.0
5
7.01 -
0.6
5
-
0.6
5
-
0.64
Aug-2008 5.7
4
5.77 5.86 6.3
5
6.3
8
6.49 -
0.6
2
-
0.6
1
-
0.63
Sep-2008 5.4
8
5.54 5.65 6.2
1
6.2
4
6.33 -
0.7
3
-
0.7
0
-
0.69
Oct-2008 4.5
9
4.83 5.22 5.2
7
5.4
8
5.85 -
0.6
8
-
0.6
5
-
0.63
Nov-2008 3.9
6
4.28 4.94 4.7
5
5.1
4
5.69 -
0.7
9
-
0.8
7
-
0.75
Dec-2008 3.4
3
3.72 4.22 4.5
4
4.8
7
5.12 -
1.1
0
-
1.1
5
-
0.90
Jan-2009 3.1
5
3.50 4.09 4.2
7
4.6
4
4.93 -
1.1
2
-
1.1
4
-
0.85
Feb-2009 3.0
8
3.59 4.25 3.9
6
4.5
0
5.21 -
0.8
8
-
0.9
1
-
0.95
Mar-2009 3.2
0
3.73 4.33 4.2
4
4.8
7
5.62 -
1.0
5
-
1.1
4
-
1.29
Apr-2009 3.5
3
4.05 4.51 4.3
2
4.9
3
5.59 -
0.7
9
-
0.8
8
-
1.07
May-2009 3.9
1
4.47 5.00 4.5
2
5.1
7
5.90 -
0.6
1
-
0.6
9
-
0.90
Jun-2009 4.4
7
5.10 5.56 5.0
2
5.7
0
6.36 -
0.5
5
-
0.5
9
-
0.81
Jul-2009 4.5
9
5.21 5.49 5.0
7
5.6
3
6.12 -
0.4
-
0.4
-
0.63
tabler-icon-diamond-filled.svg

Paraphrase This Document

Need a fresh take? Get an instant paraphrase of this document with our AI Paraphraser
Document Page
Business Finance
8
8 2
Aug-2009 4.9
9
5.39 5.53 5.4
0
5.7
7
6.09 -
0.4
1
-
0.3
7
-
0.55
Sep-2009 4.8
2
5.14 5.32 5.1
2
5.5
4
5.86 -
0.3
1
-
0.4
0
-
0.54
Oct-2009 5.1
4
5.35 5.45 5.4
7
5.7
7
5.98 -
0.3
3
-
0.4
1
-
0.53
Nov-2009 4.9
9
5.24 5.47 5.3
4
5.6
7
6.05 -
0.3
5
-
0.4
3
-
0.58
Dec-2009 4.8
3
5.15 5.47 5.2
1
5.6
0
6.09 -
0.3
9
-
0.4
5
-
0.62
The average spread rate of Australian and NSW market is -0.64, -0.68 and -0.71 in the
year of 3, 5 and 10. It explains that the changes into the NSW economy is more improved
(Madura, 2014).
Part g:
The below graph represent the spread among both the economies:
Jan-2008
Mar-2008
May-2008
Jul-2008
Sep-2008
Nov-2008
Jan-2009
Mar-2009
May-2009
Jul-2009
Sep-2009
Nov-2009
-1.40
-1.20
-1.00
-0.80
-0.60
-0.40
-0.20
0.00
3 yrs
5 yrs
10 yrs
Figure 4: spread among the Australian Government Bonds and NSW Treasury bonds
Document Page
Business Finance
9
On the basis of the above graph, it has been found that along with the time, the return
of the economies has also been changed. It expresses that the changes into the NSW economy
is more improved. The pattern explains better performance of NSW.
Document Page
Business Finance
10
Question 2:
Part a:
The below graph represent the stock of QAN and AMP. On the basis of the below
graph, it has been found that the current growth in the stock price of QAN is higher. The
higher fluctuation and improvement has been seen in the stock price of the company in last 3
years. However, after the January, 2018, the stock price of AMP is getting reduced and
explains decrement in the market position of the business (Gapenski, 2008).
Jan-15
Mar-15
May-15
Jul-15
Sep-15
Nov-15
Jan-16
Mar-16
May-16
Jul-16
Sep-16
Nov-16
Jan-17
Mar-17
May-17
Jul-17
Sep-17
Nov-17
Jan-18
Mar-18
May-18
0.000
1.000
2.000
3.000
4.000
5.000
6.000
7.000
8.000
AMP.AX ($A)
QAN.AX ($A)
Figure 5: Share price
Part b:
c ASX200 QAN.AX
($A)
AMP.AX
($A)
Jan-15
Feb-15 -0.63% -3.88% 7.96%
Mar-15 -1.72% 2.07% 8.65%
Apr-15 -0.22% 3.42% 3.83%
May-15 -5.51% -9.61% -10.23%
Jun-15 4.40% 9.80% 18.67%
Jul-15 -8.64% -9.98% -10.40%
Aug-15 -3.56% -6.55% 10.71%
Sep-15 4.34% 5.54% -0.29%
Oct-15 -1.39% 1.40% -7.85%
tabler-icon-diamond-filled.svg

Paraphrase This Document

Need a fresh take? Get an instant paraphrase of this document with our AI Paraphraser
Document Page
Business Finance
11
Nov-15 2.50% 0.34% 12.36%
Dec-15 -5.48% -7.89% -5.13%
Jan-16 -2.49% -0.93% -0.52%
Feb-16 4.14% 8.83% 5.44%
Mar-16 3.33% 4.30% -20.88%
Apr-16 2.41% -4.08% -4.35%
May-16 -2.70% -8.51% -8.44%
Jun-16 6.28% 12.60% 12.06%
Jul-16 -2.32% -9.47% 2.53%
Aug-16 0.05% 3.04% -3.70%
Sep-16 -2.17% -13.45% 0.14%
Oct-16 2.31% 2.84% 7.84%
Nov-16 4.14% 7.23% 0.91%
Dec-16 -0.79% -0.79% 2.40%
Jan-17 1.62% -2.40% 9.97%
Feb-17 2.67% 9.16% 3.73%
Mar-17 1.01% 3.47% 11.07%
Apr-17 -3.37% -5.78% 18.16%
May-17 -0.05% 2.77% 14.17%
Jun-17 -0.02% 3.85% -6.99%
Jul-17 -0.11% -5.38% 7.52%
Aug-17 -0.58% -2.53% 1.92%
Sep-17 4.00% 2.90% 6.81%
Oct-17 1.03% 2.82% -7.80%
Nov-17 1.59% 1.57% -11.11%
Dec-17 -0.45% 1.16% 4.56%
Jan-18 -0.36% 0.76% 11.76%
Feb-18 -4.27% -3.05% -1.02%
Mar-18 3.88% -19.04% 0.16%
Apr-18 0.49% -3.47% 10.05%
May-18 3.04% -8.72% -2.99%
Jun-18 0.53% 0.00% 9.09%
ASX200 QAN.AX ($A) AMP.AX
($A)
Mean 0.17% -0.87% 2.46%
Variance 0.10% 0.45% 0.77%
Standard
Deviation
0.032 0.067 0.088
Covariance 0.118% 0.061%
Document Page
Business Finance
12
The above tables represent the return, mean, covariance, standard deviation, variance
etc. the table brief that the mean, variance, standard deviation and covariance of QAN and
AMP are -0.87% and 2.46%, 0.45% and 0.77%, 0.067 and 0.088 & 0.118% and 0.061%.
However, the mean, variance and standard deviation of ASX 200 is 0.17%, 0.10% and
0.032. It explains that the return of Amp is higher in the industry. Though, the associated risk
of AMP is also higher. The standard deviation also explains that the risk position associated
with AMP is highest in the industry. Further the covariance level of QAN is better (Lord,
2007). It leads to the conclusion that the performance of QAN is better in terms of overall
management.
Part c:
Calculation of beta:
ASX200 QAN.AX ($A) AMP.AX ($A)
Mean 0.17% -0.87% 2.46%
Variance 0.10% 0.45% 0.77%
Standard
Deviation
0.032 0.067 0.088
Covariance 0.118% 0.061%
Beta 1.172 0.610
Part d:
The calculations in part C brief that the QAN is holding higher beta in the market.
The beta of QAN and AMP is 1.172 and .610. The higher beta from 1 explains that the
changes in the stock price are even higher than the index. It explains that the fluctuations and
the risk of QAN market are higher.
Part e:
CAPM calculations:
Calculation of cost of equity (CAPM)
QAN AMP
Risk free rate (Bloomberg,
2018)
1.69
%
1.69
%
RM 2.05
%
2.05
%
chevron_up_icon
1 out of 15
circle_padding
hide_on_mobile
zoom_out_icon
[object Object]