Business Finance Report: Financial Performance of AQC Limited
VerifiedAdded on 2022/08/21
|11
|3757
|15
Report
AI Summary
This report provides a comprehensive financial analysis of Australian Pacific Coal Limited (AQC Limited). It begins with an introduction to financial performance analysis, followed by a description of AQC Limited, an Australian public company in the junior mining and exploration industry. The report then delves into a net working capital position analysis, evaluating the company's current assets and liabilities, and calculating its net working capital for 2018 and 2019. The report calculates the cost of equity using the constant dividend growth model. Finally, it analyzes AQC Limited's liquidity and capital structure using relevant ratios, including current ratio, quick ratio, and debt-to-equity ratio, offering insights into the company's financial health and long-term stability. The report concludes with recommendations based on the analysis.

Running head: BUSINESS FINANCE
Business Finance
Name of the Student
Name of the University
Author’s Note
Business Finance
Name of the Student
Name of the University
Author’s Note
Paraphrase This Document
Need a fresh take? Get an instant paraphrase of this document with our AI Paraphraser
1BUSINESS FINANCE
Table of Contents
1. Introduction...............................................................................................................2
2. Description of the Company.....................................................................................2
3. Net Working Capital Position Analysis.....................................................................3
3.1 Analysis of Working Capital Position..................................................................3
3.2 Calculation of Net Working Capital and Opinion on Working Capital Position...3
4. Cost of Equity Calculation........................................................................................4
5. Liquidity and Capital Structure Analysis using Ratios..............................................4
5.1 Liquidity Ratios....................................................................................................5
5.2 Capital Structure Ratios......................................................................................6
6. Conclusion and Recommendation...........................................................................6
7. References...............................................................................................................8
8. Appendix.................................................................................................................10
2BUSINESS FINANCE
1. Introduction
Measuring financial performance and financial position of the business
organizations is considered as a crucial aspect for analysing the overall financial
health and standings of those companies. The requirement is to take into
consideration some important aspects of the companies that help in analysing the
performance and position; such as working capital analysis, payment of dividend
analysis and analysis of crucial ratios like liquidity ratios, capital structure ratios and
others (Singh, Darwish and Potočnik 2016). This analysis provides the investors and
other business analysts major assistance in taking decision on whether a particular
organization is suitable for making investments or not. Moreover, managements of
the companies can identify the areas that require their attention to improve the
situation from the outcome of this kind of analysis (Delen, Kuzey and Uyar 2013).
Therefore, this provides the scope to increase the overall financial performance of
the companies. The main aim of this report is the analyst of the above-mentioned
aspects in relation to Australian Pacific Coal Limited. There are four key parts of
the report. The first part discusses about different information associated with the
chosen company. The second part discusses about different aspects associated with
the management of networking capital in the company. The third part of the report
shows the calculation of cost of equity of the company by considering all the required
information. The last part undertakes analysis of the liquidity and capital structure
position of the company by using relevant ratios. A conclusion and recommendation
is provided at last on the basis of the whole analysis.
2. Description of the Company
Australian Pacific Coal Limited is considered as an emerging coal miner. It is
an Australian pubic company with a shareholder base of 2000. The company got
enlisted in the Australian Stock Exchange (ASX) in the year 1999. From the
inception, the company has become a strong competitor in the junior mining and
exploration industry. The core business activities of Australian Pacific Coal Limited
are the evaluation of coal exploration tenements in the Bowen, Surat and Galilee
basins in Queensland, Australia; identification of the opportunities to explore on
chosen coal tenements that include exploration through joint ventures agreements;
and planning of different types of programs of explorations in the chosen coal
tenements (aqcltd.com 2020).
The operations of Australian Pacific Coal Limited can be seen in two
segments. They are Exploration and Evaluation and Bentonite Mining. The main aim
of the segment of exploration and evaluation is the identification of the potential
areas of resources along with securing tenure over the relevant tenements and the
management of the exploration and evaluation procedures. The main aim of
Bentonite Mining segment is the mining of bentonite in order to sale them. This
particular segment is accountable for operating Dartbrook Coal Mine that is in the
coal region of the Hunter Valley in New South Wales. The other assets of Australian
Pacific Coal Limited include South Clermont, Cooroorah, Dingo, Blackwater and Mt
Hilalong (markets.ft.com 2020).
In order to gain the required competitive advantage, Australian Pacific Coal
Limited has completed the full acquisition of Dartbrook Cola Mine with the aim to
enhance the operational production. The company has all of its operations in the
junior mining and exploration industry. Companies under this industry have major
reliance on the listed equity in order to finance their mining and exploration
⊘ This is a preview!⊘
Do you want full access?
Subscribe today to unlock all pages.
Trusted by 1+ million students worldwide
3BUSINESS FINANCE
operations. Junior mining and exploration companies do not have any project that
progresses from exploration phase to operation phase as their aim is to sell these
discoveries to large mining and exploration companies (rba.gov.au 2020).
3. Net Working Capital Position Analysis
3.1 Analysis of Working Capital Position
Working capital can be described as an indicator of a company’s short-term
financial position and this helps in measuring the overall efficiency of a company.
This can be obtained by subtracting the current liabilities from the current assets. In
order to analyse the working capital position of Australian Pacific Coal Limited, it is
needed to asses and evaluate the changes in current assets and current liabilities
(Hoque, Mia and Anwar 2015).
When considering the composition of current assets and current liabilities of
Australian Pacific Coal Limited over the last two years, it can be seen that the main
components under current assets are cash and cash equivalents, trade and other
receivables and others; and the main components of the current liabilities are trade
and other payables, borrowings and provisions (aqcltd.com 2020). Analysis of these
components of current assets shows that there is a major fall in the total current
assets from $3,396,217 in 2018 to $1,337,698 in 2019. This is because of the
decrease in trade and other receivables in the presence of the increases in cash and
cash equivalent and other current assets. The same trend can be seen in case of the
current liabilities as total current liabilities has registered a major fall in 2019 as
compare to 2018; that is from $58,620,203 to $17,323,994. The main reasons are
the payment of the dues of trade and other payables and repayment of borrowings
(Ajibolade and Sankay 2013). The presence of a positive and a negative aspect can
be seen from the analysis. Major decrease in the current liabilities is a positive
aspect as this implies the increased payment of short-term debts by the company.
However, negative aspect is the large decrease in current assets due to decrease in
trade and other receivables; and the main reason for the decrease in trade and other
receivable is the fall in sales in 2019 by large margin.
On the overall basis, it can be observed from the information of 2019 and
2018 that Australian Pacific Coal Limited does not have more current assets than
current liabilities which implies that the company more current liabilities as compared
to current assets. This is an unfavourable situation for the company’s overall working
capital position as it denotes that Australian Pacific Coal Limited does not have
adequate working capital to carry out its core business operations in smooth manner
(Khatik and Varghese 2015).
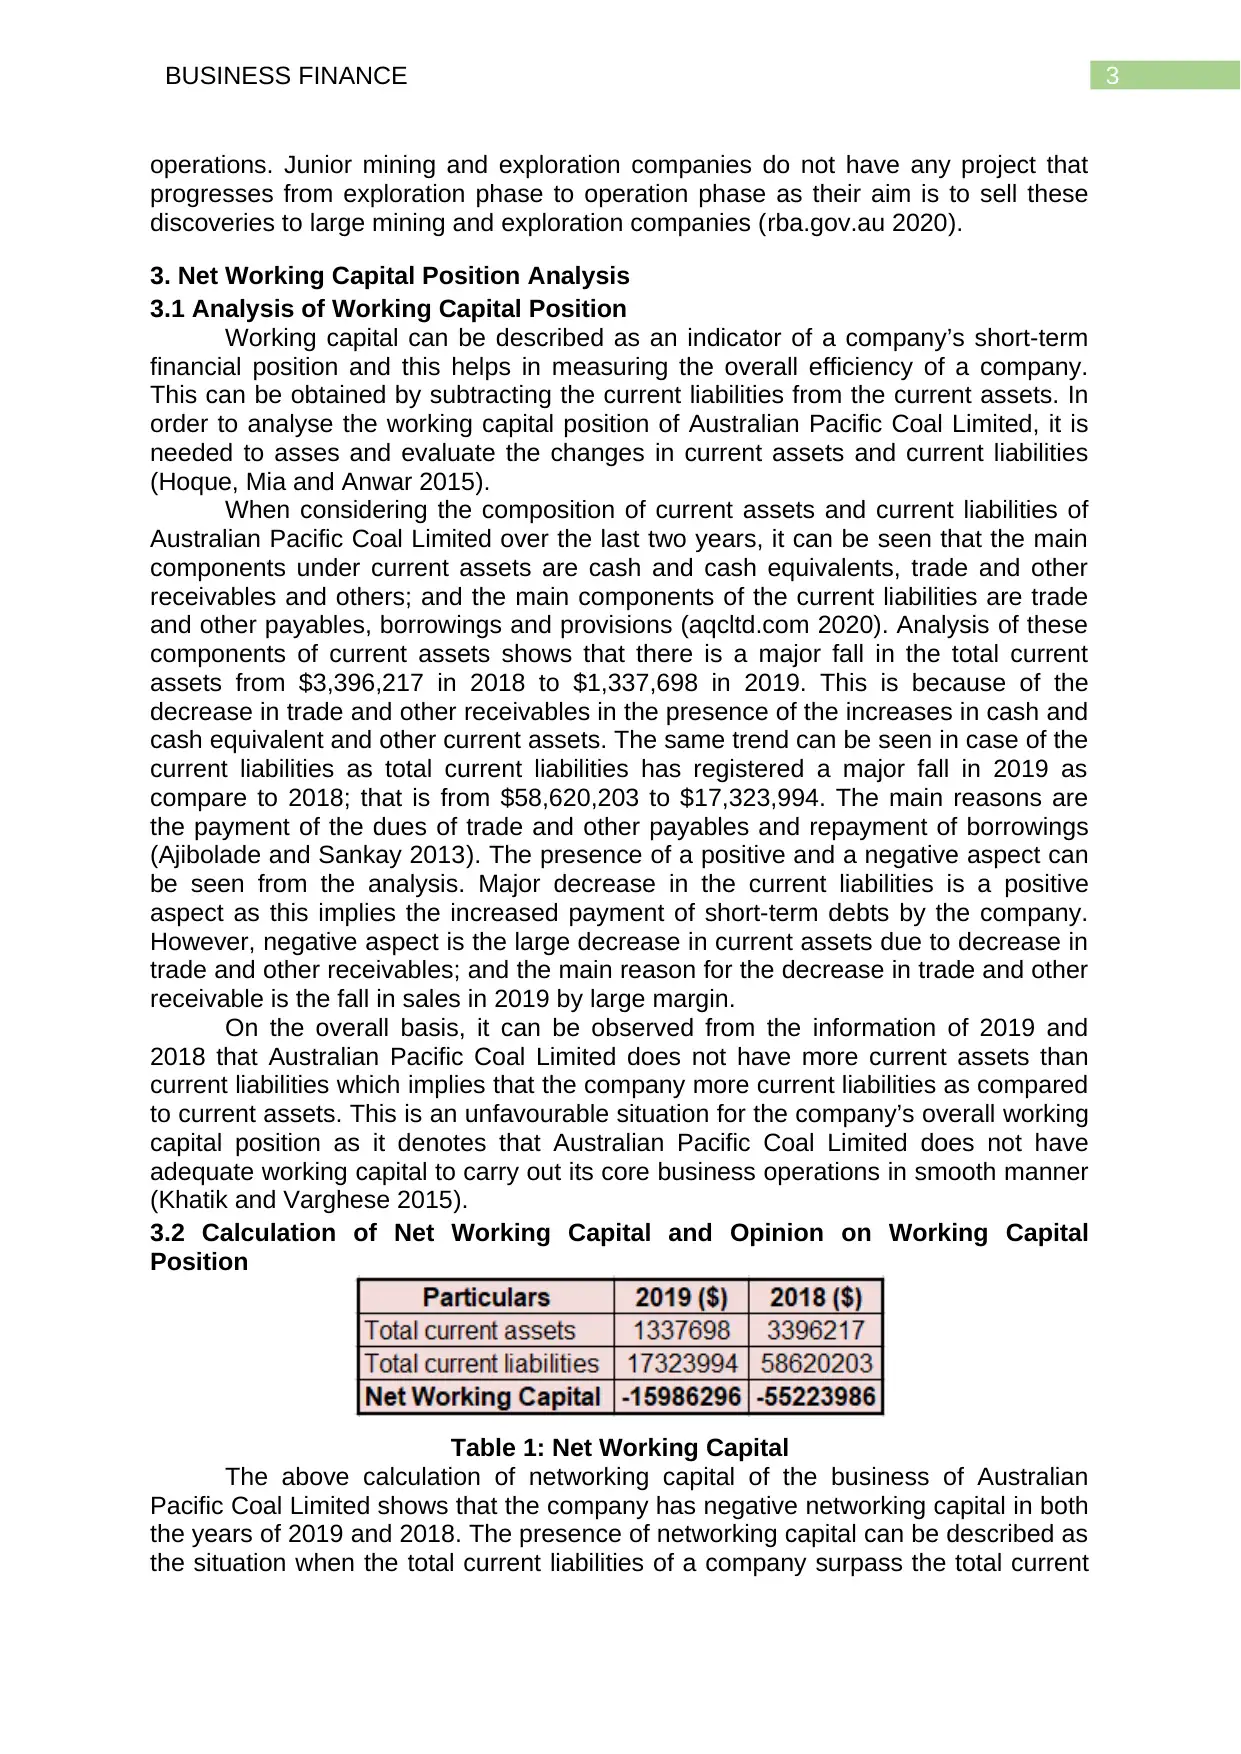
3.2 Calculation of Net Working Capital and Opinion on Working Capital
Position
Table 1: Net Working Capital
The above calculation of networking capital of the business of Australian
Pacific Coal Limited shows that the company has negative networking capital in both
the years of 2019 and 2018. The presence of networking capital can be described as
the situation when the total current liabilities of a company surpass the total current
operations. Junior mining and exploration companies do not have any project that
progresses from exploration phase to operation phase as their aim is to sell these
discoveries to large mining and exploration companies (rba.gov.au 2020).
3. Net Working Capital Position Analysis
3.1 Analysis of Working Capital Position
Working capital can be described as an indicator of a company’s short-term
financial position and this helps in measuring the overall efficiency of a company.
This can be obtained by subtracting the current liabilities from the current assets. In
order to analyse the working capital position of Australian Pacific Coal Limited, it is
needed to asses and evaluate the changes in current assets and current liabilities
(Hoque, Mia and Anwar 2015).
When considering the composition of current assets and current liabilities of
Australian Pacific Coal Limited over the last two years, it can be seen that the main
components under current assets are cash and cash equivalents, trade and other
receivables and others; and the main components of the current liabilities are trade
and other payables, borrowings and provisions (aqcltd.com 2020). Analysis of these
components of current assets shows that there is a major fall in the total current
assets from $3,396,217 in 2018 to $1,337,698 in 2019. This is because of the
decrease in trade and other receivables in the presence of the increases in cash and
cash equivalent and other current assets. The same trend can be seen in case of the
current liabilities as total current liabilities has registered a major fall in 2019 as
compare to 2018; that is from $58,620,203 to $17,323,994. The main reasons are
the payment of the dues of trade and other payables and repayment of borrowings
(Ajibolade and Sankay 2013). The presence of a positive and a negative aspect can
be seen from the analysis. Major decrease in the current liabilities is a positive
aspect as this implies the increased payment of short-term debts by the company.
However, negative aspect is the large decrease in current assets due to decrease in
trade and other receivables; and the main reason for the decrease in trade and other
receivable is the fall in sales in 2019 by large margin.
On the overall basis, it can be observed from the information of 2019 and
2018 that Australian Pacific Coal Limited does not have more current assets than
current liabilities which implies that the company more current liabilities as compared
to current assets. This is an unfavourable situation for the company’s overall working
capital position as it denotes that Australian Pacific Coal Limited does not have
adequate working capital to carry out its core business operations in smooth manner
(Khatik and Varghese 2015).
3.2 Calculation of Net Working Capital and Opinion on Working Capital
Position
Table 1: Net Working Capital
The above calculation of networking capital of the business of Australian
Pacific Coal Limited shows that the company has negative networking capital in both
the years of 2019 and 2018. The presence of networking capital can be described as
the situation when the total current liabilities of a company surpass the total current
Paraphrase This Document
Need a fresh take? Get an instant paraphrase of this document with our AI Paraphraser
4BUSINESS FINANCE
assets. This is a highly unfavourable situation which indicates towards the presence
of more short-term debts in the company as compared to short-term assets
(Varghese and Dhote 2014). This same aspect can be seen in Australian Pacific
Coal Limited as the company more short-term debts in these two years than short-
term assets. In a positive note, it requires to be mentioned that the networking capital
position of Australian Pacific Coal Limited has improved in 2019 as compared to
2018; and this is because the company has become able in reducing the gap
between current assets and current liabilities in a healthy margin in 2019 and the
main reason for this is the large decrease in current liabilities because of the
payment of dues to the creditors and repayment of short-term borrowings. However,
on the overall basis, Australian Pacific Coal Limited does not have a healthy
networking capital position due to the presence of negative networking capital in last
two years (Madhavi 2014). Therefore, it is required for the management of Australian
Pacific Coal Limited to introduce and implement appropriate financial strategies to
revive this working capital situation.
4. Cost of Equity Calculation
The formula for calculating cost of equity under the constant dividend growth
model as follows:
Ke = (D1 / P0) + g
Where,
Ke = Cost of Equity
D1 = Expected future dividend that is {$0.001 × (1 + 0.03)} = $0.00103
P0 = Current share price that is $0.130
g = Growth rate that is 3% or 0.03
D0 = Current dividend paid that is $0.001 (As the company has not declared and
provided any dividend in 2019, $0.001 is assumed to be the dividend paid in 2019 to
get the value of cost of equity)
Ke = (D1 / P0) + g
= (0.00103 / 0.130) + 3%
= 3.79 %
5. Liquidity and Capital Structure Analysis using Ratios
Calculation and interpretation of liquidity and capital structure ratios help in
assessing the overall liquidity and long-term stability as well as structure of the
companies. The following discussion shows the analysis and interpretation of the
liquidity and capital structure ratios of Australian Pacific Coal Limited.
5BUSINESS FINANCE
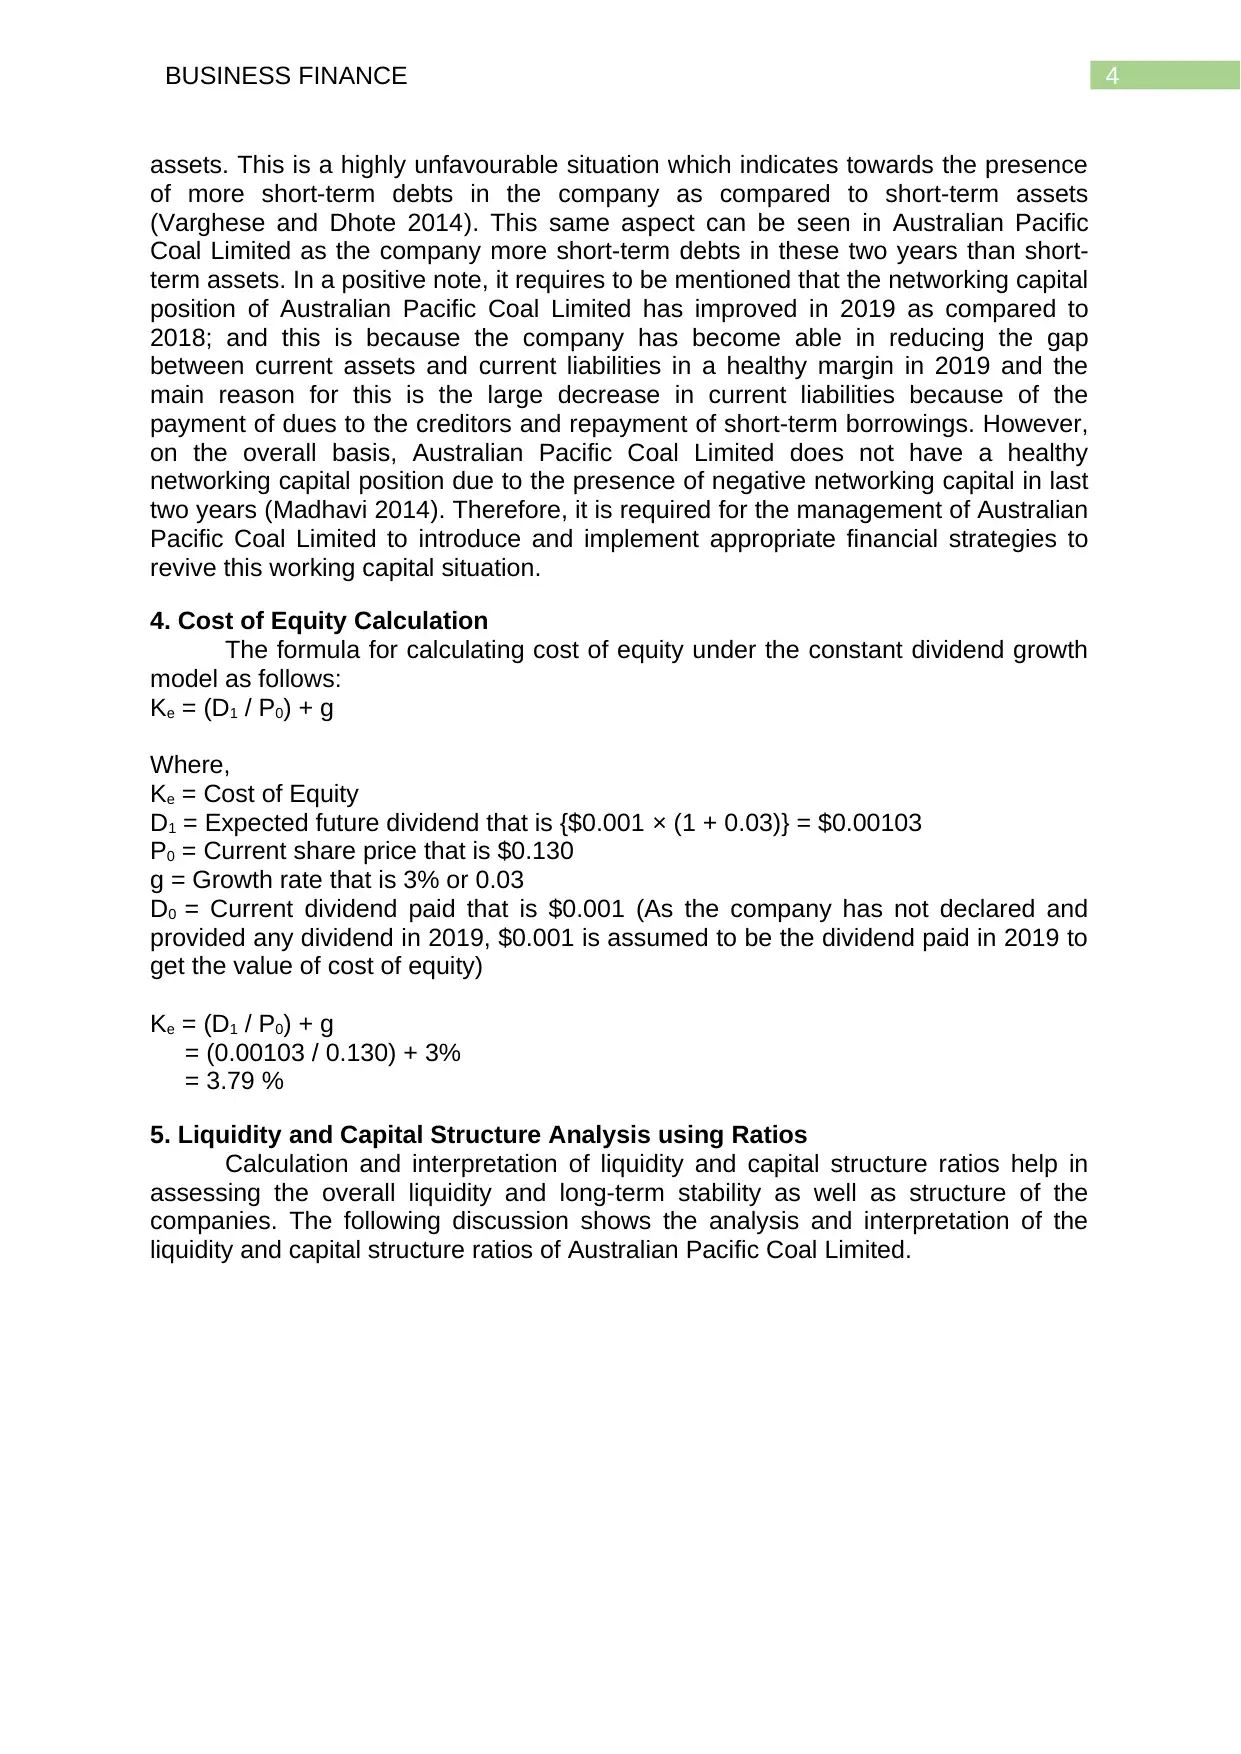
5.1 Liquidity Ratios
Current Ratio Quick Ratio
0.00
0.20
0.40
0.60
0.80
1.00
1.20
1.40
1.60
0.08 0.030.06 0.05
0.26 0.26
1.39 1.36
Liquidity Ratios
2019 2018 2017 2016
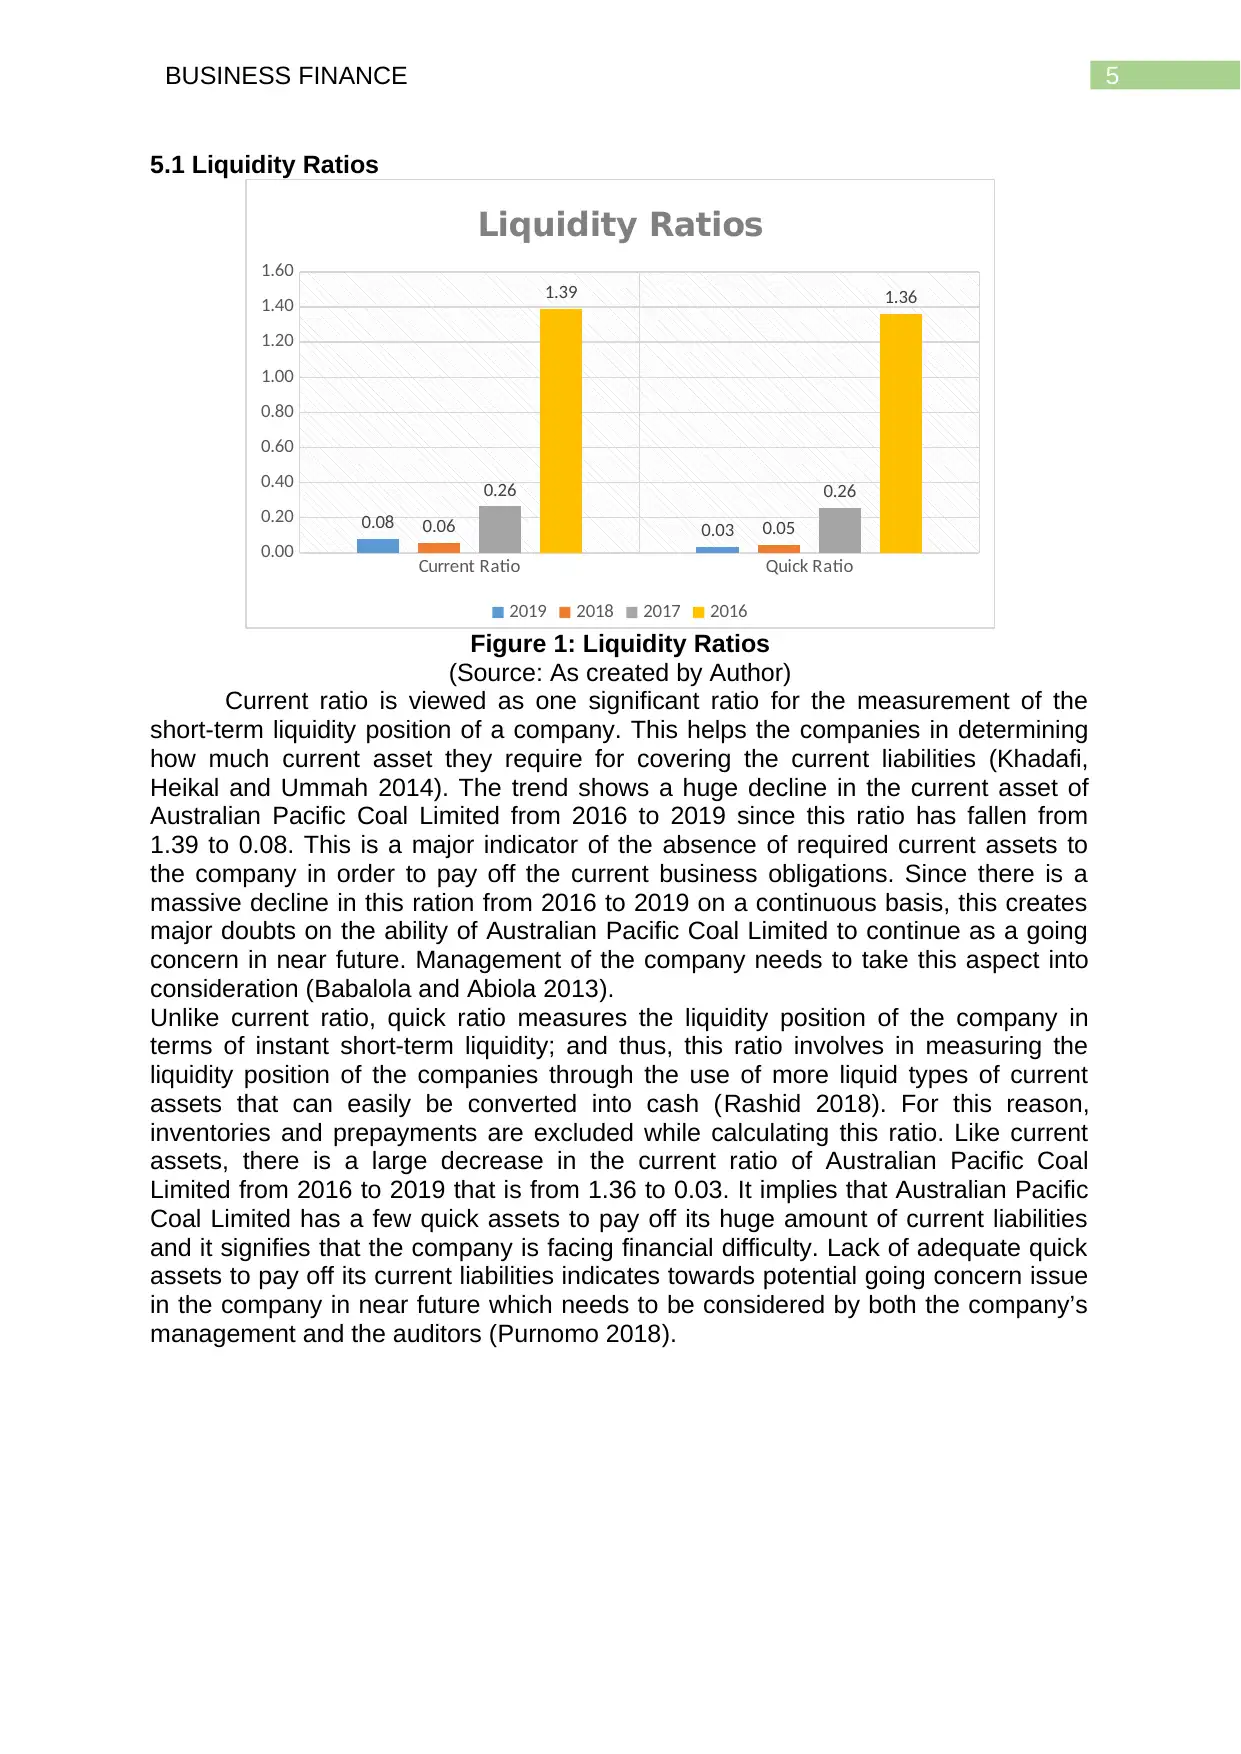
Figure 1: Liquidity Ratios
(Source: As created by Author)
Current ratio is viewed as one significant ratio for the measurement of the
short-term liquidity position of a company. This helps the companies in determining
how much current asset they require for covering the current liabilities (Khadafi,
Heikal and Ummah 2014). The trend shows a huge decline in the current asset of
Australian Pacific Coal Limited from 2016 to 2019 since this ratio has fallen from
1.39 to 0.08. This is a major indicator of the absence of required current assets to
the company in order to pay off the current business obligations. Since there is a
massive decline in this ration from 2016 to 2019 on a continuous basis, this creates
major doubts on the ability of Australian Pacific Coal Limited to continue as a going
concern in near future. Management of the company needs to take this aspect into
consideration (Babalola and Abiola 2013).
Unlike current ratio, quick ratio measures the liquidity position of the company in
terms of instant short-term liquidity; and thus, this ratio involves in measuring the
liquidity position of the companies through the use of more liquid types of current
assets that can easily be converted into cash (Rashid 2018). For this reason,
inventories and prepayments are excluded while calculating this ratio. Like current
assets, there is a large decrease in the current ratio of Australian Pacific Coal
Limited from 2016 to 2019 that is from 1.36 to 0.03. It implies that Australian Pacific
Coal Limited has a few quick assets to pay off its huge amount of current liabilities
and it signifies that the company is facing financial difficulty. Lack of adequate quick
assets to pay off its current liabilities indicates towards potential going concern issue
in the company in near future which needs to be considered by both the company’s
management and the auditors (Purnomo 2018).
5.1 Liquidity Ratios
Current Ratio Quick Ratio
0.00
0.20
0.40
0.60
0.80
1.00
1.20
1.40
1.60
0.08 0.030.06 0.05
0.26 0.26
1.39 1.36
Liquidity Ratios
2019 2018 2017 2016
Figure 1: Liquidity Ratios
(Source: As created by Author)
Current ratio is viewed as one significant ratio for the measurement of the
short-term liquidity position of a company. This helps the companies in determining
how much current asset they require for covering the current liabilities (Khadafi,
Heikal and Ummah 2014). The trend shows a huge decline in the current asset of
Australian Pacific Coal Limited from 2016 to 2019 since this ratio has fallen from
1.39 to 0.08. This is a major indicator of the absence of required current assets to
the company in order to pay off the current business obligations. Since there is a
massive decline in this ration from 2016 to 2019 on a continuous basis, this creates
major doubts on the ability of Australian Pacific Coal Limited to continue as a going
concern in near future. Management of the company needs to take this aspect into
consideration (Babalola and Abiola 2013).
Unlike current ratio, quick ratio measures the liquidity position of the company in
terms of instant short-term liquidity; and thus, this ratio involves in measuring the
liquidity position of the companies through the use of more liquid types of current
assets that can easily be converted into cash (Rashid 2018). For this reason,
inventories and prepayments are excluded while calculating this ratio. Like current
assets, there is a large decrease in the current ratio of Australian Pacific Coal
Limited from 2016 to 2019 that is from 1.36 to 0.03. It implies that Australian Pacific
Coal Limited has a few quick assets to pay off its huge amount of current liabilities
and it signifies that the company is facing financial difficulty. Lack of adequate quick
assets to pay off its current liabilities indicates towards potential going concern issue
in the company in near future which needs to be considered by both the company’s
management and the auditors (Purnomo 2018).
⊘ This is a preview!⊘
Do you want full access?
Subscribe today to unlock all pages.
Trusted by 1+ million students worldwide
6BUSINESS FINANCE
5.2 Capital Structure Ratios
Debt to Equity Ratio Debt to Total Assets
0.00
2.00
4.00
6.00
8.00
10.00
12.00
4.54
1.28
9.99
1.11
7.28
0.88
1.96
0.66
Capital Structure Ratios
2019 2018 2017 2016
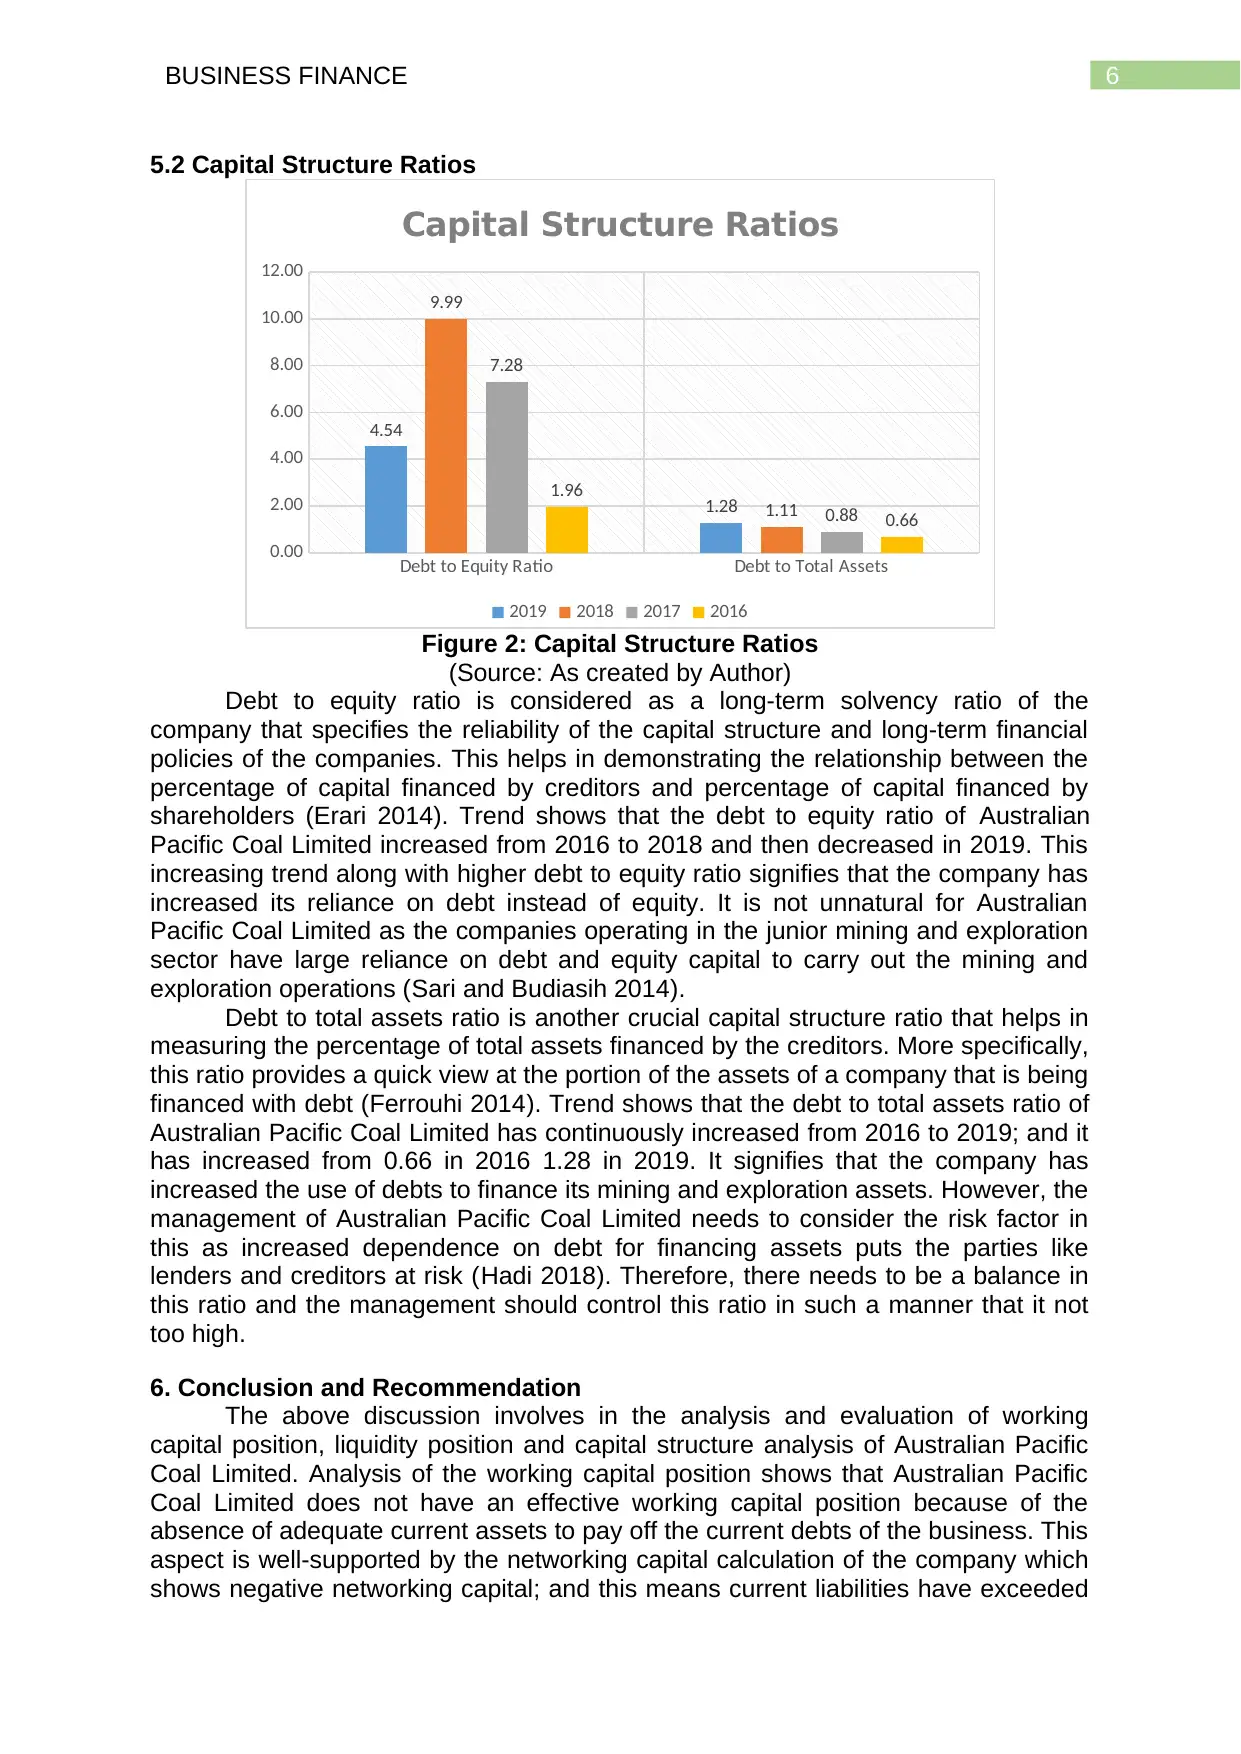
Figure 2: Capital Structure Ratios
(Source: As created by Author)
Debt to equity ratio is considered as a long-term solvency ratio of the
company that specifies the reliability of the capital structure and long-term financial
policies of the companies. This helps in demonstrating the relationship between the
percentage of capital financed by creditors and percentage of capital financed by
shareholders (Erari 2014). Trend shows that the debt to equity ratio of Australian
Pacific Coal Limited increased from 2016 to 2018 and then decreased in 2019. This
increasing trend along with higher debt to equity ratio signifies that the company has
increased its reliance on debt instead of equity. It is not unnatural for Australian
Pacific Coal Limited as the companies operating in the junior mining and exploration
sector have large reliance on debt and equity capital to carry out the mining and
exploration operations (Sari and Budiasih 2014).
Debt to total assets ratio is another crucial capital structure ratio that helps in
measuring the percentage of total assets financed by the creditors. More specifically,
this ratio provides a quick view at the portion of the assets of a company that is being
financed with debt (Ferrouhi 2014). Trend shows that the debt to total assets ratio of
Australian Pacific Coal Limited has continuously increased from 2016 to 2019; and it
has increased from 0.66 in 2016 1.28 in 2019. It signifies that the company has
increased the use of debts to finance its mining and exploration assets. However, the
management of Australian Pacific Coal Limited needs to consider the risk factor in
this as increased dependence on debt for financing assets puts the parties like
lenders and creditors at risk (Hadi 2018). Therefore, there needs to be a balance in
this ratio and the management should control this ratio in such a manner that it not
too high.
6. Conclusion and Recommendation
The above discussion involves in the analysis and evaluation of working
capital position, liquidity position and capital structure analysis of Australian Pacific
Coal Limited. Analysis of the working capital position shows that Australian Pacific
Coal Limited does not have an effective working capital position because of the
absence of adequate current assets to pay off the current debts of the business. This
aspect is well-supported by the networking capital calculation of the company which
shows negative networking capital; and this means current liabilities have exceeded
5.2 Capital Structure Ratios
Debt to Equity Ratio Debt to Total Assets
0.00
2.00
4.00
6.00
8.00
10.00
12.00
4.54
1.28
9.99
1.11
7.28
0.88
1.96
0.66
Capital Structure Ratios
2019 2018 2017 2016
Figure 2: Capital Structure Ratios
(Source: As created by Author)
Debt to equity ratio is considered as a long-term solvency ratio of the
company that specifies the reliability of the capital structure and long-term financial
policies of the companies. This helps in demonstrating the relationship between the
percentage of capital financed by creditors and percentage of capital financed by
shareholders (Erari 2014). Trend shows that the debt to equity ratio of Australian
Pacific Coal Limited increased from 2016 to 2018 and then decreased in 2019. This
increasing trend along with higher debt to equity ratio signifies that the company has
increased its reliance on debt instead of equity. It is not unnatural for Australian
Pacific Coal Limited as the companies operating in the junior mining and exploration
sector have large reliance on debt and equity capital to carry out the mining and
exploration operations (Sari and Budiasih 2014).
Debt to total assets ratio is another crucial capital structure ratio that helps in
measuring the percentage of total assets financed by the creditors. More specifically,
this ratio provides a quick view at the portion of the assets of a company that is being
financed with debt (Ferrouhi 2014). Trend shows that the debt to total assets ratio of
Australian Pacific Coal Limited has continuously increased from 2016 to 2019; and it
has increased from 0.66 in 2016 1.28 in 2019. It signifies that the company has
increased the use of debts to finance its mining and exploration assets. However, the
management of Australian Pacific Coal Limited needs to consider the risk factor in
this as increased dependence on debt for financing assets puts the parties like
lenders and creditors at risk (Hadi 2018). Therefore, there needs to be a balance in
this ratio and the management should control this ratio in such a manner that it not
too high.
6. Conclusion and Recommendation
The above discussion involves in the analysis and evaluation of working
capital position, liquidity position and capital structure analysis of Australian Pacific
Coal Limited. Analysis of the working capital position shows that Australian Pacific
Coal Limited does not have an effective working capital position because of the
absence of adequate current assets to pay off the current debts of the business. This
aspect is well-supported by the networking capital calculation of the company which
shows negative networking capital; and this means current liabilities have exceeded
Paraphrase This Document
Need a fresh take? Get an instant paraphrase of this document with our AI Paraphraser
7BUSINESS FINANCE
the current assets of the company. This condition is highly unfavourable for the
investors. The calculation has cost of equity based on dividend growth model shows
that Australian Pacific Coal Limited has neither declared nor paid any dividend in the
year 2019. A dividend is considered as the only payment that companies make to
their shareholders. Since Australian Pacific Coal Limited has not provided any
dividend, it is a highly unfavourable situation for the investors. It can also be seen
from the above analysis that Australian Pacific Coal Limited has a poor liquidity
condition because of the poor current and quick ratio that are way less than 1. It
demonstrates the presence of inadequate current and quick assets in the company
for paying off the present business obligations. This is the situation where the current
liabilities largely exceed the current assets. Since this casts uncertainty on the ability
of the company to continue its business operations in future, this needs to be
considered as an unfavourable condition for the investors. In case of the debt to
equity ratio, it can be seen that the company has excessive reliance on debt capital
for funding the business operations as compared to the equity capital. Even if this is
a normal business practice for the companies operating under junior mining and
exploration industry, it increases the risk to the investors and creditors. The same
aspect can be seen from the analysis of the debt to total assets of the company as
this also signifies the increased dependence of Australian Pacific Coal Limited on the
use of debt capital for financing the business assets. All these indicate towards the
use of more debt capital by Australian Pacific Coal Limited as compared to equity
capital. Therefore, this condition is also not favourable for the investors.
On the basis of the above discussion, the recommendation to the potential
investors is not to invest in this company as the company has many issues like
ineffective working capital position, poor liquidity condition and excessive reliance on
debt capital. Moreover, the company does not have any history of paying dividend in
last three years which reduces the possibility of gaining good return on investment.
8BUSINESS FINANCE
7. References
Ajibolade, S.O. and Sankay, O.C., 2013. Working capital management and financing
decision: Synergetic effect on corporate profitability. International Journal of
Management, Economics and Social Sciences, 2(4), pp.233-251.
Aqcltd.com. 2020. 2019 Annual Report Australian Pacific Coal. [online] Available at:
http://www.aqcltd.com/site/PDF/2318_1/2019AnnualReport [Accessed 27 Jan.
2020].
Aqcltd.com. 2020. Australian Pacific Coal ANNUAL REPORT 2017. [online]
Available at: http://www.aqcltd.com/site/PDF/2043_0/AnnualReport [Accessed 27
Jan. 2020].
Babalola, Y.A. and Abiola, F.R., 2013. Financial ratio analysis of firms: A tool for
decision making. International journal of management sciences, 1(4), pp.132-137.
Delen, D., Kuzey, C. and Uyar, A., 2013. Measuring firm performance using financial
ratios: A decision tree approach. Expert Systems with Applications, 40(10), pp.3970-
3983.
Erari, A., 2014. Analisis Pengaruh Current Ratio, Debt To Equity Ratio, dan Return
On Asset Terhadap Return Saham Pada Perusahaan Pertambangan di Bursa Efek
Indonesia. Jurnal Manajemen Bisnis, 5(2), pp.174-191.
Ferrouhi, E.M., 2014. Moroccan Banks analysis using camel model. International
Journal of Economics and Financial Issues, 4(3), pp.622-627.
Hadi, W., 2018. Analysis of The Effect of Net Profit Margin, Return on Assets and
Return on Equity on Stock Price (Case Study on Consumption Industrial Sector
Companies Listed in Indonesian Sharia Stock Index at Indonesia Stock Exchange in
2016). The Management Journal of Binaniaga, 3(02), pp.81-92.
Hoque, A., Mia, A. and Anwar, R., 2015. Working capital management and
profitability: A study on cement industry in Bangladesh. Research Journal of Finance
and Accounting, 6(7), pp.18-28.
Khadafi, M., Heikal, M. and Ummah, A., 2014. Influence analysis of return on assets
(ROA), return on equity (ROE), net profit margin (NPM), debt to equity ratio (DER),
and current ratio (CR), against corporate profit growth in automotive in Indonesia
Stock Exchange. International Journal of Academic Research in Business and
Social Sciences, 4(12).
Khatik, S.K. and Varghese, T., 2015. Impact of Working Capital Management on
Firm Profitability: An Empirical Study of ITC Ltd. International Journal of Information,
Business and Management, 7(4), p.284.
Madhavi, K., 2014. Working capital management of paper mills. International Journal
of Research in Business Management, 2(3), pp.63-72.
Markets.ft.com. 2020. Australian Pacific Coal Ltd, AQC:ASX profile - FT.com.
[online] Available at: https://markets.ft.com/data/equities/tearsheet/profile?
s=AQC:ASX [Accessed 27 Jan. 2020].
overview, C. 2020. Corporate | Australian Pacific Coal . [online] Aqcltd.com.
Available at: http://www.aqcltd.com/site/corporate/corporate-overview [Accessed 27
Jan. 2020].
Purnomo, A., 2018. Influence of The Ratio of Profit Margin, Financial Leverage
Ratio, Current Ratio, Quick Ratio Against The Conditions and Financial
Distress. Indonesian Journal of Business, Accounting and Management, 1(1).
Rashid, C.A., 2018. Efficiency of Financial Ratios Analysis for Evaluating
Companies’ Liquidity. International Journal of Social Sciences & Educational
Studies, 4(4), pp.110-123.
⊘ This is a preview!⊘
Do you want full access?
Subscribe today to unlock all pages.
Trusted by 1+ million students worldwide

9BUSINESS FINANCE
Rba.gov.au. 2020. Exploration and the Listed Resource Sector. [online] Available at:
https://www.rba.gov.au/publications/bulletin/2012/sep/pdf/bu-0912-5.pdf [Accessed
27 Jan. 2020].
Sari, N.M.V. and Budiasih, I.G., 2014. Pengaruh Debt To Equity Ratio, Firm Size,
Inventory Turnover Dan Assets Turnover Pada Profitabilitas. E-Jurnal Akuntansi,
pp.261-273.
Singh, S., Darwish, T.K. and Potočnik, K., 2016. Measuring organizational
performance: A case for subjective measures. British Journal of Management, 27(1),
pp.214-224.
Varghese, T. and Dhote, K.K., 2014. Impact of working capital management on firm
profitability: A case study of HUL ltd., India. International Journal of Financial
Management, 4(4).
Paraphrase This Document
Need a fresh take? Get an instant paraphrase of this document with our AI Paraphraser
10BUSINESS FINANCE
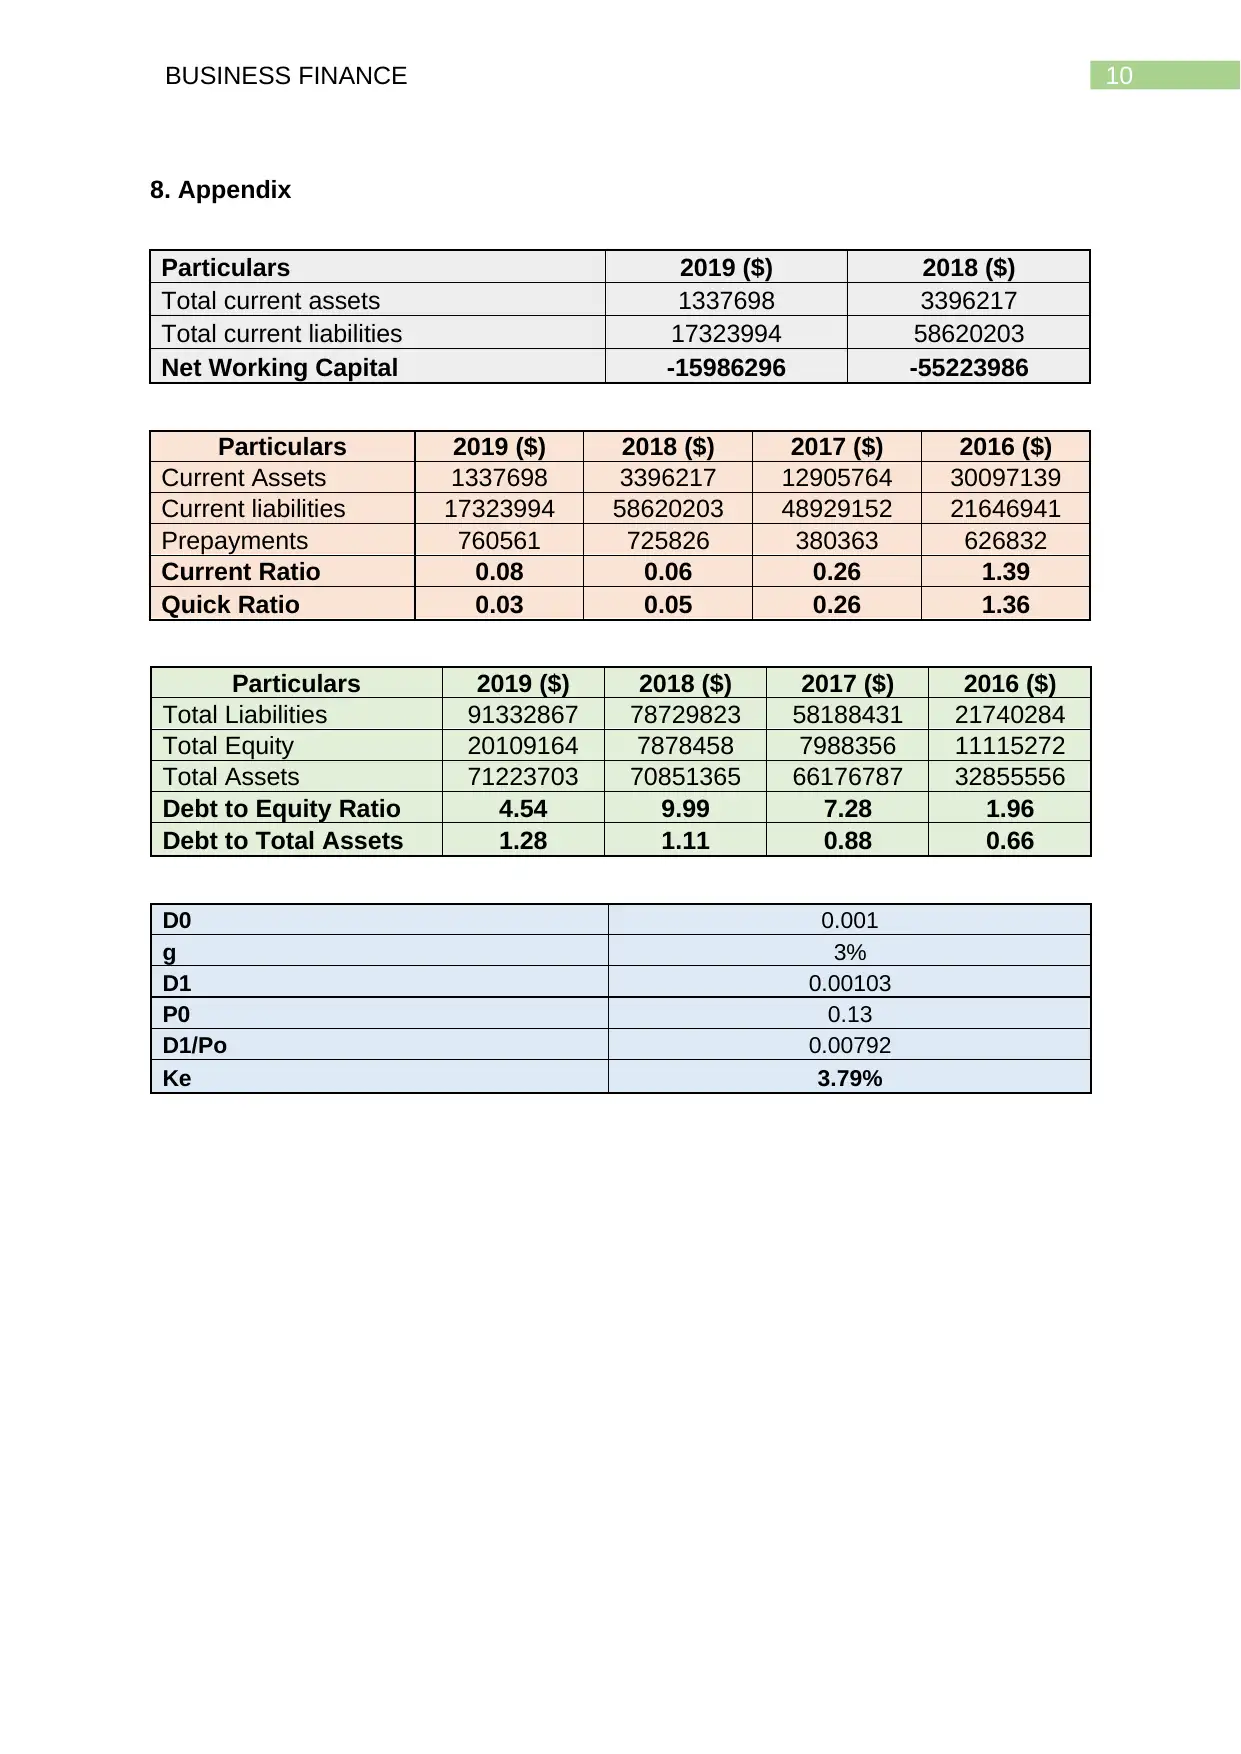
8. Appendix
Particulars 2019 ($) 2018 ($)
Total current assets 1337698 3396217
Total current liabilities 17323994 58620203
Net Working Capital -15986296 -55223986
Particulars 2019 ($) 2018 ($) 2017 ($) 2016 ($)
Current Assets 1337698 3396217 12905764 30097139
Current liabilities 17323994 58620203 48929152 21646941
Prepayments 760561 725826 380363 626832
Current Ratio 0.08 0.06 0.26 1.39
Quick Ratio 0.03 0.05 0.26 1.36
Particulars 2019 ($) 2018 ($) 2017 ($) 2016 ($)
Total Liabilities 91332867 78729823 58188431 21740284
Total Equity 20109164 7878458 7988356 11115272
Total Assets 71223703 70851365 66176787 32855556
Debt to Equity Ratio 4.54 9.99 7.28 1.96
Debt to Total Assets 1.28 1.11 0.88 0.66
D0 0.001
g 3%
D1 0.00103
P0 0.13
D1/Po 0.00792
Ke 3.79%
1 out of 11
Related Documents


Your All-in-One AI-Powered Toolkit for Academic Success.
+13062052269
info@desklib.com
Available 24*7 on WhatsApp / Email
![[object Object]](/_next/static/media/star-bottom.7253800d.svg)
Unlock your academic potential
Copyright © 2020–2026 A2Z Services. All Rights Reserved. Developed and managed by ZUCOL.