Economics Report: Australian Petroleum Market
VerifiedAdded on 2020/02/03
|15
|2072
|354
Report
AI Summary
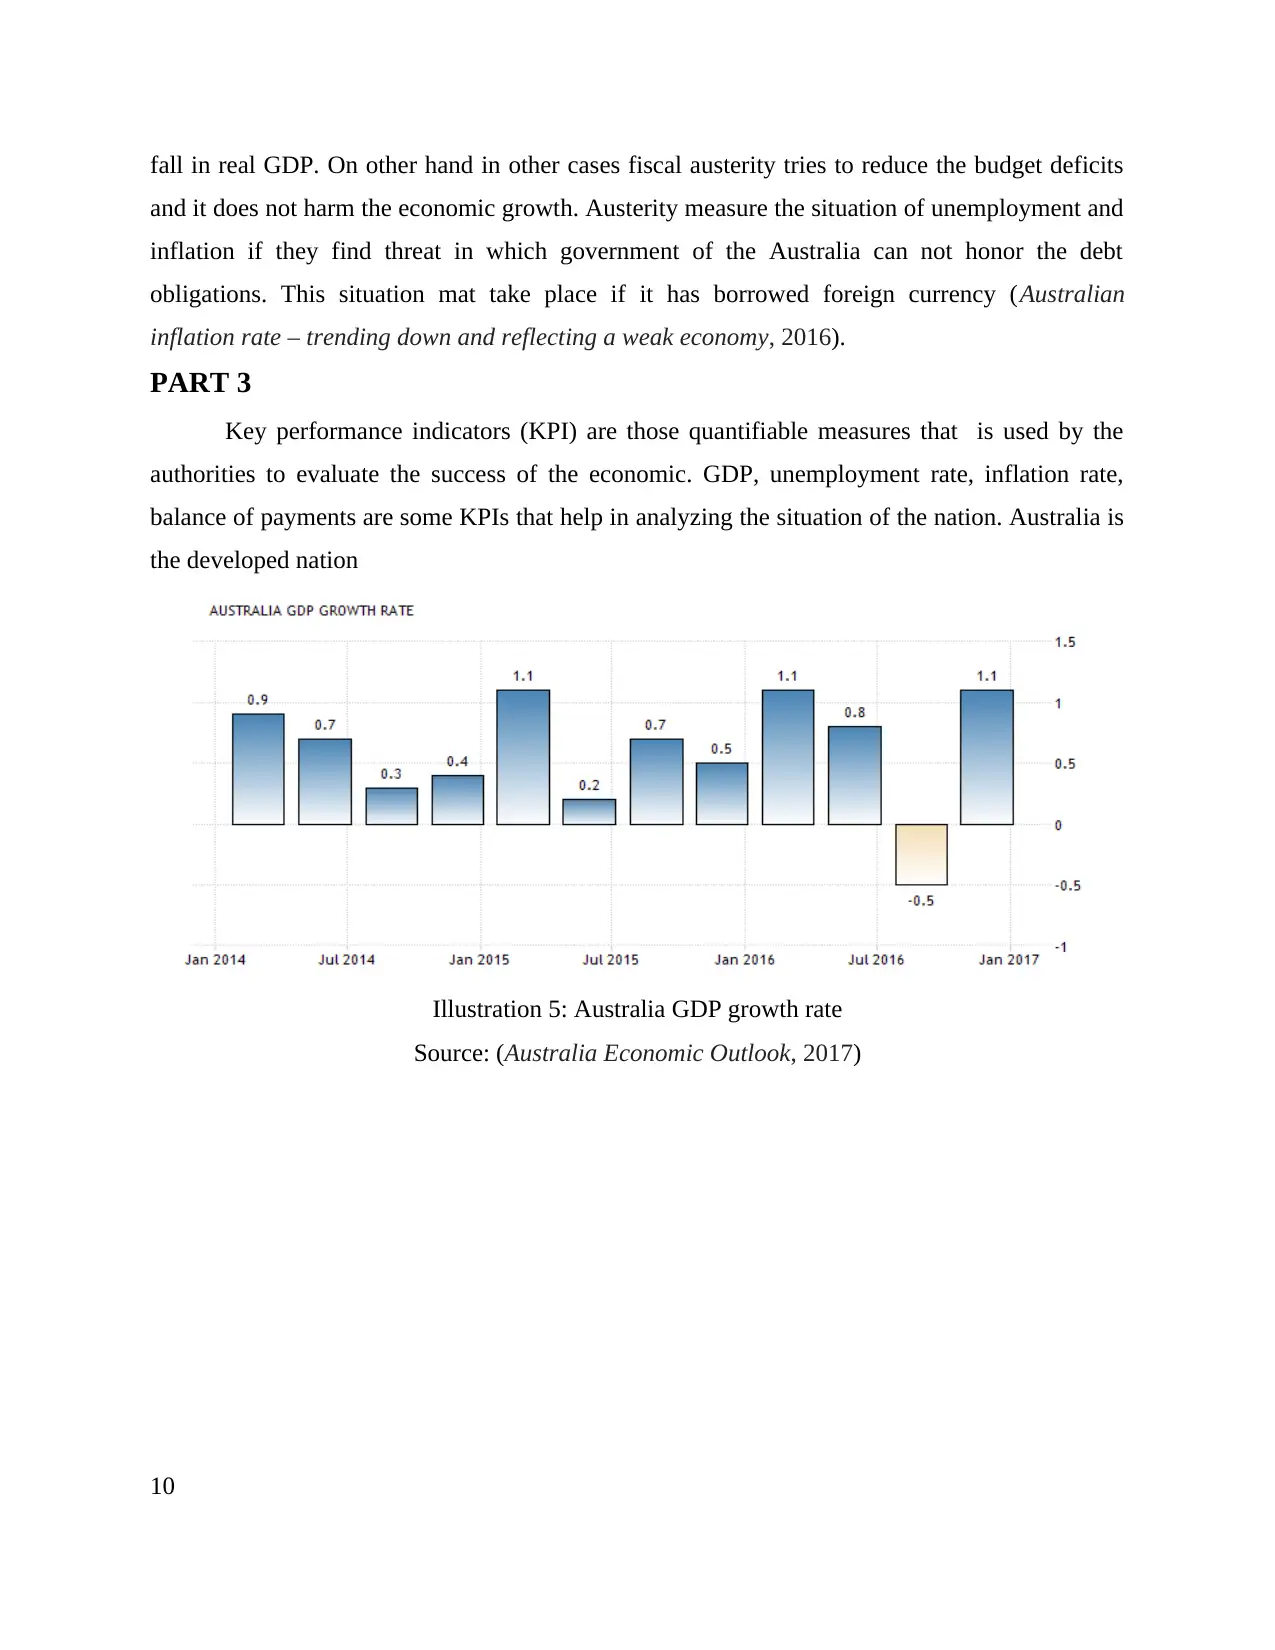
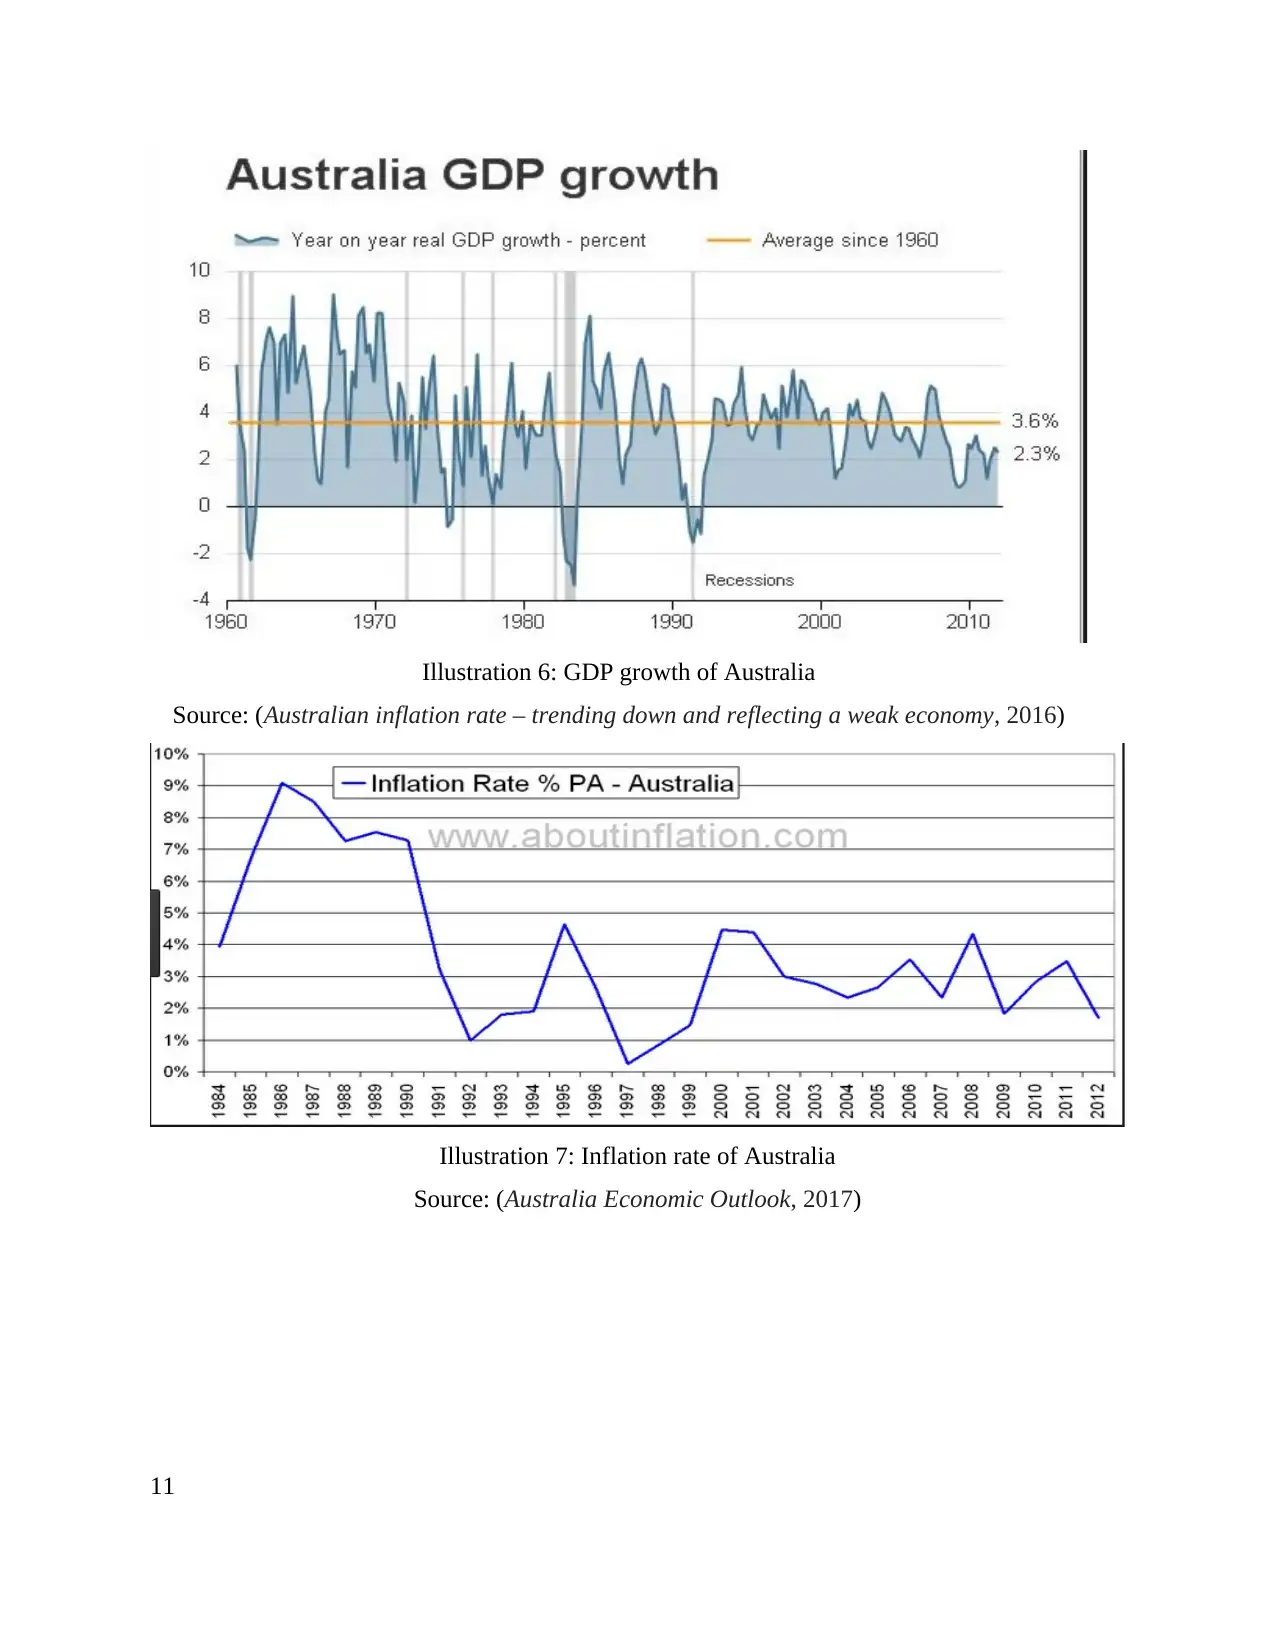
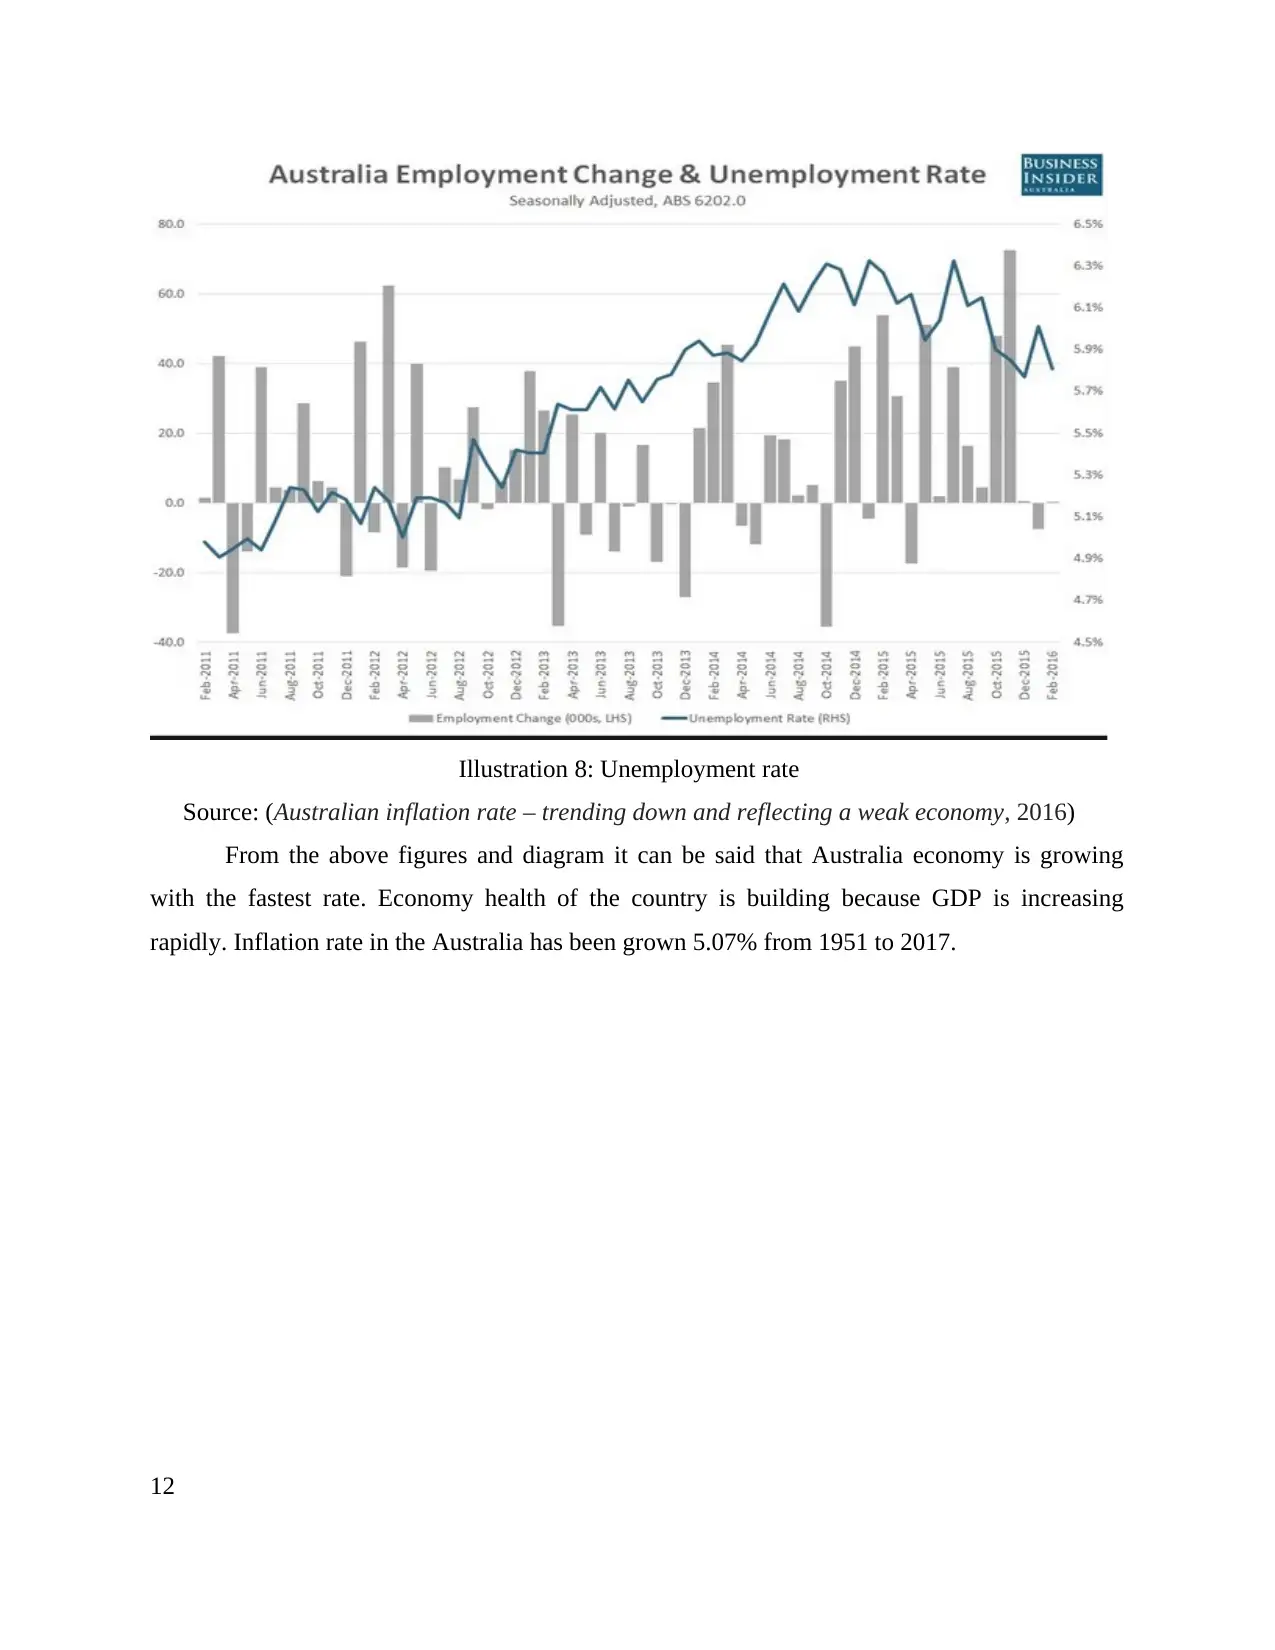
This economics report analyzes the Australian petroleum market, focusing on the market structure of petrol companies in both the wholesale and retail sectors. The report examines the oligopolistic nature of the wholesale market, dominated by a few major firms, and its impact on pricing and output. It also explores the competitive nature of the retail market and the implications for government policy. The report further calculates unemployment and labor force participation rates, analyzes changes in these rates, and discusses the impact of fiscal austerity measures. Finally, it assesses the overall economic health of Australia using key performance indicators like GDP, inflation, and unemployment, concluding that while Australia shows economic growth, improvements in employment opportunities are needed to strengthen its economic health.

Economics
Secure Best Marks with AI Grader
Need help grading? Try our AI Grader for instant feedback on your assignments.

TABLE OF CONTENTS
Introduction.....................................................................................................................................3
Part 1................................................................................................................................................3
1....................................................................................................................................................3
2....................................................................................................................................................5
3....................................................................................................................................................6
Part 2................................................................................................................................................7
1....................................................................................................................................................7
2....................................................................................................................................................9
3. ..................................................................................................................................................9
4....................................................................................................................................................9
Part 3..............................................................................................................................................10
Conclusion.....................................................................................................................................13
References......................................................................................................................................14
2

INTRODUCTION
Petroleum industry is one of the highest profit earning sector now days. In the Australia
there are many big corporations those which are paying high tax amount to the government that
helps in economic development of the country. Present report will discuss the market of petrol
companies in the wholesale sector (Golecha and Gan, 2016). Market structure of petrol station in
the retail sector will be illustrated in this report. Calculation of unemployment rate, LFPR% will
be done in this study.
PART 1
1.
a) Market structure of petrol companies in wholesale market
There are many types of structures such as perfect competition, monopoly, oligopoly,
monopolistic competition, contestable market etc. BP, Shell, Caltex, Mobil are the biggest firms
which are operating in this sector. These firms operate in the Oligopoly market wherein there are
few sellers those which dominate the entire market. They sell homogeneous products to the
buyers (Lade and Bushnell, 2016). It is the type of partial oligopoly market where few firms are
looked as price leaders and they make decision of pricing. In Australia, wholesale market is
shared between few petroleum companies and this is highly concentrated. They have power to
make decision of pricing and due to this demand and supply can get affected to great extent.
b) Graphical demonstration of price and output in collude situation
Price is the major factor that impact on the overall output to great extent. If four biggest
firms BP, Shell, Caltex, Mobil in Australia get colluded and they charge high prices then in such
condition demand will get affected to great extent (Sayaka, 2016).
3

By comparing the both graphs it can be said that in the Oligopoly market MC and Mr cut
each other and on the bases of that price is being decided. If these petroleum companies enhance
prices then it will affect the output and it will get down. On other hand when it comes to
4
Illustration 1: Graph of oligopoly market structure
Source: (Petit, 2015)
Illustration 2: Competitive market graph
Source: (Wang, 2016)
Secure Best Marks with AI Grader
Need help grading? Try our AI Grader for instant feedback on your assignments.

competitive market graphs that shows that AR=MR and on this point price is decided by the
firms that help in increasing the revenues and increasing output as well (Sacher and Sandford,
2016).
c) Benefits for government from increasing competition in the petrol sector
From the above graphical presentation it is found that if these four petroleum forms
increase prices then it will reduce the overall output. So if government increase the competition
in the petrol sector then it will control over the demand and supply thus prices will be stable that
will enhance total output. That means market will be able to gain high profit and by this way
more tax will be generated by the authorities of Australia. Authorities can make certain
regulations to control over the oligopoly market (Sukharev, 2014). It will reduce the dominant
position of leading firms and it will give more power in the hand of Australian government. By
this way they will be able to make control over prices and it will help in economic development
of the nation.
2.
Petrol stations in the retail sector follow the perfect competition market structure where
they have to sell homogeneous products and these retail station make normal profit. Due to
competitive pressures they keep low price. The main reason to operate in this structure is that it
helps them in increasing efficiency level and that change the demand that is beneficial for the
retail petrol stations. There is no risk of getting failure because same information and knowledge
is spread evenly in the retail sector (McLachlan, 2013). That is beneficial from the economic
point of view.
3.
5

6
Illustration 3: Abnormal profit
Sources: (Meara and et.al, 2015)
Illustration 3: Abnormal profit
Sources: (Meara and et.al, 2015)

Firms make economic profit in a competitive market then they get encouraged to enter in
the market. Because financial profit serves as inducement for the other new entry firms. But
when other firms enter in the market that increases supply and due to this prices will get down.
The falling prices of petrol will eliminate the profit of these new entities at that time further
entries get stopped. When firms start facing loss in the market then they will exit from the
competitive market that will decease supply and prices of the products will get enhanced, rising
pricing will eliminate the loss of at that time exit stops (Baum and Fisher, 20140.
PART 2
1.
Employed persons= Labour force- unemployed
Employed in Jan 2013=20000000-2260000
=17740000
Employed in Jul 2013=27000000-3267000
7
Illustration 4: Abnormal loss
Source: (Coale and Hoover, 2015)
Paraphrase This Document
Need a fresh take? Get an instant paraphrase of this document with our AI Paraphraser

Employed in Jul 2013=23733000
Unemployment rate= Number of unemployed/ total labour force*100
Unemployment rate in Jan 2013=2260000/20000000*100
=0.113*100
=11.3%
Unemployment rate in Jul 2013=3267000/27000000*100
=0.121*100
=12.1%
Labor force participation rate= Labor force/ total population *100
LFPR% in Jan 2013=20000000/40100000*100
=0.4987*100
=49.87%
LFPR% in Jul 2013=27000000/40900000*100
=0.6601*100
=66.01%
Formula Jan- 2013 Jul-2013
Working age
population (WAP)
40,100,000 40,900,000
Labour force (LF) 20,000,000 27,000,000
Unemployed 2,260,000 3,267,000
Employed Labour force-
unemployed
17740000 23733000
Unemployment
rate (%)
Number of
unemployed/ total
labour force*100
11.3% 12.1%
Labour force
participation rate
(LFPR%)
Labor force/ total
population *100
49.87% 66.01%
8

Inflation rate (%) 0.8 0.75%
2.
Changes in unemployment rate=11.3-12.1/11.3*100
=−7.07%
Changes in LFPR%=49.87-66.01/49.87*100
=−32.36%
By looking upon the calculated figures that inflation rate is decreasing that shows that job
situation is positive in the country Y.
3.
4.
Austerity is the economic policies in which government counteract the effects of
stabilizers. In some of the situation austerity help to reduce the budget deficit that will sharp the
9

fall in real GDP. On other hand in other cases fiscal austerity tries to reduce the budget deficits
and it does not harm the economic growth. Austerity measure the situation of unemployment and
inflation if they find threat in which government of the Australia can not honor the debt
obligations. This situation mat take place if it has borrowed foreign currency (Australian
inflation rate – trending down and reflecting a weak economy, 2016).
PART 3
Key performance indicators (KPI) are those quantifiable measures that is used by the
authorities to evaluate the success of the economic. GDP, unemployment rate, inflation rate,
balance of payments are some KPIs that help in analyzing the situation of the nation. Australia is
the developed nation
Illustration 5: Australia GDP growth rate
Source: (Australia Economic Outlook, 2017)
10
Secure Best Marks with AI Grader
Need help grading? Try our AI Grader for instant feedback on your assignments.

Illustration 6: GDP growth of Australia
Source: (Australian inflation rate – trending down and reflecting a weak economy, 2016)
Illustration 7: Inflation rate of Australia
Source: (Australia Economic Outlook, 2017)
11
Source: (Australian inflation rate – trending down and reflecting a weak economy, 2016)
Illustration 7: Inflation rate of Australia
Source: (Australia Economic Outlook, 2017)
11

Illustration 8: Unemployment rate
Source: (Australian inflation rate – trending down and reflecting a weak economy, 2016)
From the above figures and diagram it can be said that Australia economy is growing
with the fastest rate. Economy health of the country is building because GDP is increasing
rapidly. Inflation rate in the Australia has been grown 5.07% from 1951 to 2017.
12

By looking upon the graph it can be said that inflation rate in the 2016 was 1% but it reached to
2.1% in the year 2017. That shows inflation is increasing very rapidly. By looking upon the
Australian inflation rate it is reflected that economy condition of the nation is very weak. It is
quit steeply downwards. Economy of the Australia is highly depended upon the service and
export sector (Australian inflation rate – trending down and reflecting a weak economy, 2016).
Overall economic health of the nation is stable but it is required to improve it more.
Unemployment rate is increasing gradually, government is required to put more efforts to
enhance employment opportunities in the country so that GDP can get improved, that will help in
making economic health of the Australia stronger.
CONCLUSION
From the above report it can be said that Australia is growing well but by improving
employment opportunities its economic condition can be enhanced. Petroleum companies have
strong command over the market and they can influence the demand and supply. From the report
it can be said that if there is economic profit then new firms enter into the market and if they face
loss then they exist the market.
13
Illustration 9: Inflation rate of Australia
Source:(Baum and Fisher, 2014)
Paraphrase This Document
Need a fresh take? Get an instant paraphrase of this document with our AI Paraphraser

REFERENCES
Books and Journals
Baum, F. and Fisher, M., 2014. Why behavioural health promotion endures despite its failure to
reduce health inequities. Sociology of health & illness. 36(2). pp.213-225.
Coale, A. J. and Hoover, E. M., 2015. Population growth and economic development. Princeton
University Press.
Golecha, R. and Gan, J., 2016. Optimal contracting structure between cellulosic biorefineries and
farmers to reduce the impact of biomass supply variation: game theoretic
analysis. Biofuels, Bioproducts and Biorefining.
Lade, G. E. and Bushnell, J., 2016. Fuel Subsidy Pass-Through and Market Structure: Evidence
from the Renewable Fuel Standard.
McLachlan, R., 2013. Deep and Persistent Disadvantage in Australia-Productivity Commission
Staff Working Paper.
Meara, J. G. and et.al., 2015. Global Surgery 2030: evidence and solutions for achieving health,
welfare, and economic development. The Lancet. 386(9993). pp.569-624.
Petit, N., 2015. Intel, leveraging rebates and the goals of Article 102 TFEU.European
Competition Journal. 11(1). pp.26-68.
Sacher, S. B. and Sandford, J., 2016. No Shortage of Theories: The Role of Capacity in Antitrust
Analysis.
Sayaka, B., 2016. Market structure of the corn seed industry in East Java.Jurnal Agro
Ekonomi. 24(2). pp.133-156.
Sukharev, O. S., 2014. Economic Growth, Welfare and Institutional Changes: Game and
Aggregate Model. Universal Journal of Industrial and Business Management. 2(5).
pp.111-118.
Wang, T., 2016. Espionage and Disclosure of Cost Information in Cournot Duopoly.
Online
Australia Economic Outlook, 2017. [Online] Available through: <http://www.focus-
economics.com/countries/australia>. [Accessed on 16th May 2017].
14

Australian inflation rate – trending down and reflecting a weak economy, 2016. [Online]
Available through: <http://bilbo.economicoutlook.net/blog/?p=34061>. [Accessed on 16th
May 2017].
15
Available through: <http://bilbo.economicoutlook.net/blog/?p=34061>. [Accessed on 16th
May 2017].
15
1 out of 15
Related Documents

Your All-in-One AI-Powered Toolkit for Academic Success.
+13062052269
info@desklib.com
Available 24*7 on WhatsApp / Email
Unlock your academic potential
© 2024 | Zucol Services PVT LTD | All rights reserved.