University Financial Statement Analysis of API Ltd: Report
VerifiedAdded on 2023/06/05
|21
|4804
|458
Report
AI Summary
This report provides a comprehensive financial statement analysis of Australian Pharmaceuticals Industries Ltd (API Ltd), examining its performance over a five-year period. The analysis employs trend analysis, various accounting tools, and ratio analysis to assess the company's growth and financial health. It delves into macroeconomic factors, including government regulations and demographic trends, and their impact on API Ltd's operations. Industry and business strategy analyses, along with Porter's Five Forces model, are used to evaluate the company's competitive landscape. The report explores liquidity, solvency, activity, and profitability ratios, such as current ratio, quick ratio, return on equity, and asset turnover, to provide insights into API Ltd's financial risk and cash flow management. The study highlights key findings and implications of each ratio, offering a detailed overview of the company's financial position and performance trends. The report concludes with a discussion of the significant factors affecting profit margins, including selling, general, warehousing, and financial expenses, and suggests strategic recommendations for improvement.
Running head: FINANCIAL STATEMENT ANALYSIS
Financial Statement Analysis
Name of the Student:
Name of the University:
Author’s Note:
Word Count: 2100 words.
Financial Statement Analysis
Name of the Student:
Name of the University:
Author’s Note:
Word Count: 2100 words.
Paraphrase This Document
Need a fresh take? Get an instant paraphrase of this document with our AI Paraphraser
1FINANCIAL STATEMENT ANALYSIS
Executive Summary
The aim of the report is to show the changes in the company’s financial statement over the five year
horizon period. The financial review of the company have been performed using trend analysis and
various accounting tools. The ratio analysis and percentage analysis of the company provides an
oversight of the company’s trend in growth and performance of the company. The project also tells
about the various changes in the economy and sector and its influence on company’s operations. The
financial risk analysis along with the cash flow management of the company using ratio analysis.
2FINANCIAL STATEMENT ANALYSIS
Introduction
The Australian Pharmaceuticals Industries Ltd operates in the pharmaceuticals sector. There
were several oversight given into the company. The study of the report is outlined in our assignment.
Macro-Economic Analysis was carried for determining the conditions and factors under which the
company operates. There are certain government rules and regulations, demographic trend and level
of disposable income factors which are discussed in the macroeconomic section.
Through this detailed study of the macro-economic conditions we get to know that the
company may face hurdles in the upcoming five year of horizon time period due to strict rules and
regulations of the government. The company may be able to deliver superior returns in contrast to its
superiors if the company increase the operational and efficiency level of the operations of the
company. The company’s industry and business strategy analysis was performed to analyse the
operations of the company. As part of the Industry Analysis and Business strategy the position of the
company’s product and portfolio analysis was performed (Cook 2016).
The report also shows the conducted accounting analysis and ratio analysis performed where
the financials and operations of the company shows stable and less volatility.
Discussion
Macro-Economic Policy
Macro-Economic Policy, Industry and Business Factors influence the working conditions of a
company. These factors directly and indirectly impacts the company’s operations, it is essential to
know the factors as these are reflected rough the fundamentals and financials of the company. The
Australian Pharmaceuticals Ltd is having the largest market share in wholesale distribution of
pharmaceuticals and other health care products (Borio 2014). The financial report for the company of
2017 shows the revenue segment analysis where the company has majority of its revenue earning
around 95% from Australia and other from New Zealand. The Australian Government policy changes
could influence significantly company’s operations. Certain regulatory reforms, policy and procedures
⊘ This is a preview!⊘
Do you want full access?
Subscribe today to unlock all pages.
Trusted by 1+ million students worldwide
3FINANCIAL STATEMENT ANALYSIS
have severally impacted the company operation from the year 2015, the demand for branded products
was affected by the introduction of Pharmaceutical Benefit scheme (P.B.S) where customers prefer
switching to generic products. The demographic trend for the company are useful as the elderly
population of Australia is growing. The Australian elderly population is APL biggest market. The
future income growth for the company depend on the disposable income and the consumer spending.
Increase in household disposable income and gross earnings will have a positive impact and influence
on the company (Mankiw 2014).
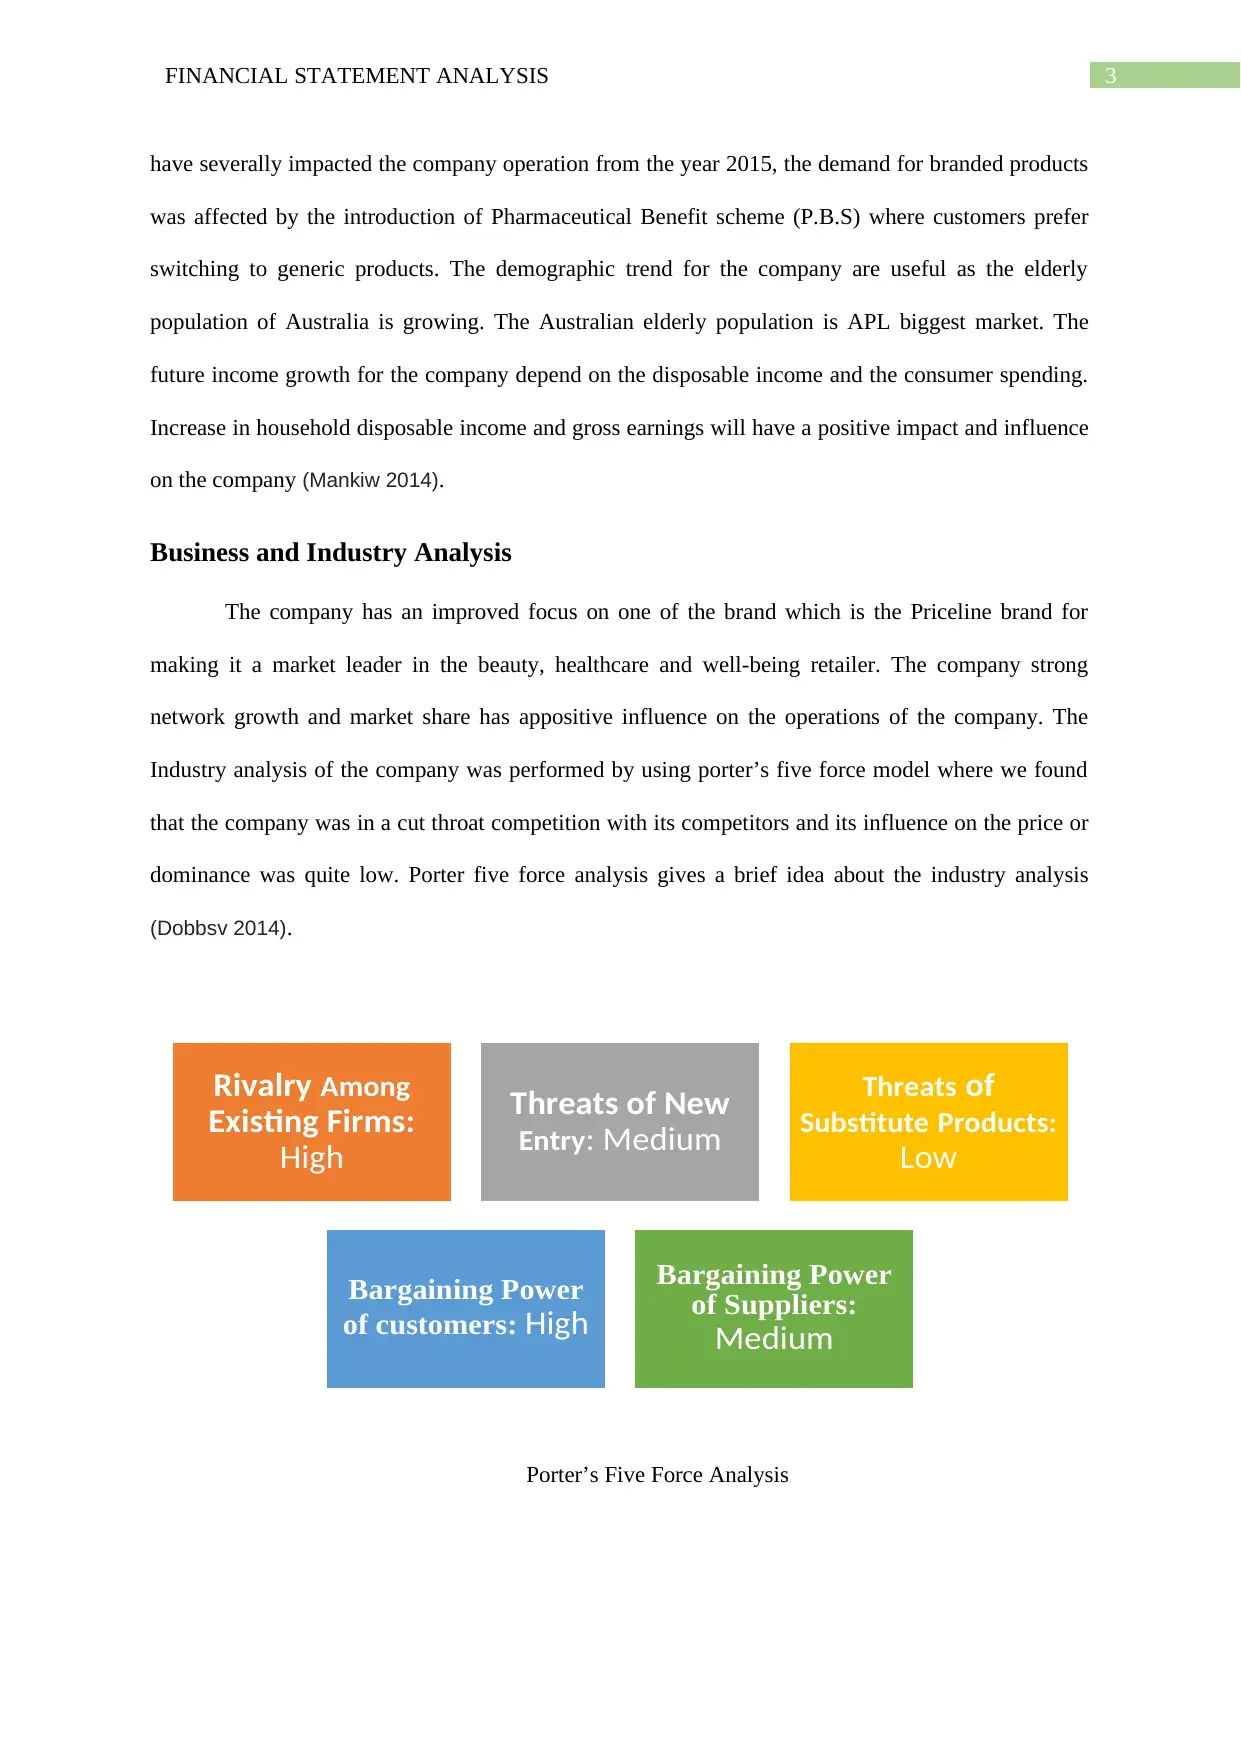
Business and Industry Analysis
The company has an improved focus on one of the brand which is the Priceline brand for
making it a market leader in the beauty, healthcare and well-being retailer. The company strong
network growth and market share has appositive influence on the operations of the company. The
Industry analysis of the company was performed by using porter’s five force model where we found
that the company was in a cut throat competition with its competitors and its influence on the price or
dominance was quite low. Porter five force analysis gives a brief idea about the industry analysis
(Dobbsv 2014).
Porter’s Five Force Analysis
Rivalry Among
Existing Firms:
High
Threats of New
Entry : Medium
Threats of
Substitute Products:
Low
Bargaining Power
of customers: High
Bargaining Power
of Suppliers:
Medium
have severally impacted the company operation from the year 2015, the demand for branded products
was affected by the introduction of Pharmaceutical Benefit scheme (P.B.S) where customers prefer
switching to generic products. The demographic trend for the company are useful as the elderly
population of Australia is growing. The Australian elderly population is APL biggest market. The
future income growth for the company depend on the disposable income and the consumer spending.
Increase in household disposable income and gross earnings will have a positive impact and influence
on the company (Mankiw 2014).
Business and Industry Analysis
The company has an improved focus on one of the brand which is the Priceline brand for
making it a market leader in the beauty, healthcare and well-being retailer. The company strong
network growth and market share has appositive influence on the operations of the company. The
Industry analysis of the company was performed by using porter’s five force model where we found
that the company was in a cut throat competition with its competitors and its influence on the price or
dominance was quite low. Porter five force analysis gives a brief idea about the industry analysis
(Dobbsv 2014).
Porter’s Five Force Analysis
Rivalry Among
Existing Firms:
High
Threats of New
Entry : Medium
Threats of
Substitute Products:
Low
Bargaining Power
of customers: High
Bargaining Power
of Suppliers:
Medium
Paraphrase This Document
Need a fresh take? Get an instant paraphrase of this document with our AI Paraphraser
4FINANCIAL STATEMENT ANALYSIS
Ratio Analysis
Ratio Analysis provides a trend analysis of the company’s financial operations and it’s also provides
investors with important details of company’s financials. The return on equity is the ratio, which has
been emphasized a lot because it indicates the performance of the company. The ratio is calculated as
a percentage of net income in contrast to the shareholders equity of a company. The ratio analysis was
done on the basis of five year trend analysis and the implications of each ratio on the financials and
workings of the company.
Liquidity Ratio
The ratio measure a company ability for meeting up and paying of the short term obligations of the
company. The liquidity ratio for the company has remained stable this shows that the company is
efficiently utilising the current assets of the company (Law 2018).
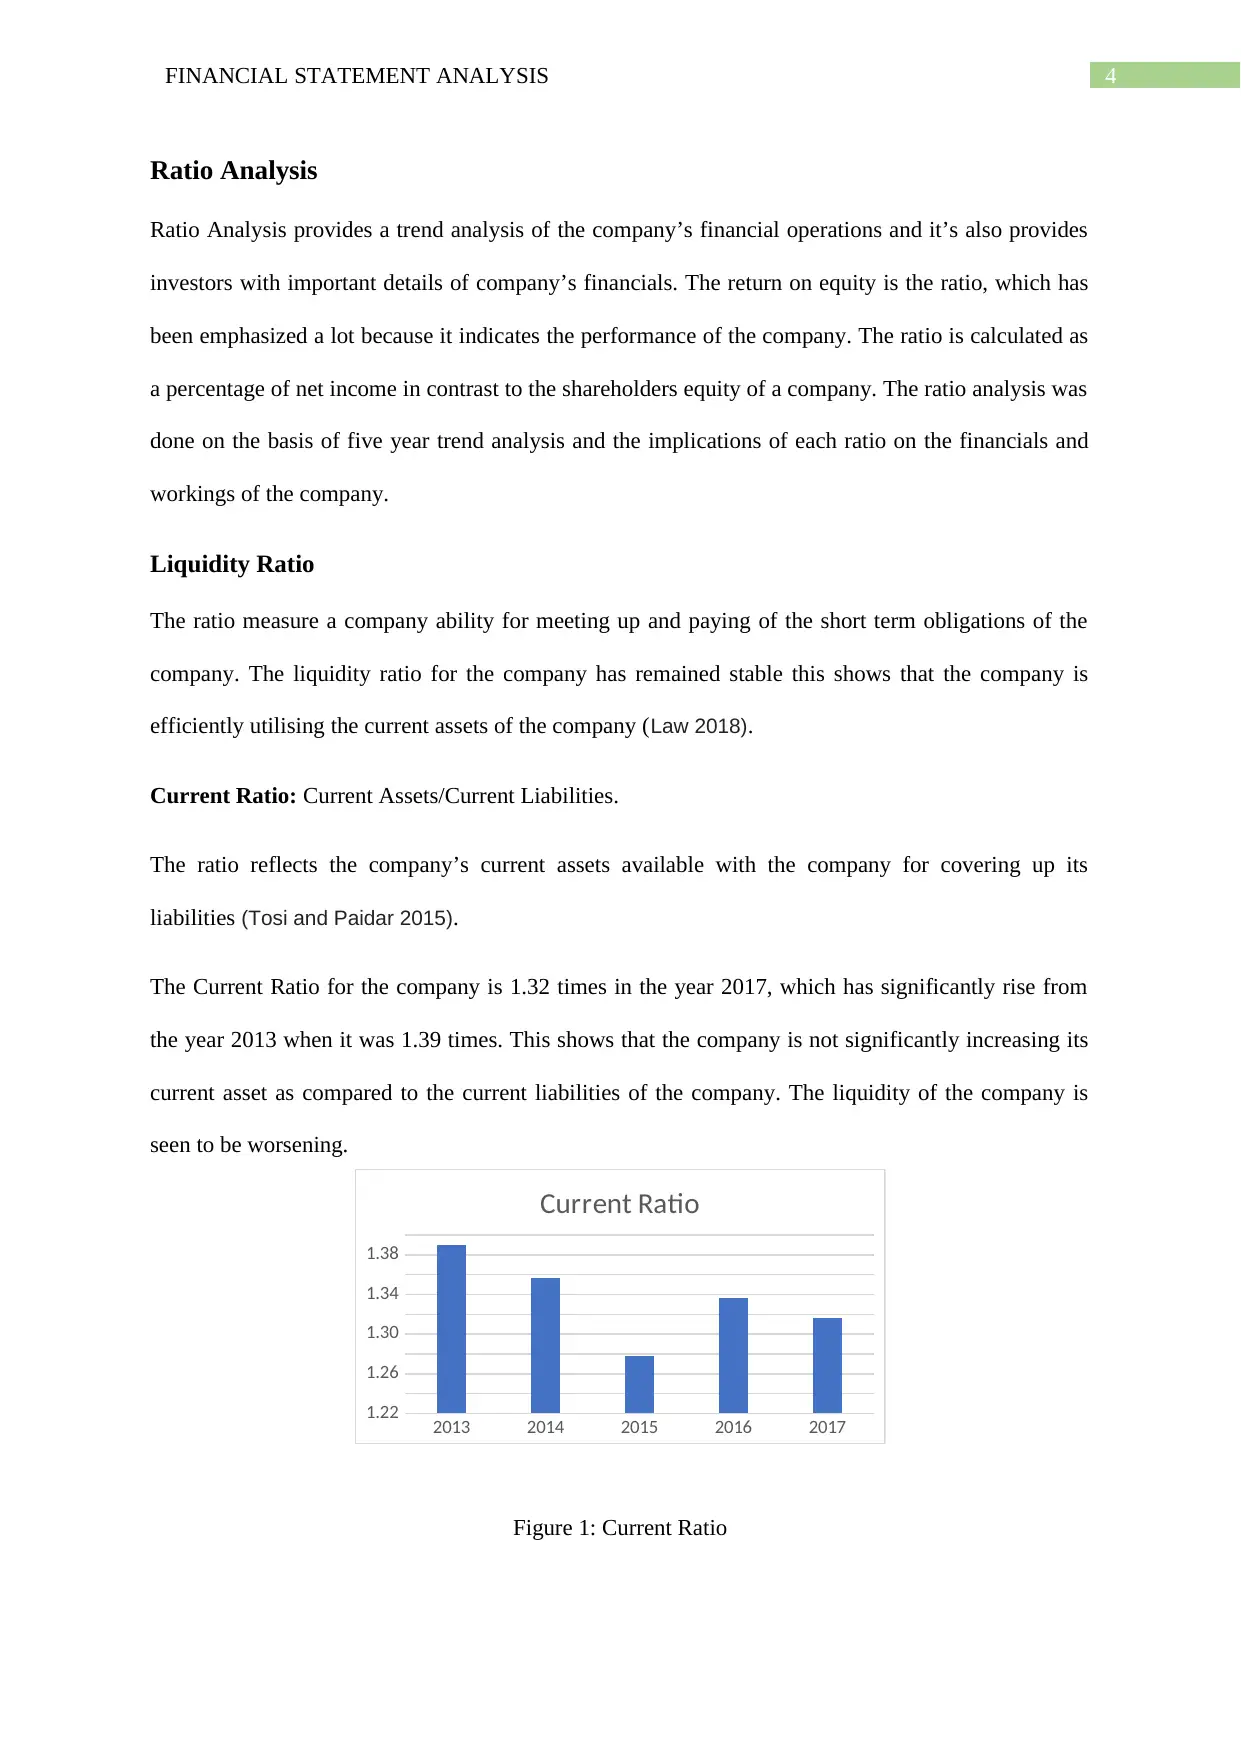
Current Ratio: Current Assets/Current Liabilities.
The ratio reflects the company’s current assets available with the company for covering up its
liabilities (Tosi and Paidar 2015).
The Current Ratio for the company is 1.32 times in the year 2017, which has significantly rise from
the year 2013 when it was 1.39 times. This shows that the company is not significantly increasing its
current asset as compared to the current liabilities of the company. The liquidity of the company is
seen to be worsening.
Figure 1: Current Ratio
2013 2014 2015 2016 2017
1.22
1.26
1.30
1.34
1.38
Current Ratio
Ratio Analysis
Ratio Analysis provides a trend analysis of the company’s financial operations and it’s also provides
investors with important details of company’s financials. The return on equity is the ratio, which has
been emphasized a lot because it indicates the performance of the company. The ratio is calculated as
a percentage of net income in contrast to the shareholders equity of a company. The ratio analysis was
done on the basis of five year trend analysis and the implications of each ratio on the financials and
workings of the company.
Liquidity Ratio
The ratio measure a company ability for meeting up and paying of the short term obligations of the
company. The liquidity ratio for the company has remained stable this shows that the company is
efficiently utilising the current assets of the company (Law 2018).
Current Ratio: Current Assets/Current Liabilities.
The ratio reflects the company’s current assets available with the company for covering up its
liabilities (Tosi and Paidar 2015).
The Current Ratio for the company is 1.32 times in the year 2017, which has significantly rise from
the year 2013 when it was 1.39 times. This shows that the company is not significantly increasing its
current asset as compared to the current liabilities of the company. The liquidity of the company is
seen to be worsening.
Figure 1: Current Ratio
2013 2014 2015 2016 2017
1.22
1.26
1.30
1.34
1.38
Current Ratio
5FINANCIAL STATEMENT ANALYSIS
Source: Appendix 1
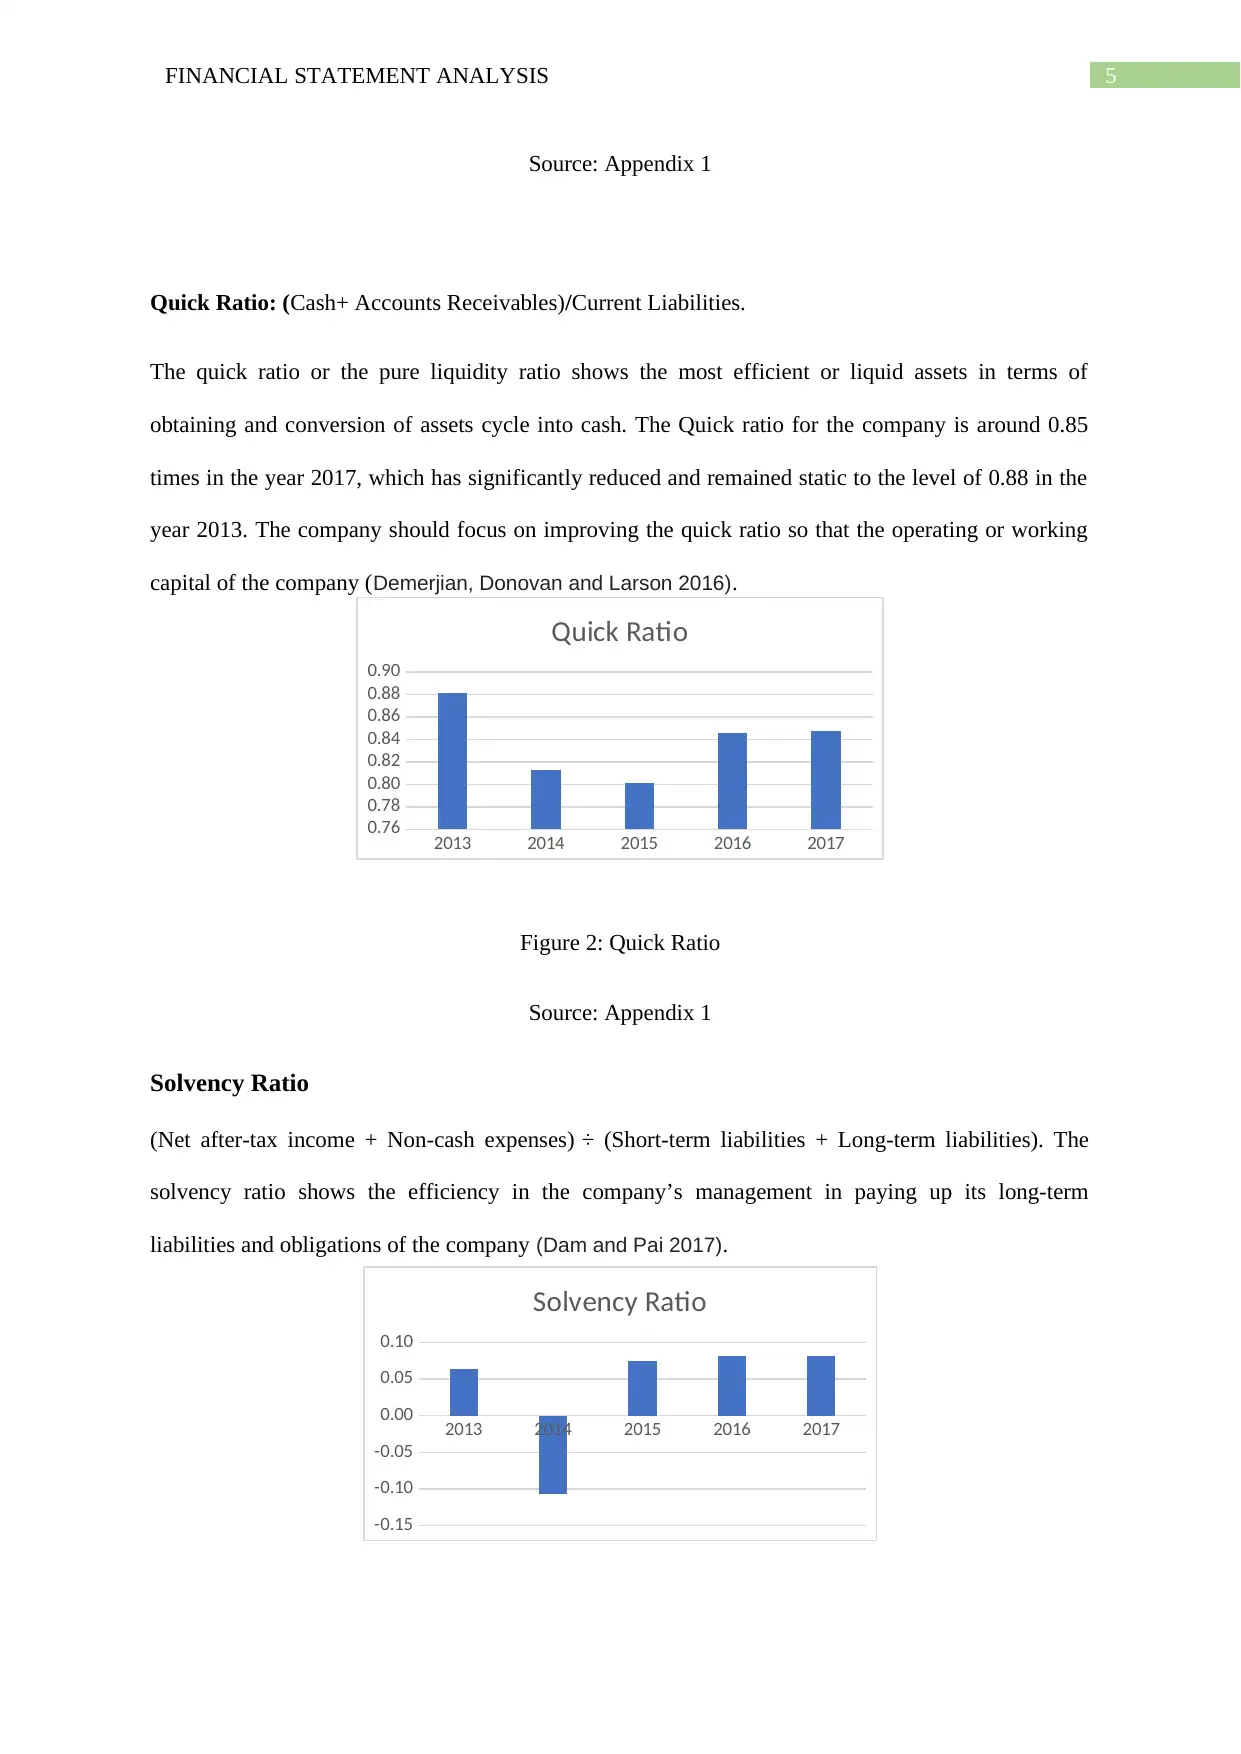
Quick Ratio: (Cash+ Accounts Receivables)/Current Liabilities.
The quick ratio or the pure liquidity ratio shows the most efficient or liquid assets in terms of
obtaining and conversion of assets cycle into cash. The Quick ratio for the company is around 0.85
times in the year 2017, which has significantly reduced and remained static to the level of 0.88 in the
year 2013. The company should focus on improving the quick ratio so that the operating or working
capital of the company (Demerjian, Donovan and Larson 2016).
Figure 2: Quick Ratio
Source: Appendix 1
Solvency Ratio
(Net after-tax income + Non-cash expenses) ÷ (Short-term liabilities + Long-term liabilities). The
solvency ratio shows the efficiency in the company’s management in paying up its long-term
liabilities and obligations of the company (Dam and Pai 2017).
2013 2014 2015 2016 2017
0.76
0.78
0.80
0.82
0.84
0.86
0.88
0.90
Quick Ratio
2013 2014 2015 2016 2017
-0.15
-0.10
-0.05
0.00
0.05
0.10
Solvency Ratio
Source: Appendix 1
Quick Ratio: (Cash+ Accounts Receivables)/Current Liabilities.
The quick ratio or the pure liquidity ratio shows the most efficient or liquid assets in terms of
obtaining and conversion of assets cycle into cash. The Quick ratio for the company is around 0.85
times in the year 2017, which has significantly reduced and remained static to the level of 0.88 in the
year 2013. The company should focus on improving the quick ratio so that the operating or working
capital of the company (Demerjian, Donovan and Larson 2016).
Figure 2: Quick Ratio
Source: Appendix 1
Solvency Ratio
(Net after-tax income + Non-cash expenses) ÷ (Short-term liabilities + Long-term liabilities). The
solvency ratio shows the efficiency in the company’s management in paying up its long-term
liabilities and obligations of the company (Dam and Pai 2017).
2013 2014 2015 2016 2017
0.76
0.78
0.80
0.82
0.84
0.86
0.88
0.90
Quick Ratio
2013 2014 2015 2016 2017
-0.15
-0.10
-0.05
0.00
0.05
0.10
Solvency Ratio
⊘ This is a preview!⊘
Do you want full access?
Subscribe today to unlock all pages.
Trusted by 1+ million students worldwide
6FINANCIAL STATEMENT ANALYSIS
Figure 3: Solvency Ratio
Source: Appendix 1
The solvency ratio for the company in the year 2013 was 0.06 times and the ratio has shown some
volatility in the five-year trend but the ratio for the year 2017 was 0.08 times a slight improvement in
the company’s ability in paying of paying of its long term liabilities.
Activity Ratio
The Activity ratio for the company represents the company’s ability of conversion of company
financial component into revenue.
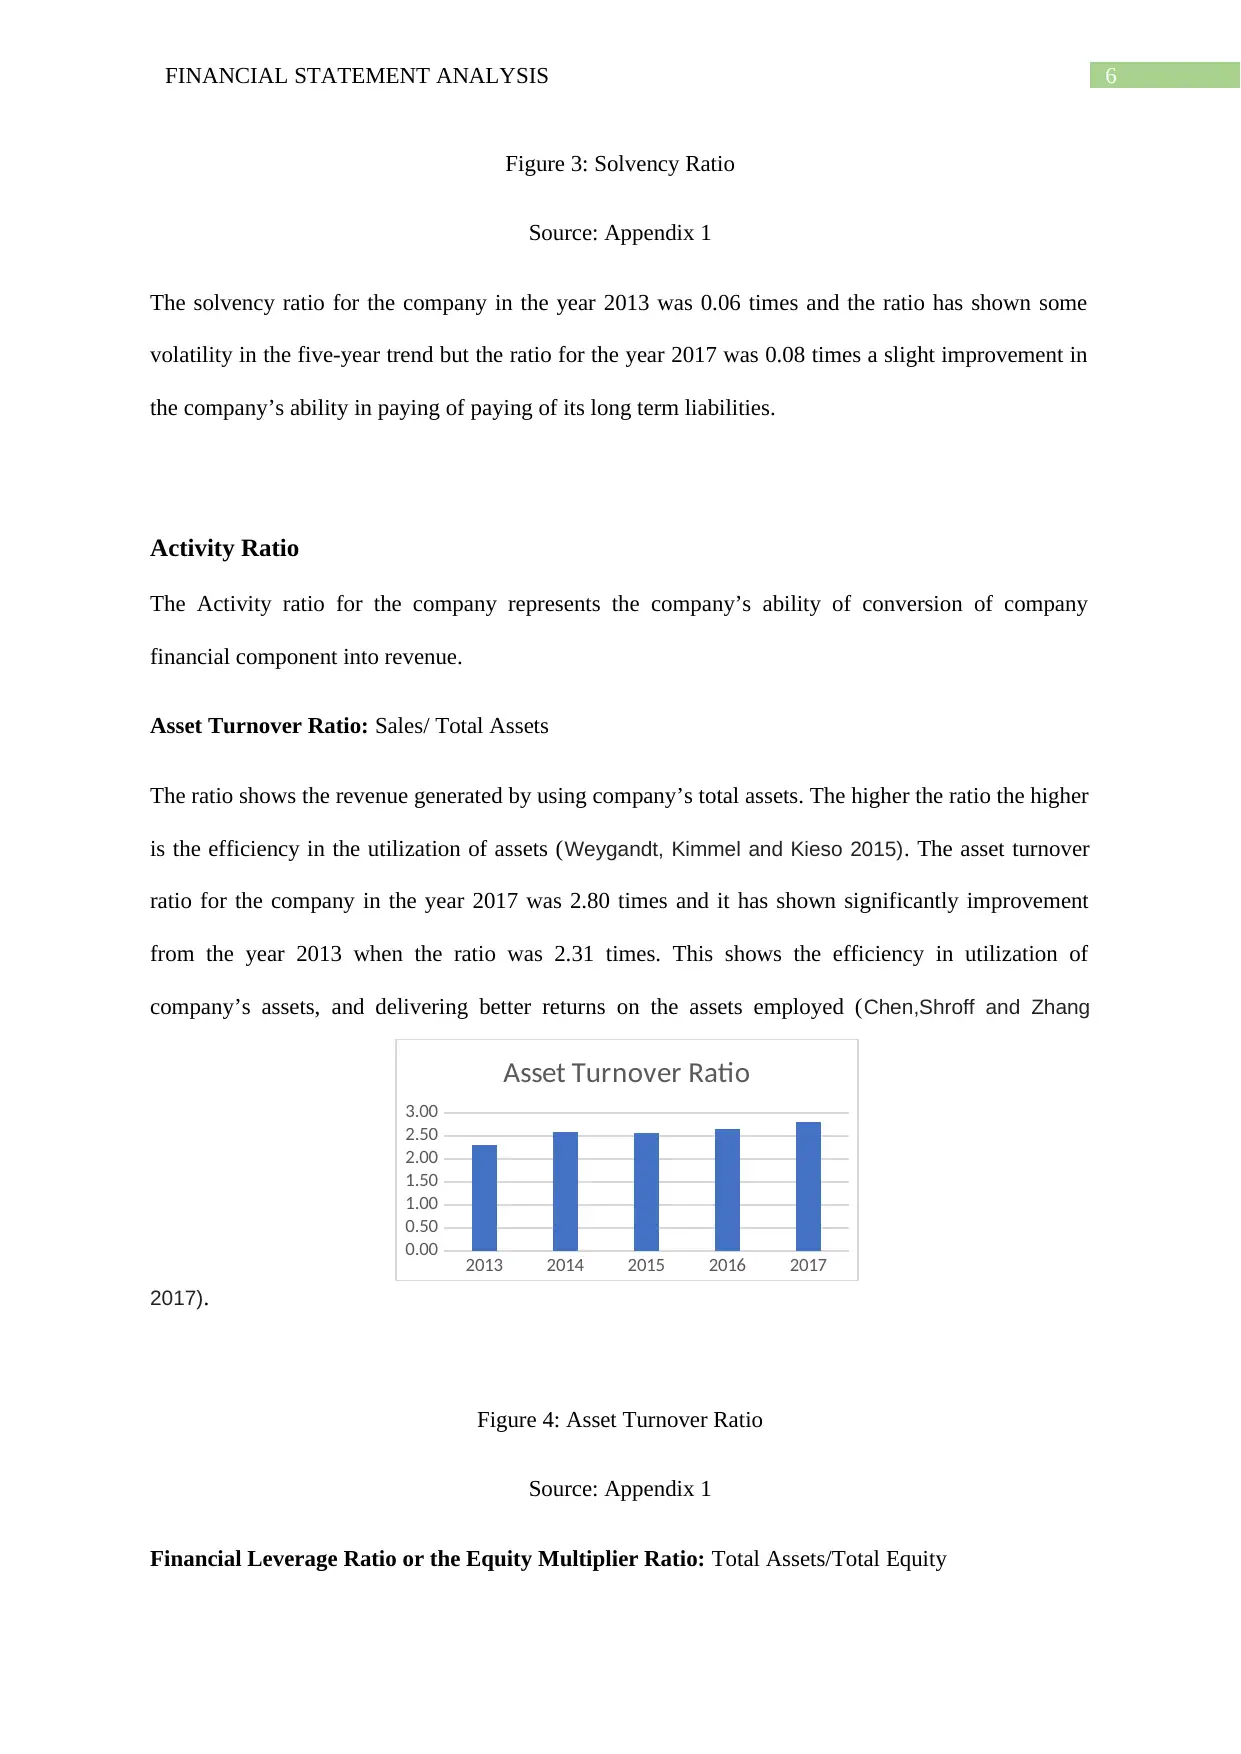
Asset Turnover Ratio: Sales/ Total Assets
The ratio shows the revenue generated by using company’s total assets. The higher the ratio the higher
is the efficiency in the utilization of assets (Weygandt, Kimmel and Kieso 2015). The asset turnover
ratio for the company in the year 2017 was 2.80 times and it has shown significantly improvement
from the year 2013 when the ratio was 2.31 times. This shows the efficiency in utilization of
company’s assets, and delivering better returns on the assets employed (Chen,Shroff and Zhang
2017).
Figure 4: Asset Turnover Ratio
Source: Appendix 1
Financial Leverage Ratio or the Equity Multiplier Ratio: Total Assets/Total Equity
2013 2014 2015 2016 2017
0.00
0.50
1.00
1.50
2.00
2.50
3.00
Asset Turnover Ratio
Figure 3: Solvency Ratio
Source: Appendix 1
The solvency ratio for the company in the year 2013 was 0.06 times and the ratio has shown some
volatility in the five-year trend but the ratio for the year 2017 was 0.08 times a slight improvement in
the company’s ability in paying of paying of its long term liabilities.
Activity Ratio
The Activity ratio for the company represents the company’s ability of conversion of company
financial component into revenue.
Asset Turnover Ratio: Sales/ Total Assets
The ratio shows the revenue generated by using company’s total assets. The higher the ratio the higher
is the efficiency in the utilization of assets (Weygandt, Kimmel and Kieso 2015). The asset turnover
ratio for the company in the year 2017 was 2.80 times and it has shown significantly improvement
from the year 2013 when the ratio was 2.31 times. This shows the efficiency in utilization of
company’s assets, and delivering better returns on the assets employed (Chen,Shroff and Zhang
2017).
Figure 4: Asset Turnover Ratio
Source: Appendix 1
Financial Leverage Ratio or the Equity Multiplier Ratio: Total Assets/Total Equity
2013 2014 2015 2016 2017
0.00
0.50
1.00
1.50
2.00
2.50
3.00
Asset Turnover Ratio
Paraphrase This Document
Need a fresh take? Get an instant paraphrase of this document with our AI Paraphraser
7FINANCIAL STATEMENT ANALYSIS
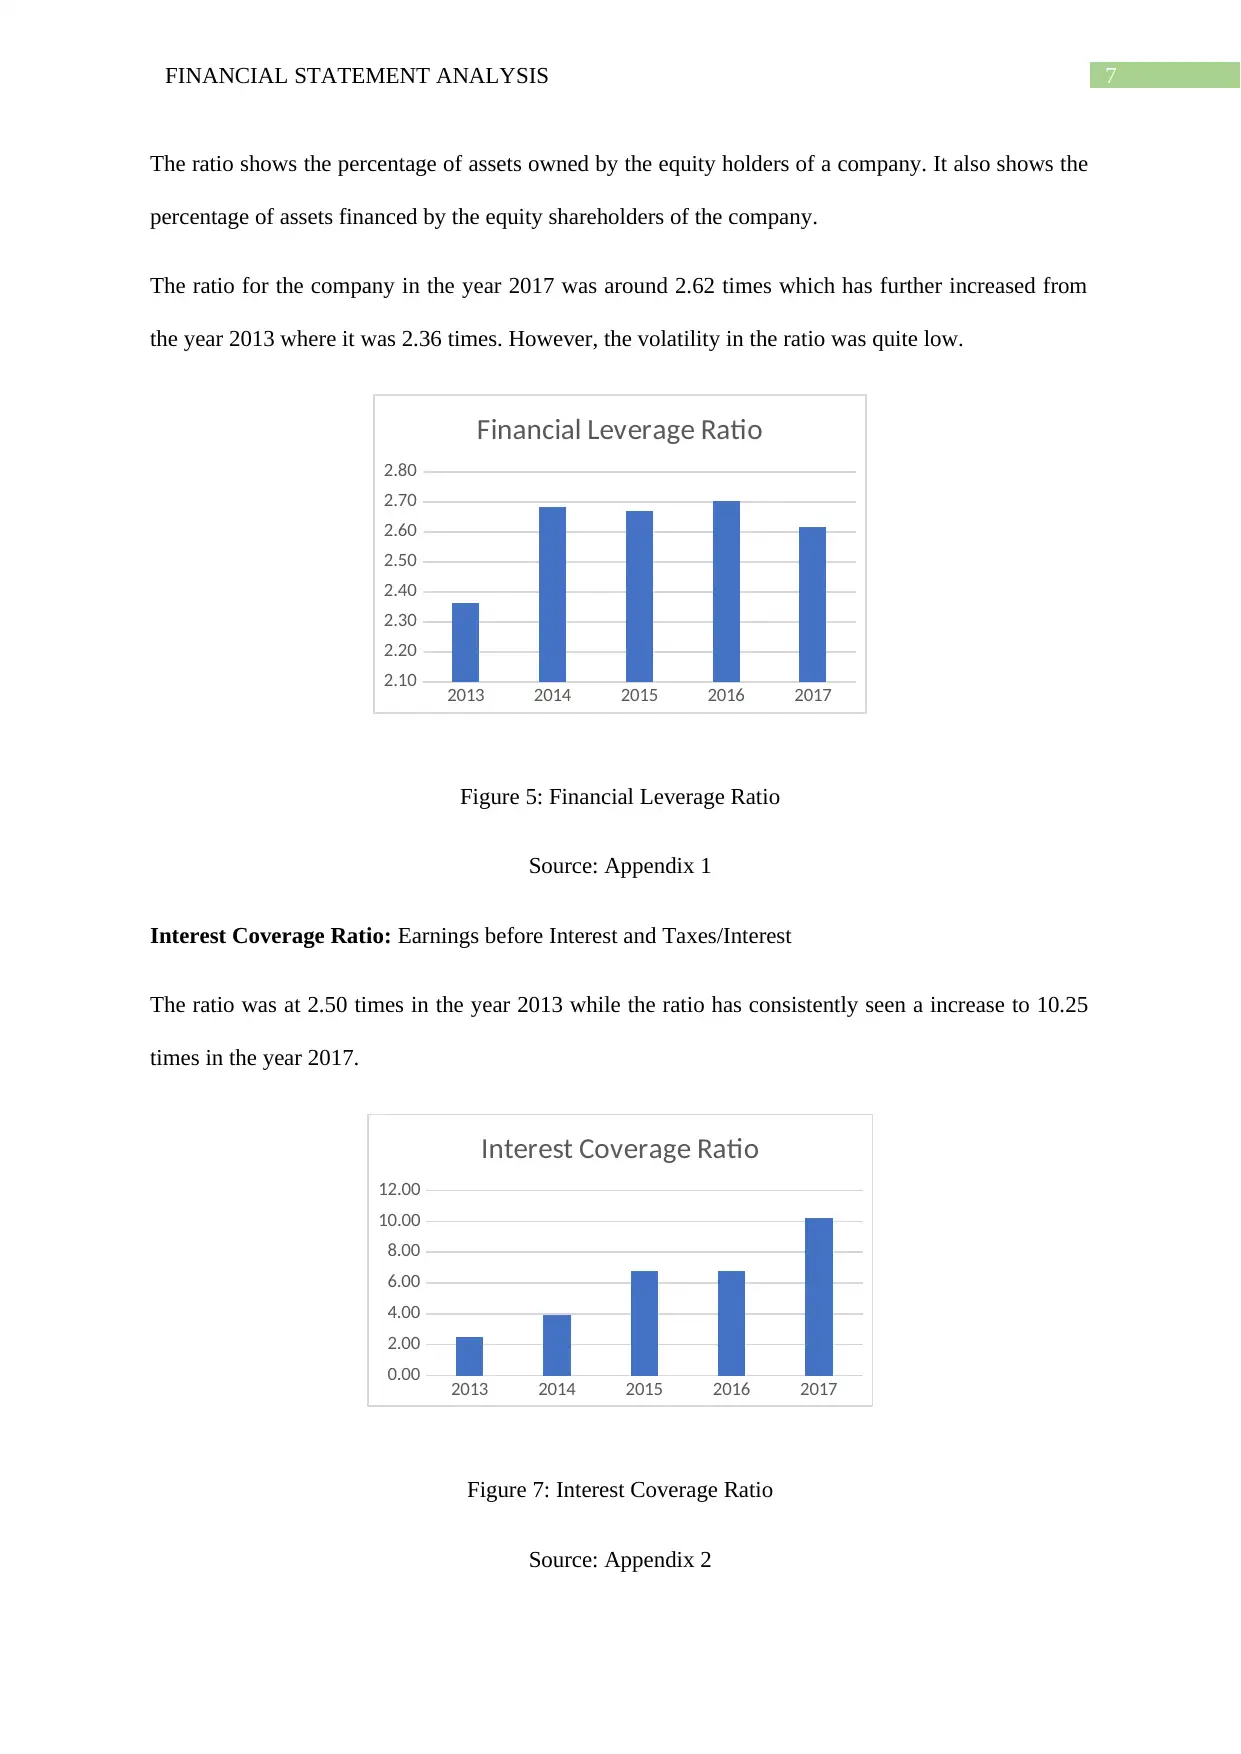
The ratio shows the percentage of assets owned by the equity holders of a company. It also shows the
percentage of assets financed by the equity shareholders of the company.
The ratio for the company in the year 2017 was around 2.62 times which has further increased from
the year 2013 where it was 2.36 times. However, the volatility in the ratio was quite low.
Figure 5: Financial Leverage Ratio
Source: Appendix 1
Interest Coverage Ratio: Earnings before Interest and Taxes/Interest
The ratio was at 2.50 times in the year 2013 while the ratio has consistently seen a increase to 10.25
times in the year 2017.
Figure 7: Interest Coverage Ratio
Source: Appendix 2
2013 2014 2015 2016 2017
2.10
2.20
2.30
2.40
2.50
2.60
2.70
2.80
Financial Leverage Ratio
2013 2014 2015 2016 2017
0.00
2.00
4.00
6.00
8.00
10.00
12.00
Interest Coverage Ratio
8FINANCIAL STATEMENT ANALYSIS
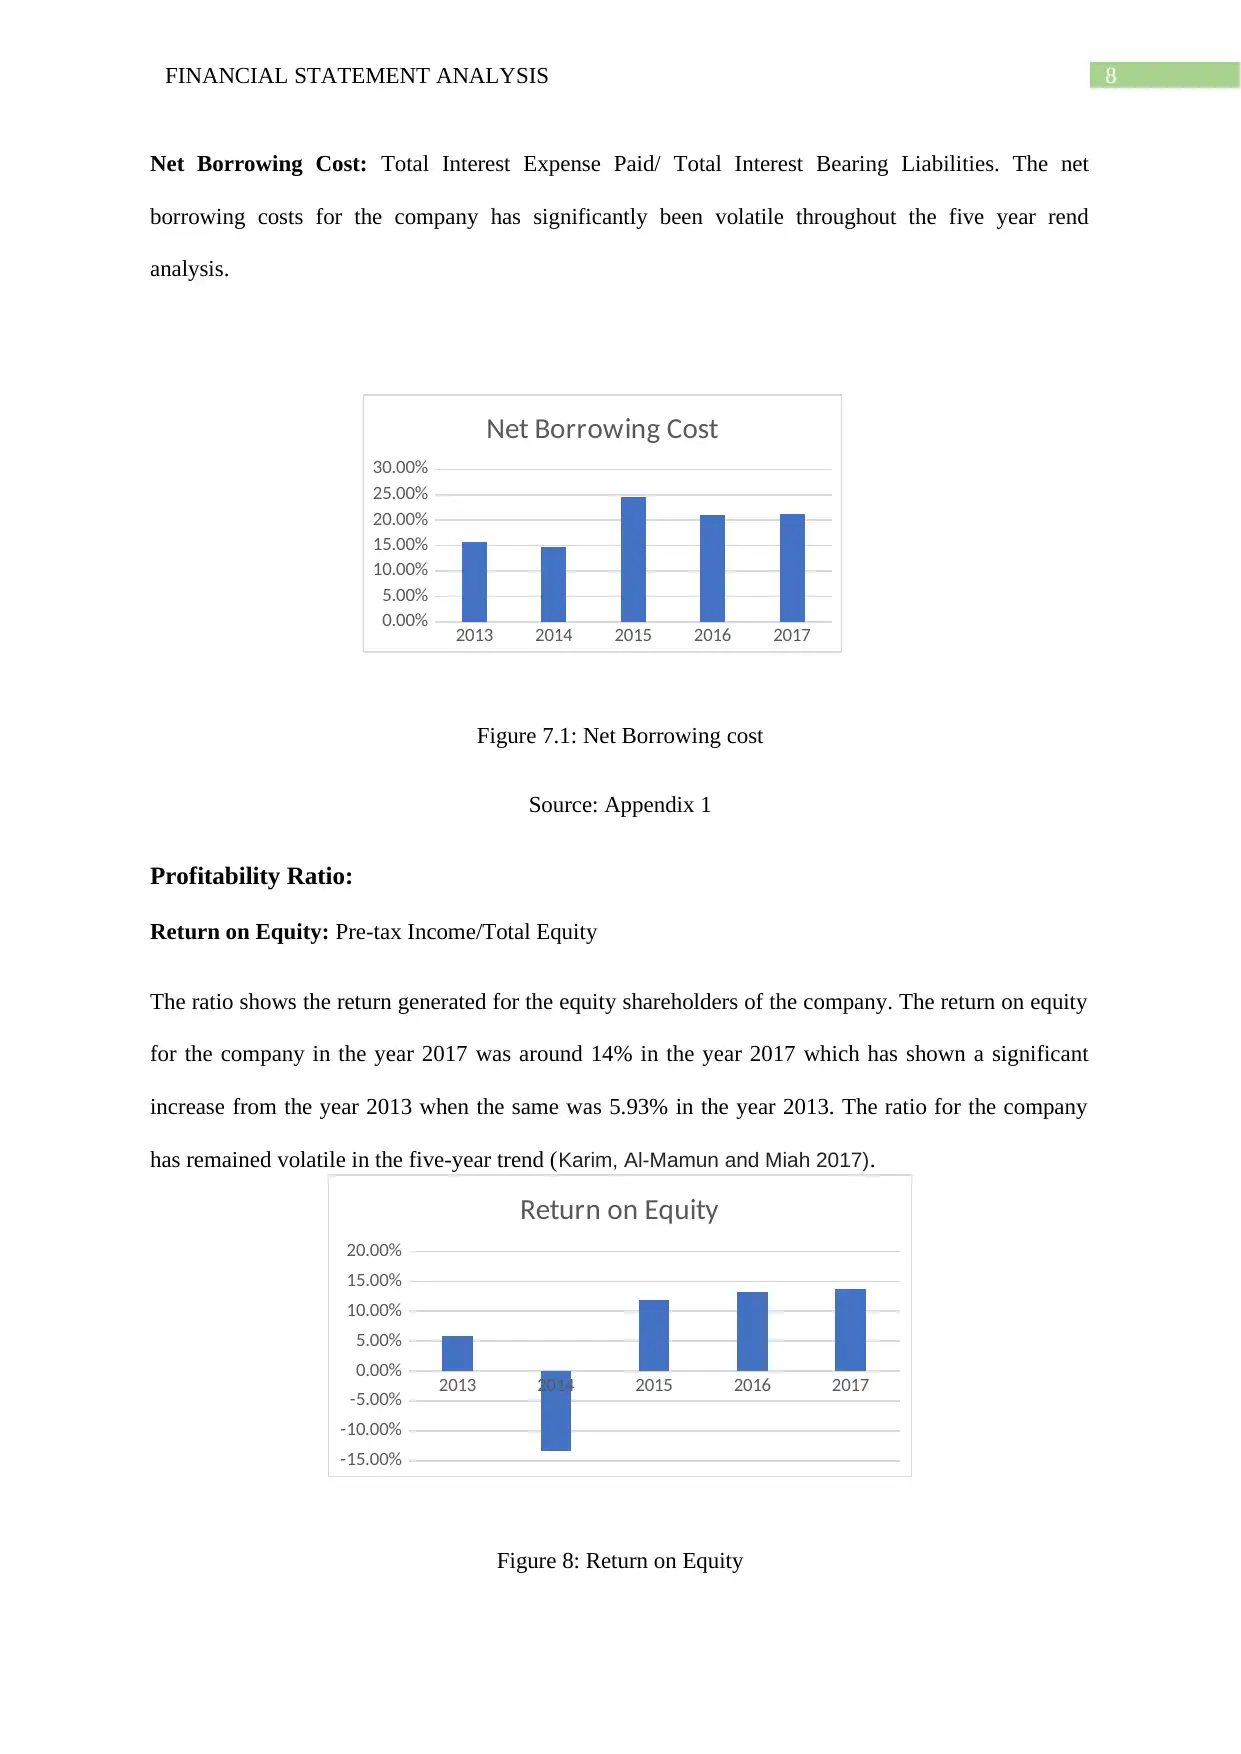
Net Borrowing Cost: Total Interest Expense Paid/ Total Interest Bearing Liabilities. The net
borrowing costs for the company has significantly been volatile throughout the five year rend
analysis.
Figure 7.1: Net Borrowing cost
Source: Appendix 1
Profitability Ratio:
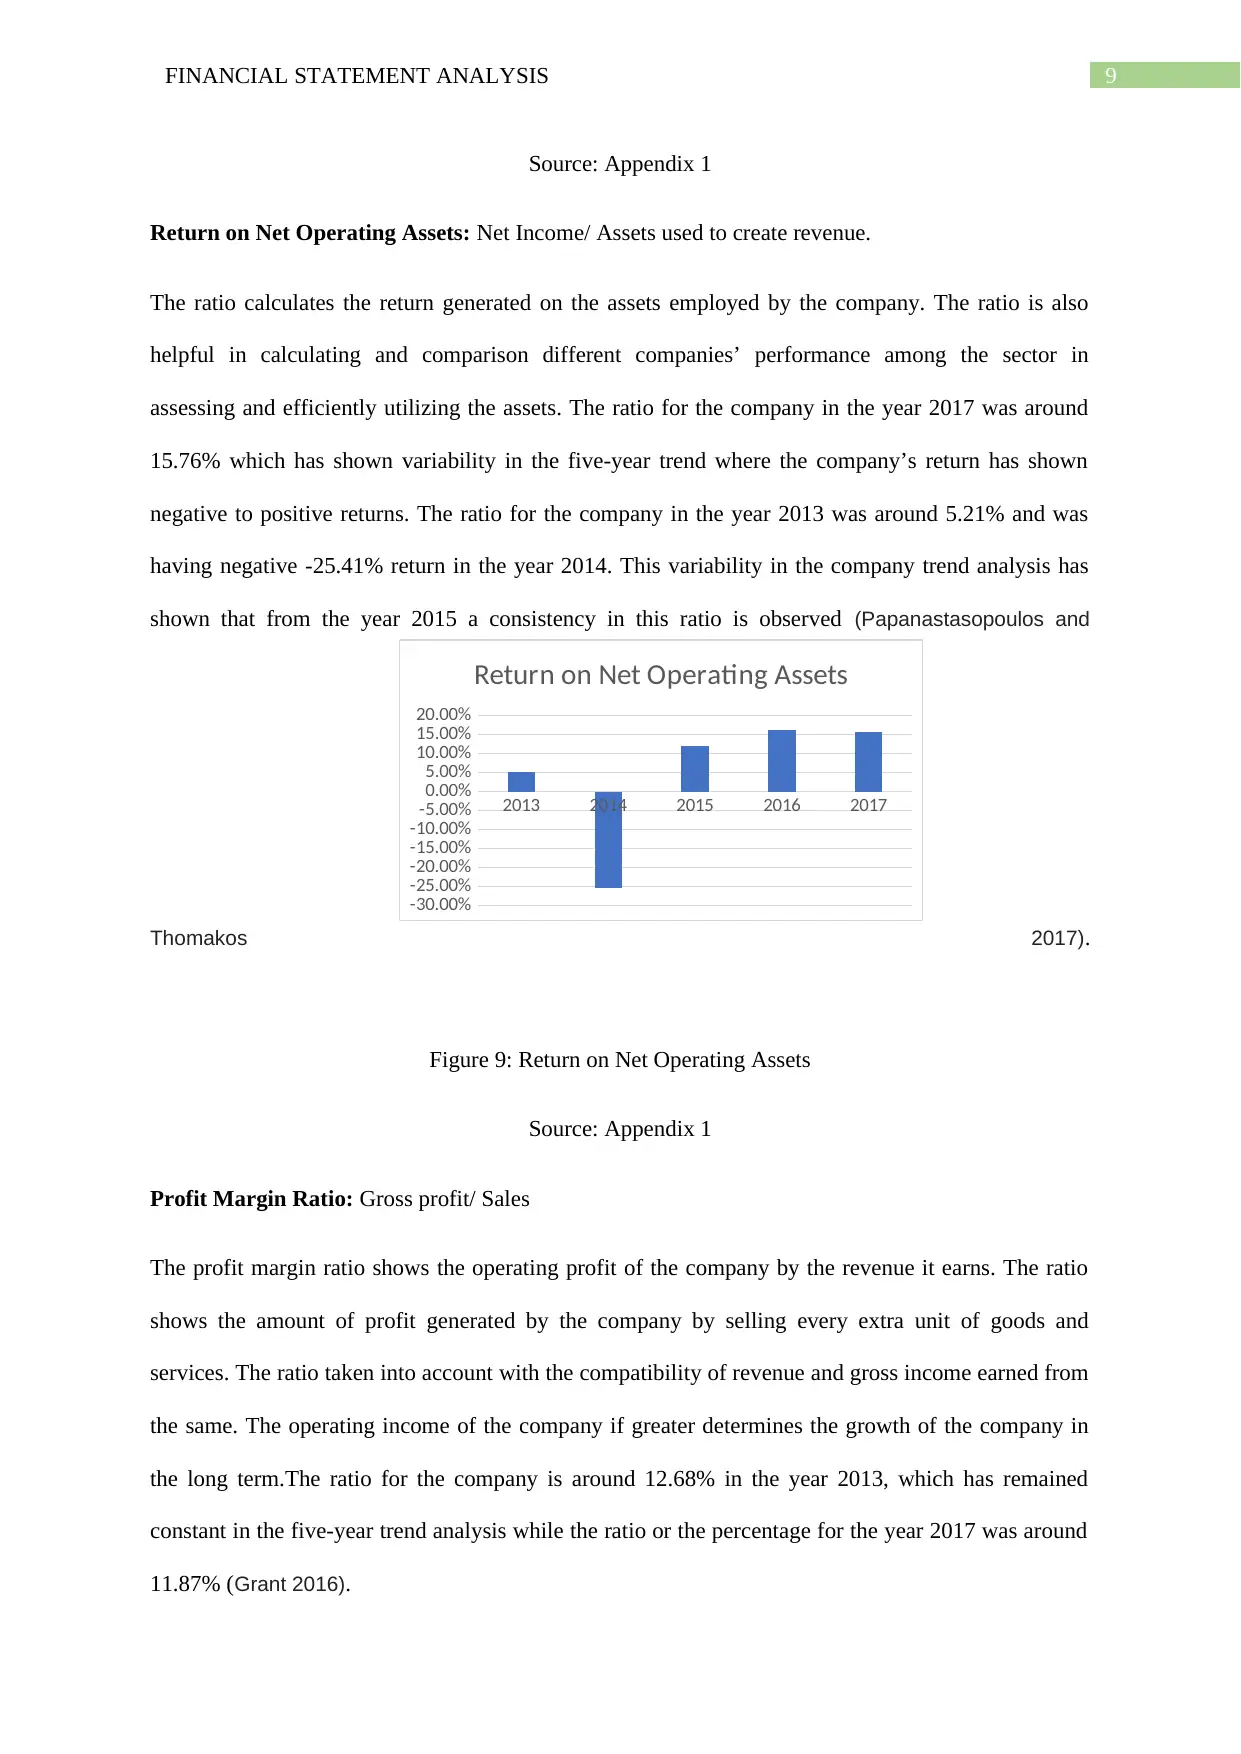
Return on Equity: Pre-tax Income/Total Equity
The ratio shows the return generated for the equity shareholders of the company. The return on equity
for the company in the year 2017 was around 14% in the year 2017 which has shown a significant
increase from the year 2013 when the same was 5.93% in the year 2013. The ratio for the company
has remained volatile in the five-year trend (Karim, Al-Mamun and Miah 2017).
Figure 8: Return on Equity
2013 2014 2015 2016 2017
-15.00%
-10.00%
-5.00%
0.00%
5.00%
10.00%
15.00%
20.00%
Return on Equity
2013 2014 2015 2016 2017
0.00%
5.00%
10.00%
15.00%
20.00%
25.00%
30.00%
Net Borrowing Cost
Net Borrowing Cost: Total Interest Expense Paid/ Total Interest Bearing Liabilities. The net
borrowing costs for the company has significantly been volatile throughout the five year rend
analysis.
Figure 7.1: Net Borrowing cost
Source: Appendix 1
Profitability Ratio:
Return on Equity: Pre-tax Income/Total Equity
The ratio shows the return generated for the equity shareholders of the company. The return on equity
for the company in the year 2017 was around 14% in the year 2017 which has shown a significant
increase from the year 2013 when the same was 5.93% in the year 2013. The ratio for the company
has remained volatile in the five-year trend (Karim, Al-Mamun and Miah 2017).
Figure 8: Return on Equity
2013 2014 2015 2016 2017
-15.00%
-10.00%
-5.00%
0.00%
5.00%
10.00%
15.00%
20.00%
Return on Equity
2013 2014 2015 2016 2017
0.00%
5.00%
10.00%
15.00%
20.00%
25.00%
30.00%
Net Borrowing Cost
⊘ This is a preview!⊘
Do you want full access?
Subscribe today to unlock all pages.
Trusted by 1+ million students worldwide
9FINANCIAL STATEMENT ANALYSIS
Source: Appendix 1
Return on Net Operating Assets: Net Income/ Assets used to create revenue.
The ratio calculates the return generated on the assets employed by the company. The ratio is also
helpful in calculating and comparison different companies’ performance among the sector in
assessing and efficiently utilizing the assets. The ratio for the company in the year 2017 was around
15.76% which has shown variability in the five-year trend where the company’s return has shown
negative to positive returns. The ratio for the company in the year 2013 was around 5.21% and was
having negative -25.41% return in the year 2014. This variability in the company trend analysis has
shown that from the year 2015 a consistency in this ratio is observed (Papanastasopoulos and
Thomakos 2017).
Figure 9: Return on Net Operating Assets
Source: Appendix 1
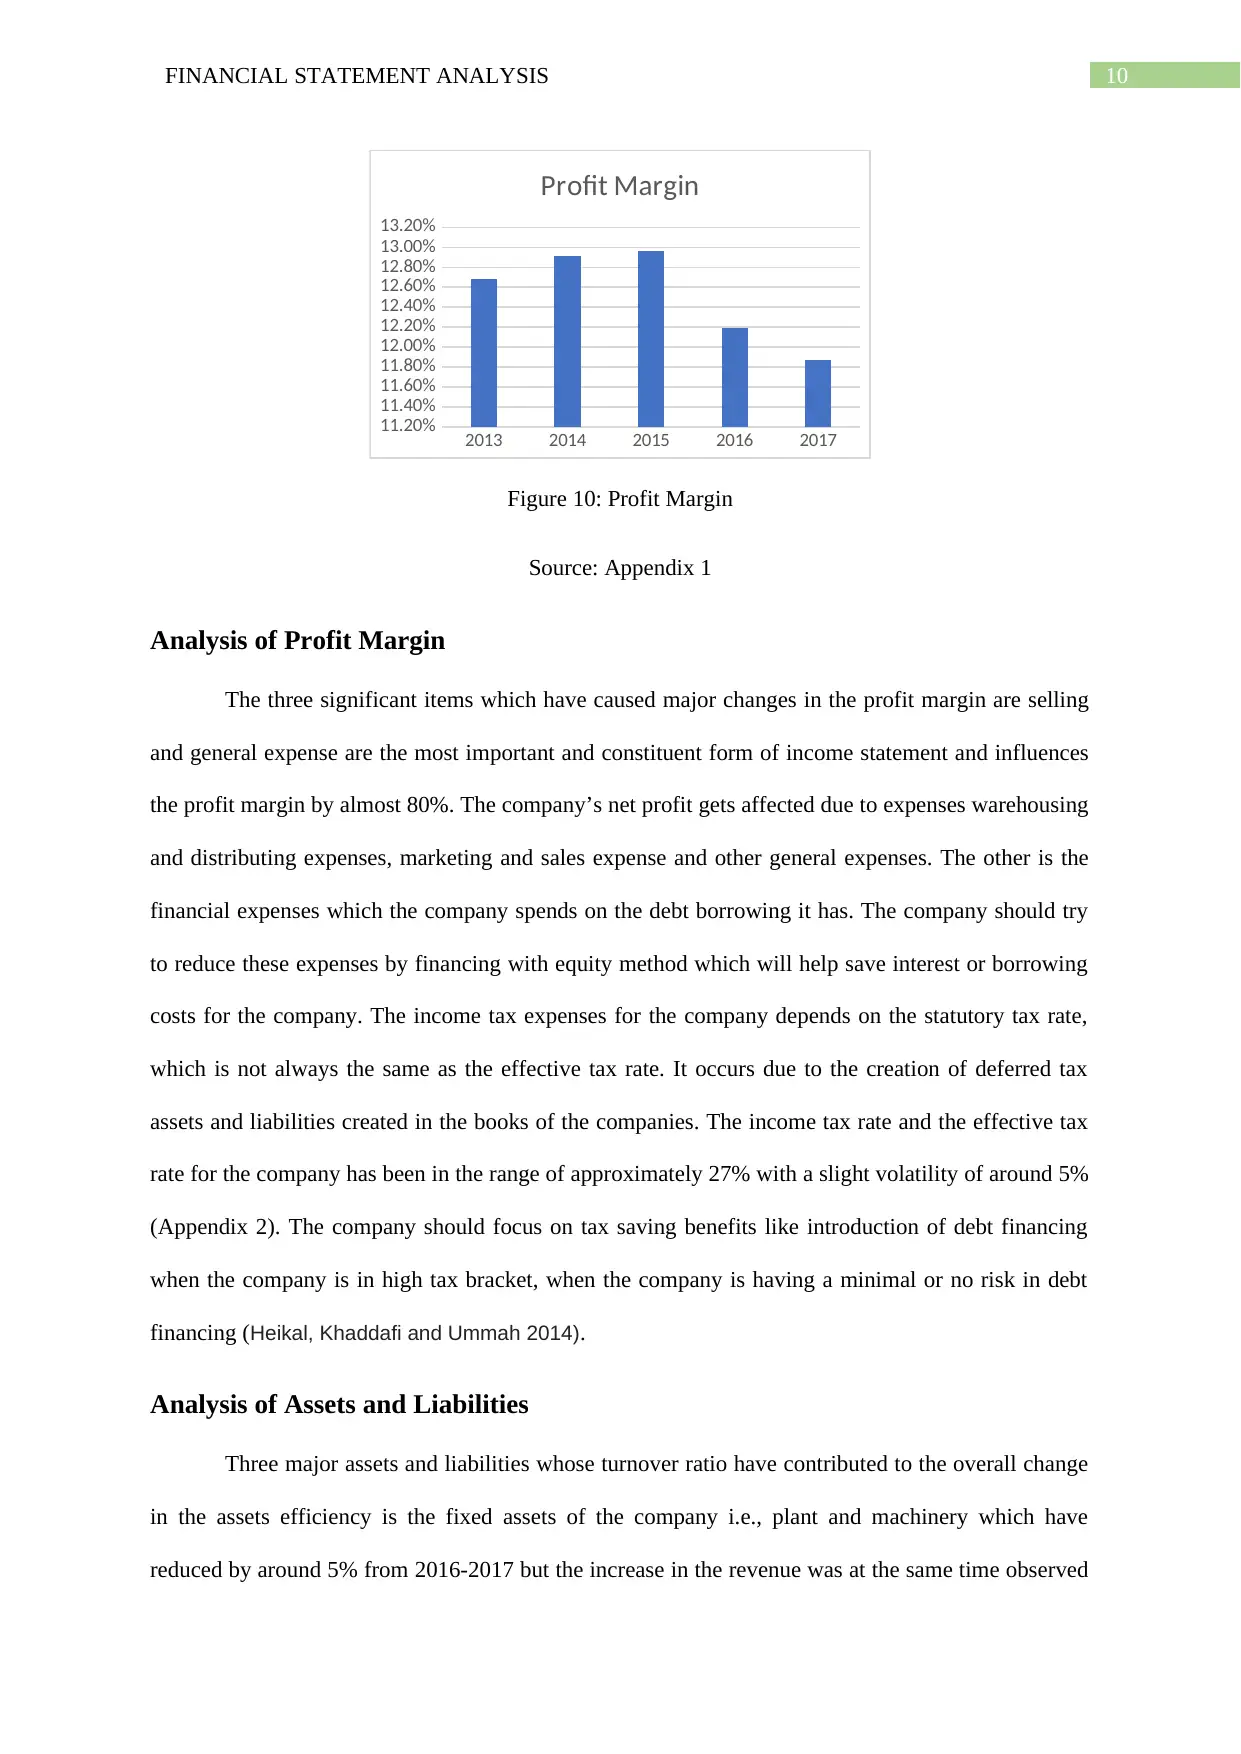
Profit Margin Ratio: Gross profit/ Sales
The profit margin ratio shows the operating profit of the company by the revenue it earns. The ratio
shows the amount of profit generated by the company by selling every extra unit of goods and
services. The ratio taken into account with the compatibility of revenue and gross income earned from
the same. The operating income of the company if greater determines the growth of the company in
the long term.The ratio for the company is around 12.68% in the year 2013, which has remained
constant in the five-year trend analysis while the ratio or the percentage for the year 2017 was around
11.87% (Grant 2016).
2013 2014 2015 2016 2017
-30.00%
-25.00%
-20.00%
-15.00%
-10.00%
-5.00%
0.00%
5.00%
10.00%
15.00%
20.00%
Return on Net Operating Assets
Source: Appendix 1
Return on Net Operating Assets: Net Income/ Assets used to create revenue.
The ratio calculates the return generated on the assets employed by the company. The ratio is also
helpful in calculating and comparison different companies’ performance among the sector in
assessing and efficiently utilizing the assets. The ratio for the company in the year 2017 was around
15.76% which has shown variability in the five-year trend where the company’s return has shown
negative to positive returns. The ratio for the company in the year 2013 was around 5.21% and was
having negative -25.41% return in the year 2014. This variability in the company trend analysis has
shown that from the year 2015 a consistency in this ratio is observed (Papanastasopoulos and
Thomakos 2017).
Figure 9: Return on Net Operating Assets
Source: Appendix 1
Profit Margin Ratio: Gross profit/ Sales
The profit margin ratio shows the operating profit of the company by the revenue it earns. The ratio
shows the amount of profit generated by the company by selling every extra unit of goods and
services. The ratio taken into account with the compatibility of revenue and gross income earned from
the same. The operating income of the company if greater determines the growth of the company in
the long term.The ratio for the company is around 12.68% in the year 2013, which has remained
constant in the five-year trend analysis while the ratio or the percentage for the year 2017 was around
11.87% (Grant 2016).
2013 2014 2015 2016 2017
-30.00%
-25.00%
-20.00%
-15.00%
-10.00%
-5.00%
0.00%
5.00%
10.00%
15.00%
20.00%
Return on Net Operating Assets
Paraphrase This Document
Need a fresh take? Get an instant paraphrase of this document with our AI Paraphraser
10FINANCIAL STATEMENT ANALYSIS
Figure 10: Profit Margin
Source: Appendix 1
Analysis of Profit Margin
The three significant items which have caused major changes in the profit margin are selling
and general expense are the most important and constituent form of income statement and influences
the profit margin by almost 80%. The company’s net profit gets affected due to expenses warehousing
and distributing expenses, marketing and sales expense and other general expenses. The other is the
financial expenses which the company spends on the debt borrowing it has. The company should try
to reduce these expenses by financing with equity method which will help save interest or borrowing
costs for the company. The income tax expenses for the company depends on the statutory tax rate,
which is not always the same as the effective tax rate. It occurs due to the creation of deferred tax
assets and liabilities created in the books of the companies. The income tax rate and the effective tax
rate for the company has been in the range of approximately 27% with a slight volatility of around 5%
(Appendix 2). The company should focus on tax saving benefits like introduction of debt financing
when the company is in high tax bracket, when the company is having a minimal or no risk in debt
financing (Heikal, Khaddafi and Ummah 2014).
Analysis of Assets and Liabilities
Three major assets and liabilities whose turnover ratio have contributed to the overall change
in the assets efficiency is the fixed assets of the company i.e., plant and machinery which have
reduced by around 5% from 2016-2017 but the increase in the revenue was at the same time observed
2013 2014 2015 2016 2017
11.20%
11.40%
11.60%
11.80%
12.00%
12.20%
12.40%
12.60%
12.80%
13.00%
13.20%
Profit Margin
11FINANCIAL STATEMENT ANALYSIS
to be around 5.26%. This shows that the company has shown efficiency in production and revenue
generation (Appendix 3). The trade and other receivable which has reduced by 1.12% from the year
shows the management has started focusing on the efficiency of this particular asset. While if we see
at the liability side from the year 2013-2017 the company has reduced the loans and borrowing and
long term debt of the company significantly which has let the company reduce financial risks and
reduce interest expense a significant component of income statement (Panigrahi and Sharma 2016).
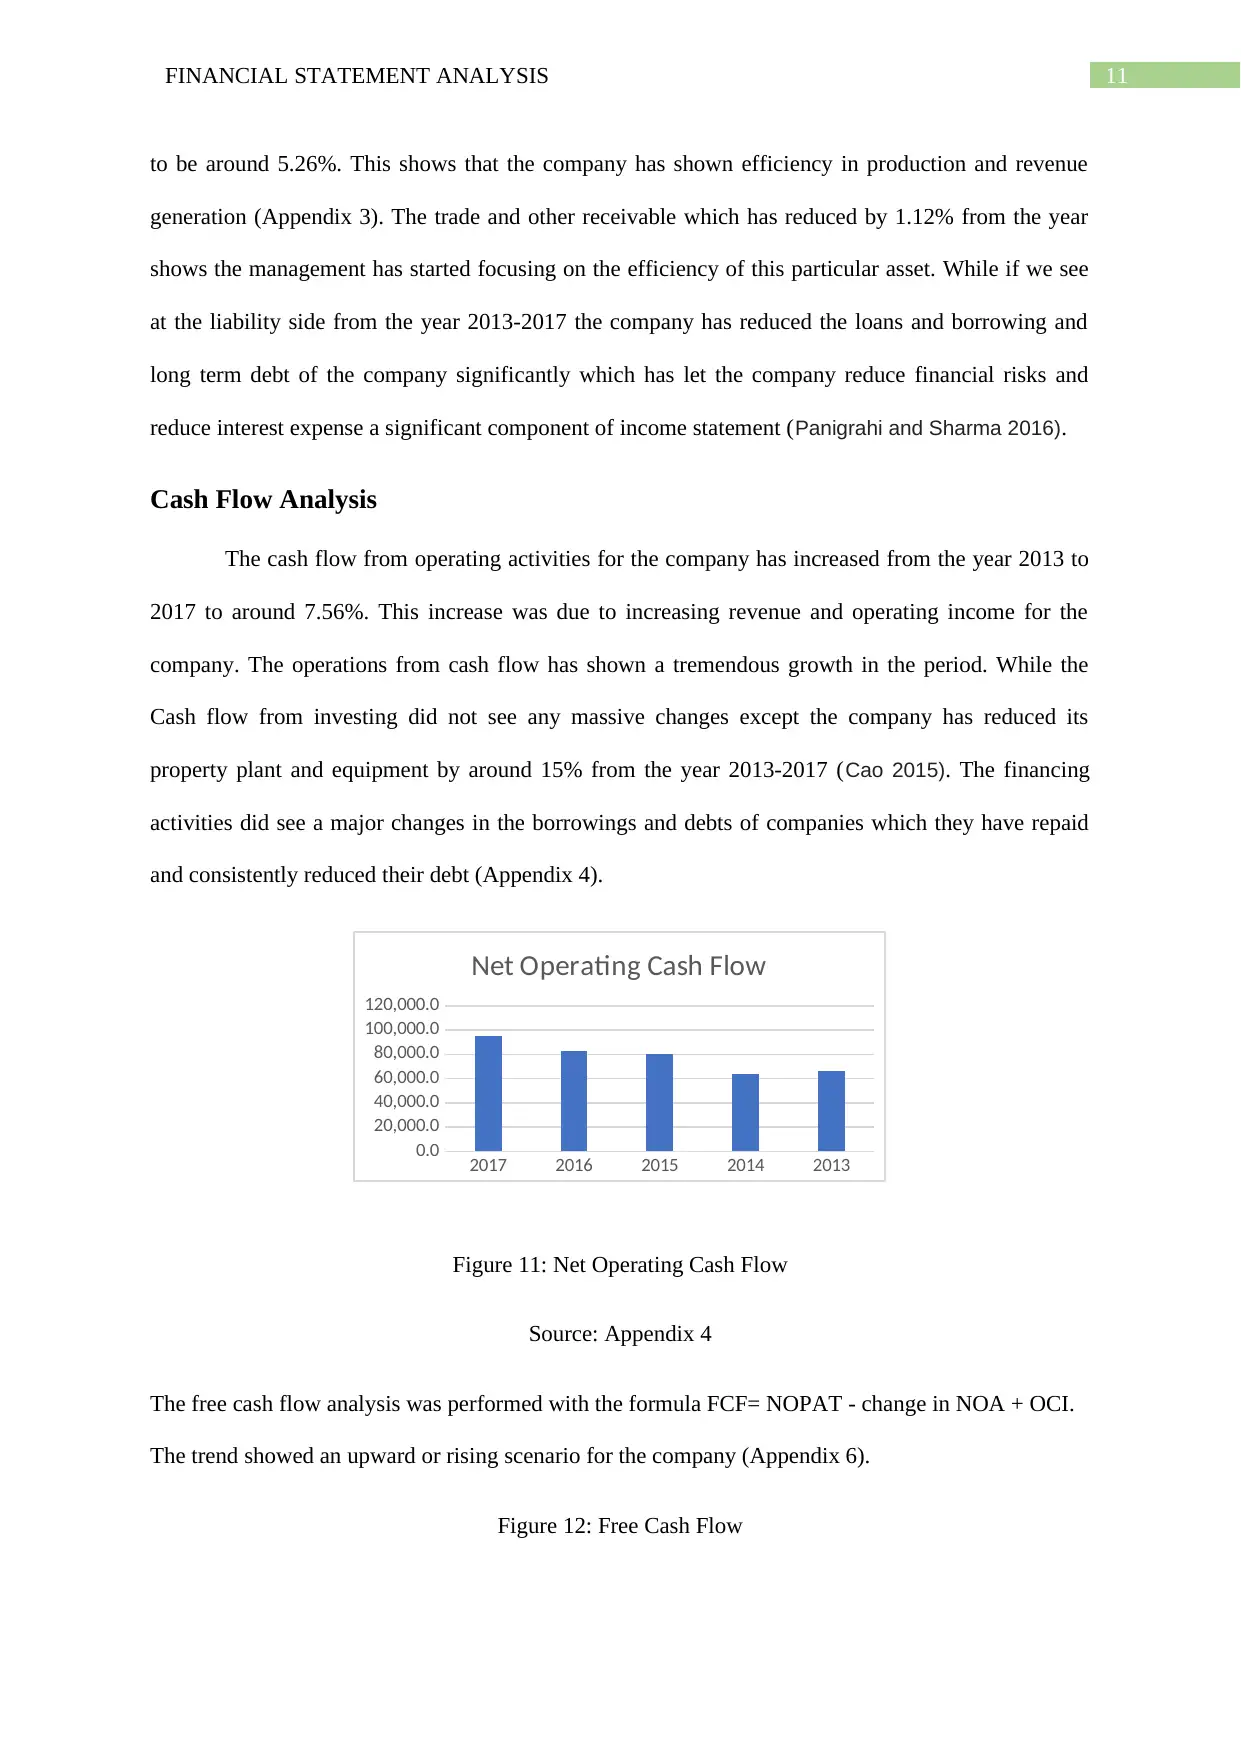
Cash Flow Analysis
The cash flow from operating activities for the company has increased from the year 2013 to
2017 to around 7.56%. This increase was due to increasing revenue and operating income for the
company. The operations from cash flow has shown a tremendous growth in the period. While the
Cash flow from investing did not see any massive changes except the company has reduced its
property plant and equipment by around 15% from the year 2013-2017 (Cao 2015). The financing
activities did see a major changes in the borrowings and debts of companies which they have repaid
and consistently reduced their debt (Appendix 4).
Figure 11: Net Operating Cash Flow
Source: Appendix 4
The free cash flow analysis was performed with the formula FCF= NOPAT - change in NOA + OCI.
The trend showed an upward or rising scenario for the company (Appendix 6).
Figure 12: Free Cash Flow
2017 2016 2015 2014 2013
0.0
20,000.0
40,000.0
60,000.0
80,000.0
100,000.0
120,000.0
Net Operating Cash Flow
to be around 5.26%. This shows that the company has shown efficiency in production and revenue
generation (Appendix 3). The trade and other receivable which has reduced by 1.12% from the year
shows the management has started focusing on the efficiency of this particular asset. While if we see
at the liability side from the year 2013-2017 the company has reduced the loans and borrowing and
long term debt of the company significantly which has let the company reduce financial risks and
reduce interest expense a significant component of income statement (Panigrahi and Sharma 2016).
Cash Flow Analysis
The cash flow from operating activities for the company has increased from the year 2013 to
2017 to around 7.56%. This increase was due to increasing revenue and operating income for the
company. The operations from cash flow has shown a tremendous growth in the period. While the
Cash flow from investing did not see any massive changes except the company has reduced its
property plant and equipment by around 15% from the year 2013-2017 (Cao 2015). The financing
activities did see a major changes in the borrowings and debts of companies which they have repaid
and consistently reduced their debt (Appendix 4).
Figure 11: Net Operating Cash Flow
Source: Appendix 4
The free cash flow analysis was performed with the formula FCF= NOPAT - change in NOA + OCI.
The trend showed an upward or rising scenario for the company (Appendix 6).
Figure 12: Free Cash Flow
2017 2016 2015 2014 2013
0.0
20,000.0
40,000.0
60,000.0
80,000.0
100,000.0
120,000.0
Net Operating Cash Flow
⊘ This is a preview!⊘
Do you want full access?
Subscribe today to unlock all pages.
Trusted by 1+ million students worldwide
1 out of 21
Related Documents


Your All-in-One AI-Powered Toolkit for Academic Success.
+13062052269
info@desklib.com
Available 24*7 on WhatsApp / Email
![[object Object]](/_next/static/media/star-bottom.7253800d.svg)
Unlock your academic potential
Copyright © 2020–2026 A2Z Services. All Rights Reserved. Developed and managed by ZUCOL.