Finance Report: Australian Agricultural Projects Ltd - Masters
VerifiedAdded on 2020/05/16
|13
|2855
|25
Report
AI Summary
This report offers a detailed financial analysis of Australian Agricultural Projects Ltd, a Victorian-based olive oil producer. It examines the company's ownership and governance structure, including its executive and non-executive directors. The report computes key performance ratios like return on assets and equity, providing insights into the company's resource utilization and profitability trends. It also analyzes stock price movements, identifying noteworthy factors influencing share prices, such as investor support and export demand. The report includes calculations for Beta and the required rate of return, alongside the weighted average cost of capital and debt ratios over the past two years. Furthermore, it discusses the company's dividend policy and concludes with a letter of recommendation, assessing the company's future prospects and providing investment advice. The analysis utilizes financial data to evaluate the company's performance, market position, and financial strategies.
Running head: FINANCE FOR BUSINESS - MASTERS
Finance for business - Masters
Name of the university
Name of the student
Authors note
Finance for business - Masters
Name of the university
Name of the student
Authors note
Paraphrase This Document
Need a fresh take? Get an instant paraphrase of this document with our AI Paraphraser
1
FINANCE FOR BUSINESS - MASTERS
Table of Contents
Overview of company:....................................................................................................................2
Ownership and governance structure of company:.........................................................................2
Computation of performance ratios:................................................................................................3
Two graphs with the description of results:.....................................................................................4
Noteworthy factors influencing the prices of shares for Australian Agricultural Projects Ltd:......4
Computation of Beta and required rate of returns:..........................................................................5
Weighted average cost of capital:....................................................................................................6
Debt ratios for the past two years:...................................................................................................6
Dividend policy:..............................................................................................................................7
Reference List:.................................................................................................................................9
Appendix:......................................................................................................................................11
2
FINANCE FOR BUSINESS - MASTERS
Overview of company:
Australian agriculture project limited is regarded as the Victorian based business that
administers the large state of the art operations of growing oil in the regions of Boort. The
Australian agriculture project limited was established during the year 2004 with the
establishment of the numerous brands of olive oil and then with the acquisition of the Victorian
olive oil project limited in the year 2007 (Voopl.com.au 2018). The company has developed into
the low cost producer of the higher quality of virgin olive oil.
The business of orchid was founded by Australian agriculture project limited with the
objective of developing and managing the higher quality olive projects at the time when there as
the significant amount of expansion in the plantation olive in Australia. The Australian
agriculture project limited has created several brands with the help of marketing of its numerous
brands including the wide range of distribution of the olive oil supply (Voopl.com.au 2018). The
Australian agriculture project limited is listed on the Australian stock exchange to offer the
financial capital with the objective of acting on the openings that is presented to the company in
the environment of the rising industry of olive oil. The organization has the leading teams in
terms of technical support and has created the capacity of establishing the new olive grove
projects in order to manage other groves and expanding their markets for olive products.
Ownership and governance structure of company:
Taking into the consideration the ownership structure of the Australian agriculture project
limited it can be stated that the company has the best corporate governance policies with the
structure of the non-executive directors and executive directors (Voopl.com.au 2018). The
operation structure of the company comprises of the managing director and two non-executive
directors that are assigned with the responsibilities. The company secretary is responsible for the
predominantly administering the documentations and capital raising of the company
(Voopl.com.au 2018). The ownership structure of the organization comprises of the relevant
interest for each of the director.
⊘ This is a preview!⊘
Do you want full access?
Subscribe today to unlock all pages.
Trusted by 1+ million students worldwide
3
FINANCE FOR BUSINESS - MASTERS
Computation of performance ratios:
Particulars` 2014 2015 2016 2017 2014 2015 2016 2017
Net Profit/(Loss) after Tax (NPAT) A -459963 568280 380957 442641 -100.0% 123.5% 82.8% 96.2%
Total Assets (TA) B 13133076 13616160 13338307 13205015 100.0% 103.7% 101.6% 100.5%
Ordinary Equity (OE) C 4491418 5059698 5440655 5883296 100.0% 112.7% 121.1% 131.0%
Total Liabilities D 8641658 8556462 7897652 7321719 0.0% 100.0% 92.3% 85.6%
Return on Assets (ROA) E= A/B -3.50% 4.17% 2.86% 3.35% -100.0% 119.17% 81.55% 95.71%
Return on Equity (ROE) F=A/C -10.24% 11.23% 7.00% 7.52% -100.0% 109.67% 68.37% 73.47%
Debt Ratio G=D/B 0.658 0.628 0.592 0.554 100.0% 95.50% 89.98% 84.26%
Trend
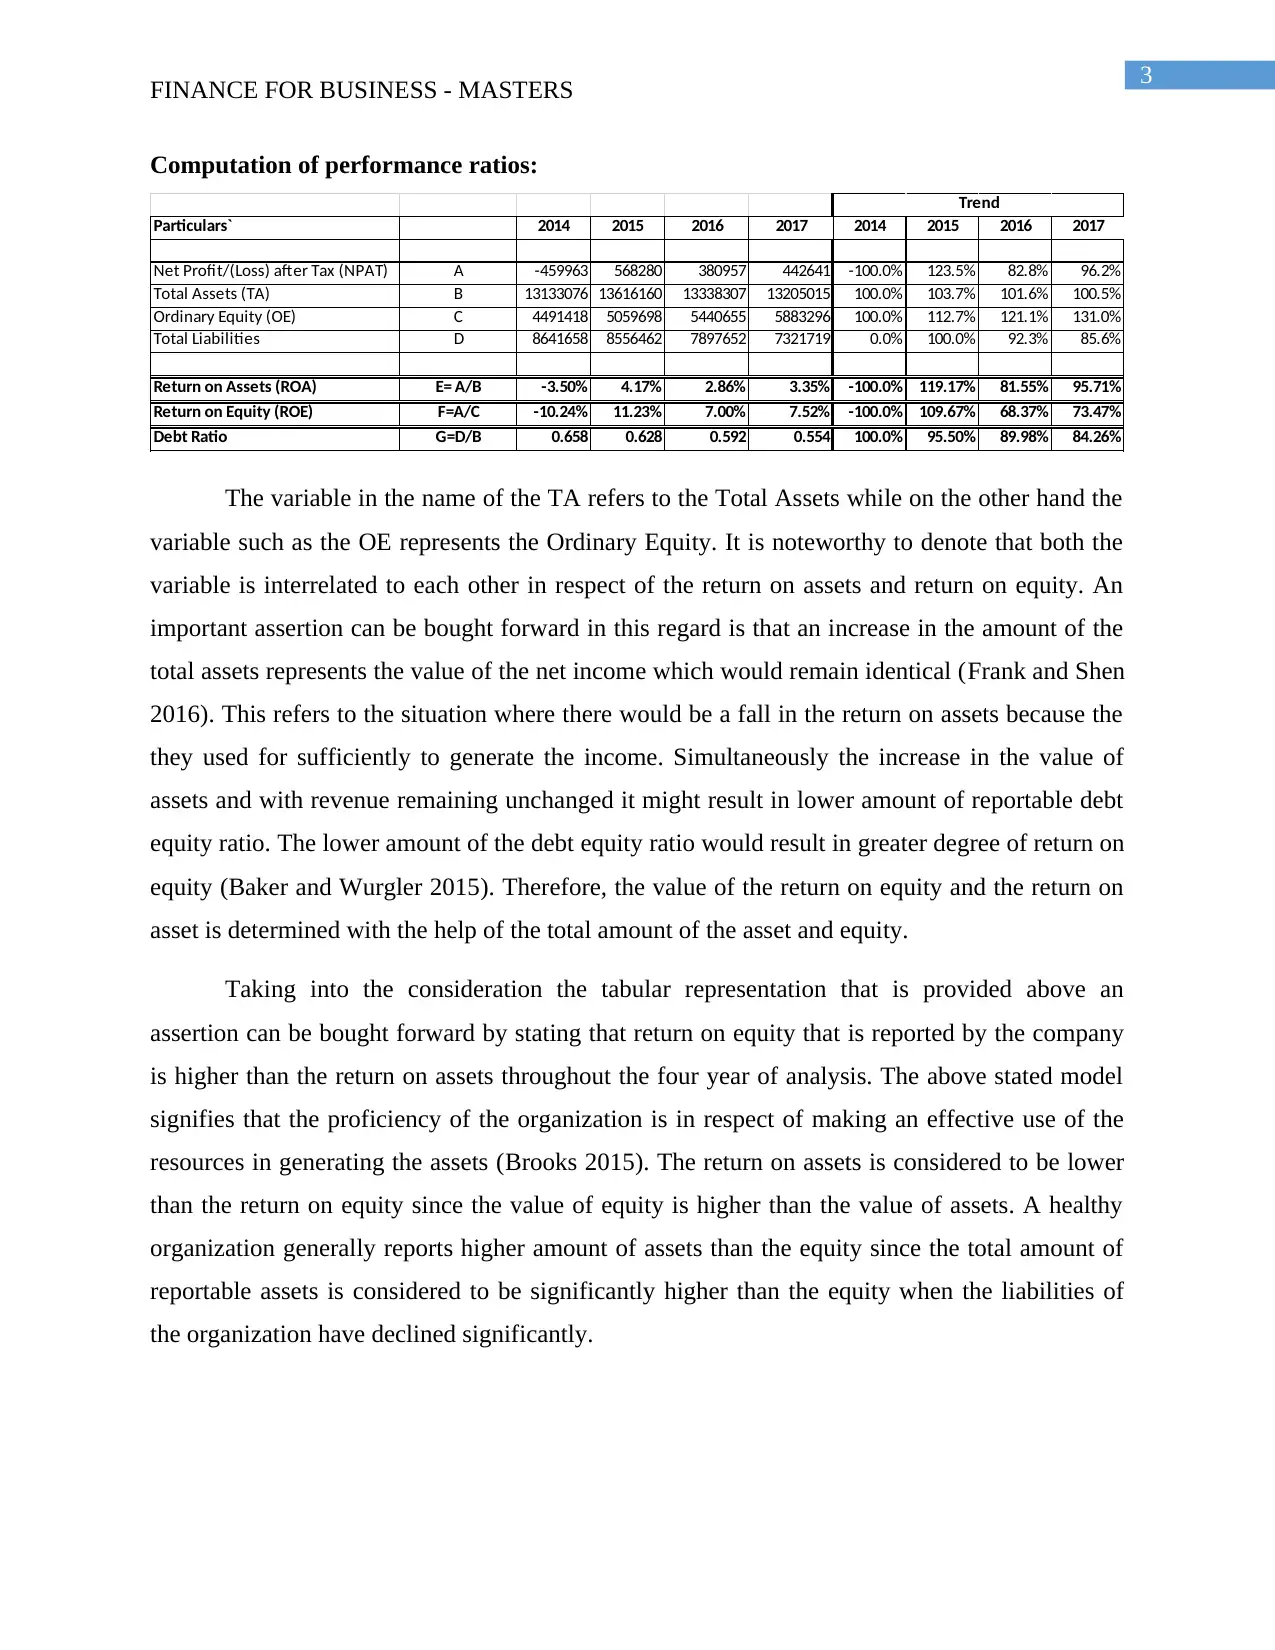
The variable in the name of the TA refers to the Total Assets while on the other hand the
variable such as the OE represents the Ordinary Equity. It is noteworthy to denote that both the
variable is interrelated to each other in respect of the return on assets and return on equity. An
important assertion can be bought forward in this regard is that an increase in the amount of the
total assets represents the value of the net income which would remain identical (Frank and Shen
2016). This refers to the situation where there would be a fall in the return on assets because the
they used for sufficiently to generate the income. Simultaneously the increase in the value of
assets and with revenue remaining unchanged it might result in lower amount of reportable debt
equity ratio. The lower amount of the debt equity ratio would result in greater degree of return on
equity (Baker and Wurgler 2015). Therefore, the value of the return on equity and the return on
asset is determined with the help of the total amount of the asset and equity.
Taking into the consideration the tabular representation that is provided above an
assertion can be bought forward by stating that return on equity that is reported by the company
is higher than the return on assets throughout the four year of analysis. The above stated model
signifies that the proficiency of the organization is in respect of making an effective use of the
resources in generating the assets (Brooks 2015). The return on assets is considered to be lower
than the return on equity since the value of equity is higher than the value of assets. A healthy
organization generally reports higher amount of assets than the equity since the total amount of
reportable assets is considered to be significantly higher than the equity when the liabilities of
the organization have declined significantly.
FINANCE FOR BUSINESS - MASTERS
Computation of performance ratios:
Particulars` 2014 2015 2016 2017 2014 2015 2016 2017
Net Profit/(Loss) after Tax (NPAT) A -459963 568280 380957 442641 -100.0% 123.5% 82.8% 96.2%
Total Assets (TA) B 13133076 13616160 13338307 13205015 100.0% 103.7% 101.6% 100.5%
Ordinary Equity (OE) C 4491418 5059698 5440655 5883296 100.0% 112.7% 121.1% 131.0%
Total Liabilities D 8641658 8556462 7897652 7321719 0.0% 100.0% 92.3% 85.6%
Return on Assets (ROA) E= A/B -3.50% 4.17% 2.86% 3.35% -100.0% 119.17% 81.55% 95.71%
Return on Equity (ROE) F=A/C -10.24% 11.23% 7.00% 7.52% -100.0% 109.67% 68.37% 73.47%
Debt Ratio G=D/B 0.658 0.628 0.592 0.554 100.0% 95.50% 89.98% 84.26%
Trend
The variable in the name of the TA refers to the Total Assets while on the other hand the
variable such as the OE represents the Ordinary Equity. It is noteworthy to denote that both the
variable is interrelated to each other in respect of the return on assets and return on equity. An
important assertion can be bought forward in this regard is that an increase in the amount of the
total assets represents the value of the net income which would remain identical (Frank and Shen
2016). This refers to the situation where there would be a fall in the return on assets because the
they used for sufficiently to generate the income. Simultaneously the increase in the value of
assets and with revenue remaining unchanged it might result in lower amount of reportable debt
equity ratio. The lower amount of the debt equity ratio would result in greater degree of return on
equity (Baker and Wurgler 2015). Therefore, the value of the return on equity and the return on
asset is determined with the help of the total amount of the asset and equity.
Taking into the consideration the tabular representation that is provided above an
assertion can be bought forward by stating that return on equity that is reported by the company
is higher than the return on assets throughout the four year of analysis. The above stated model
signifies that the proficiency of the organization is in respect of making an effective use of the
resources in generating the assets (Brooks 2015). The return on assets is considered to be lower
than the return on equity since the value of equity is higher than the value of assets. A healthy
organization generally reports higher amount of assets than the equity since the total amount of
reportable assets is considered to be significantly higher than the equity when the liabilities of
the organization have declined significantly.
Paraphrase This Document
Need a fresh take? Get an instant paraphrase of this document with our AI Paraphraser
4
FINANCE FOR BUSINESS - MASTERS
Two graphs with the description of results:
12/1/2015
1/1/2016
2/1/2016
3/1/2016
4/1/2016
5/1/2016
6/1/2016
7/1/2016
8/1/2016
9/1/2016
10/1/2016
11/1/2016
12/1/2016
1/1/2017
2/1/2017
3/1/2017
4/1/2017
5/1/2017
6/1/2017
7/1/2017
8/1/2017
9/1/2017
10/1/2017
11/1/2017
12/1/2017
-20.00%
-15.00%
-10.00%
-5.00%
0.00%
5.00%
10.00%
15.00%
20.00%
25.00%
Stock Price Movement
Australian Agricultural All Ord Index
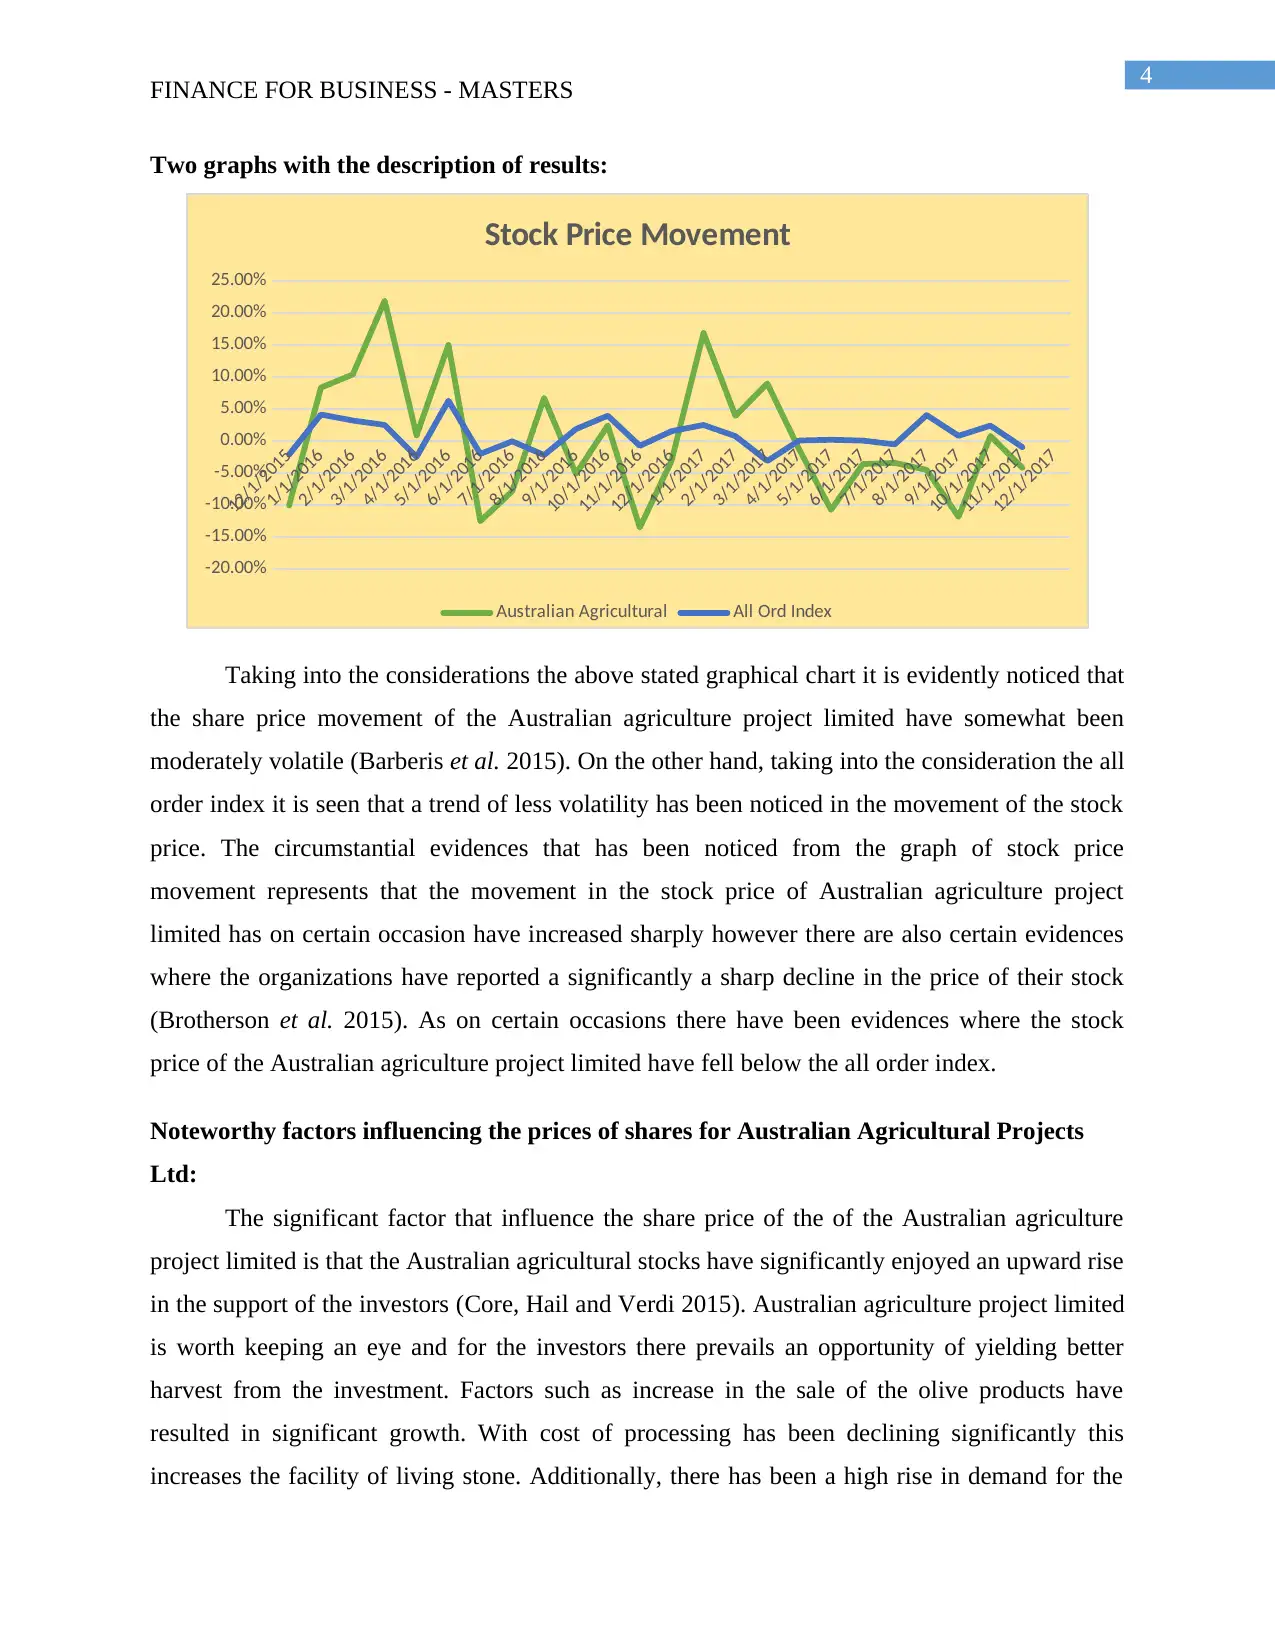
Taking into the considerations the above stated graphical chart it is evidently noticed that
the share price movement of the Australian agriculture project limited have somewhat been
moderately volatile (Barberis et al. 2015). On the other hand, taking into the consideration the all
order index it is seen that a trend of less volatility has been noticed in the movement of the stock
price. The circumstantial evidences that has been noticed from the graph of stock price
movement represents that the movement in the stock price of Australian agriculture project
limited has on certain occasion have increased sharply however there are also certain evidences
where the organizations have reported a significantly a sharp decline in the price of their stock
(Brotherson et al. 2015). As on certain occasions there have been evidences where the stock
price of the Australian agriculture project limited have fell below the all order index.
Noteworthy factors influencing the prices of shares for Australian Agricultural Projects
Ltd:
The significant factor that influence the share price of the of the Australian agriculture
project limited is that the Australian agricultural stocks have significantly enjoyed an upward rise
in the support of the investors (Core, Hail and Verdi 2015). Australian agriculture project limited
is worth keeping an eye and for the investors there prevails an opportunity of yielding better
harvest from the investment. Factors such as increase in the sale of the olive products have
resulted in significant growth. With cost of processing has been declining significantly this
increases the facility of living stone. Additionally, there has been a high rise in demand for the
FINANCE FOR BUSINESS - MASTERS
Two graphs with the description of results:
12/1/2015
1/1/2016
2/1/2016
3/1/2016
4/1/2016
5/1/2016
6/1/2016
7/1/2016
8/1/2016
9/1/2016
10/1/2016
11/1/2016
12/1/2016
1/1/2017
2/1/2017
3/1/2017
4/1/2017
5/1/2017
6/1/2017
7/1/2017
8/1/2017
9/1/2017
10/1/2017
11/1/2017
12/1/2017
-20.00%
-15.00%
-10.00%
-5.00%
0.00%
5.00%
10.00%
15.00%
20.00%
25.00%
Stock Price Movement
Australian Agricultural All Ord Index
Taking into the considerations the above stated graphical chart it is evidently noticed that
the share price movement of the Australian agriculture project limited have somewhat been
moderately volatile (Barberis et al. 2015). On the other hand, taking into the consideration the all
order index it is seen that a trend of less volatility has been noticed in the movement of the stock
price. The circumstantial evidences that has been noticed from the graph of stock price
movement represents that the movement in the stock price of Australian agriculture project
limited has on certain occasion have increased sharply however there are also certain evidences
where the organizations have reported a significantly a sharp decline in the price of their stock
(Brotherson et al. 2015). As on certain occasions there have been evidences where the stock
price of the Australian agriculture project limited have fell below the all order index.
Noteworthy factors influencing the prices of shares for Australian Agricultural Projects
Ltd:
The significant factor that influence the share price of the of the Australian agriculture
project limited is that the Australian agricultural stocks have significantly enjoyed an upward rise
in the support of the investors (Core, Hail and Verdi 2015). Australian agriculture project limited
is worth keeping an eye and for the investors there prevails an opportunity of yielding better
harvest from the investment. Factors such as increase in the sale of the olive products have
resulted in significant growth. With cost of processing has been declining significantly this
increases the facility of living stone. Additionally, there has been a high rise in demand for the
5
FINANCE FOR BUSINESS - MASTERS
export trade from the Asian countries and as result of this the Australian agricultural projects ltd
stocks have witnessed a sharp rise in their share prices (Johnstone 2016).
Computation of Beta and required rate of returns:
Particulars Amount
Beta of the company A 0.89
Risk Free Rate B 4%
Market Risk Premium C 6%
Required Rate of Return D=B+[AxC] 9.34%
Particulars` 2014 2015 2016 2017 2014 2015 2016 2017
EBIT A 224747 954781 733641 755691 -100.00% -424.82% -326.43% -336.24%
Total Assets B 13133076 13616160 13338307 13205015 100.00% 103.68% 101.56% 100.55%
Net Profit/(Loss) after Tax (NPAT) C -459963 568280 380957 442641 -100.00% 123.55% 82.82% 96.23%
Owner's Equity D 4491418 5059698 5440655 5883296 100.00% 112.65% 121.13% 130.99%
Return on Equity
E=(A/B)x(C/A)x
(B/D) -10.24% 11.23% 7.00% 7.52% -100.00% 109.67% 68.37% 73.47%
Trend
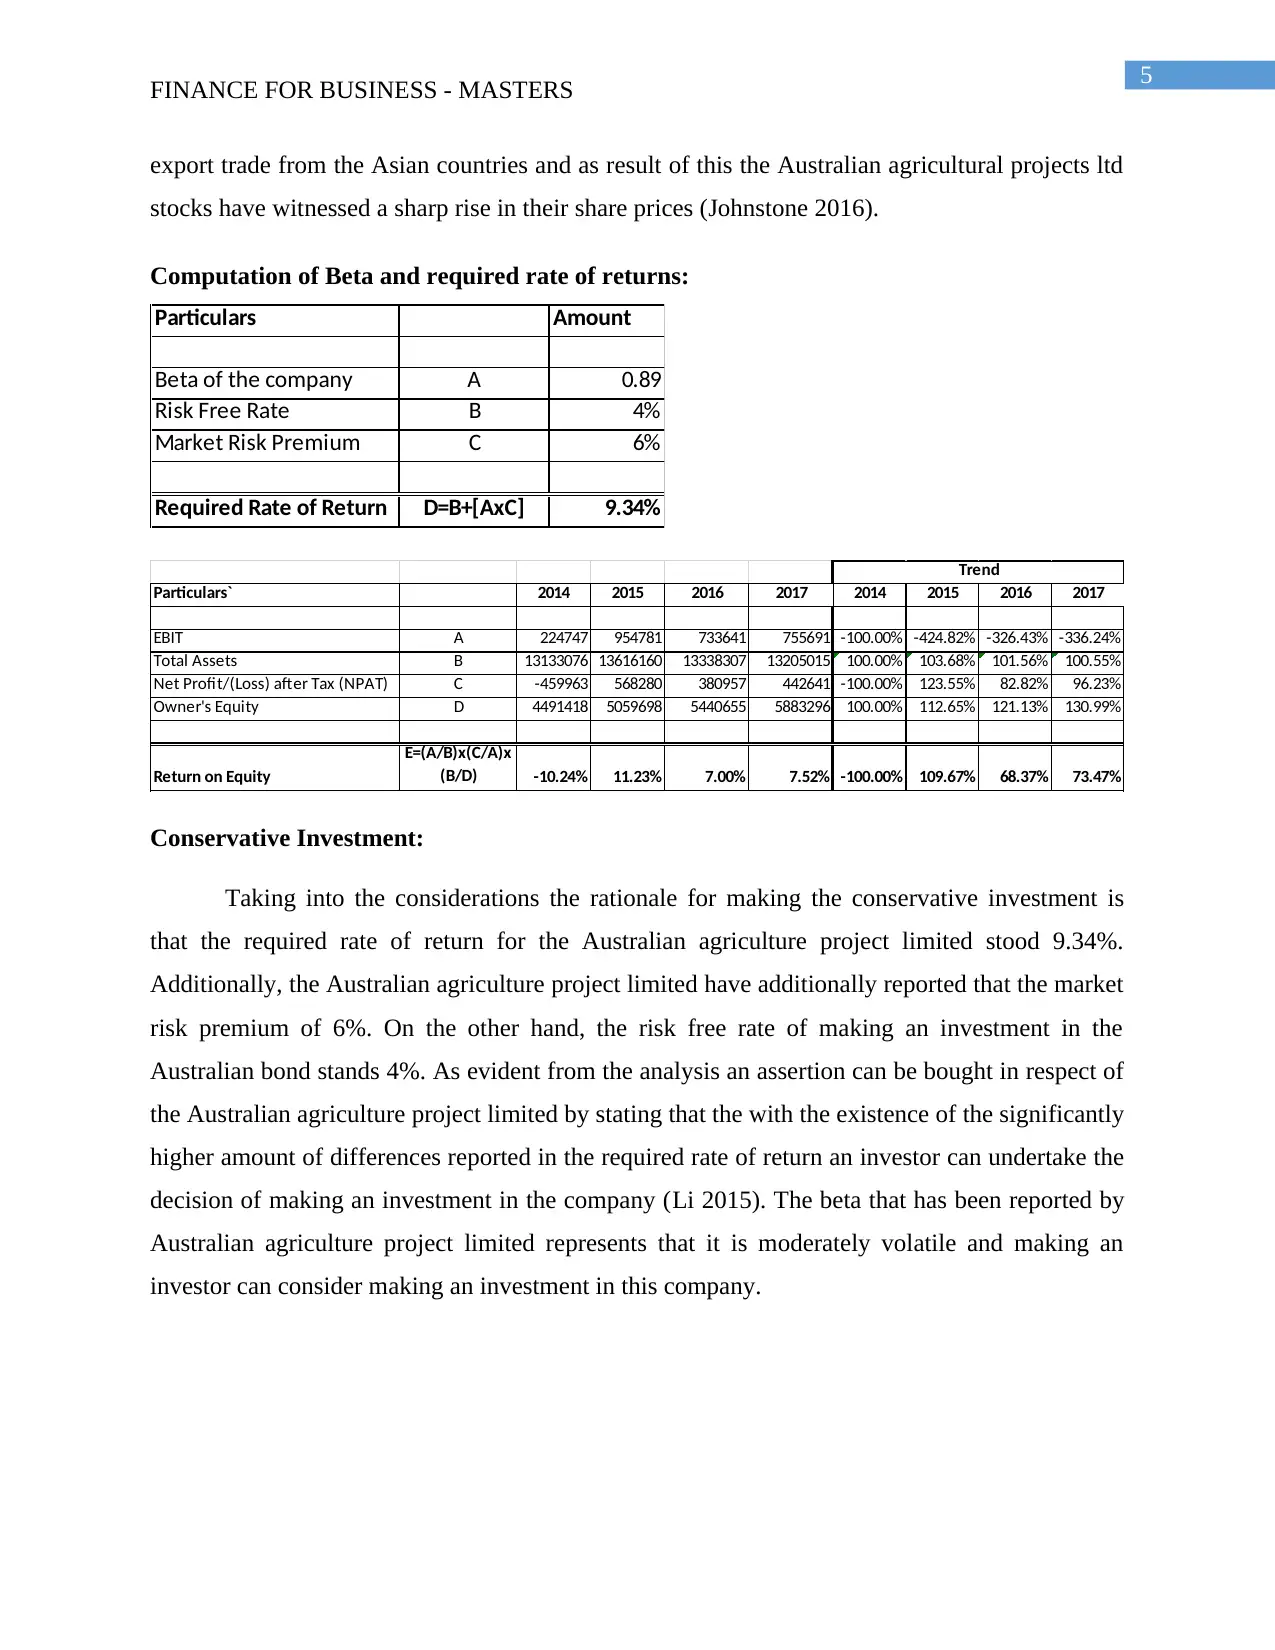
Conservative Investment:
Taking into the considerations the rationale for making the conservative investment is
that the required rate of return for the Australian agriculture project limited stood 9.34%.
Additionally, the Australian agriculture project limited have additionally reported that the market
risk premium of 6%. On the other hand, the risk free rate of making an investment in the
Australian bond stands 4%. As evident from the analysis an assertion can be bought in respect of
the Australian agriculture project limited by stating that the with the existence of the significantly
higher amount of differences reported in the required rate of return an investor can undertake the
decision of making an investment in the company (Li 2015). The beta that has been reported by
Australian agriculture project limited represents that it is moderately volatile and making an
investor can consider making an investment in this company.
FINANCE FOR BUSINESS - MASTERS
export trade from the Asian countries and as result of this the Australian agricultural projects ltd
stocks have witnessed a sharp rise in their share prices (Johnstone 2016).
Computation of Beta and required rate of returns:
Particulars Amount
Beta of the company A 0.89
Risk Free Rate B 4%
Market Risk Premium C 6%
Required Rate of Return D=B+[AxC] 9.34%
Particulars` 2014 2015 2016 2017 2014 2015 2016 2017
EBIT A 224747 954781 733641 755691 -100.00% -424.82% -326.43% -336.24%
Total Assets B 13133076 13616160 13338307 13205015 100.00% 103.68% 101.56% 100.55%
Net Profit/(Loss) after Tax (NPAT) C -459963 568280 380957 442641 -100.00% 123.55% 82.82% 96.23%
Owner's Equity D 4491418 5059698 5440655 5883296 100.00% 112.65% 121.13% 130.99%
Return on Equity
E=(A/B)x(C/A)x
(B/D) -10.24% 11.23% 7.00% 7.52% -100.00% 109.67% 68.37% 73.47%
Trend
Conservative Investment:
Taking into the considerations the rationale for making the conservative investment is
that the required rate of return for the Australian agriculture project limited stood 9.34%.
Additionally, the Australian agriculture project limited have additionally reported that the market
risk premium of 6%. On the other hand, the risk free rate of making an investment in the
Australian bond stands 4%. As evident from the analysis an assertion can be bought in respect of
the Australian agriculture project limited by stating that the with the existence of the significantly
higher amount of differences reported in the required rate of return an investor can undertake the
decision of making an investment in the company (Li 2015). The beta that has been reported by
Australian agriculture project limited represents that it is moderately volatile and making an
investor can consider making an investment in this company.
⊘ This is a preview!⊘
Do you want full access?
Subscribe today to unlock all pages.
Trusted by 1+ million students worldwide
6
FINANCE FOR BUSINESS - MASTERS
Weighted average cost of capital:
Particulars Amount Weightage Cost Return Rate Tax Rate WACC
Total Long Term Debt 4142512 41.32% 313050 7.56% 30.00% 2.19%
Total Equity 5883296 58.68% 9.34% 5.48%
TOTAL 10025808 100% 7.67%
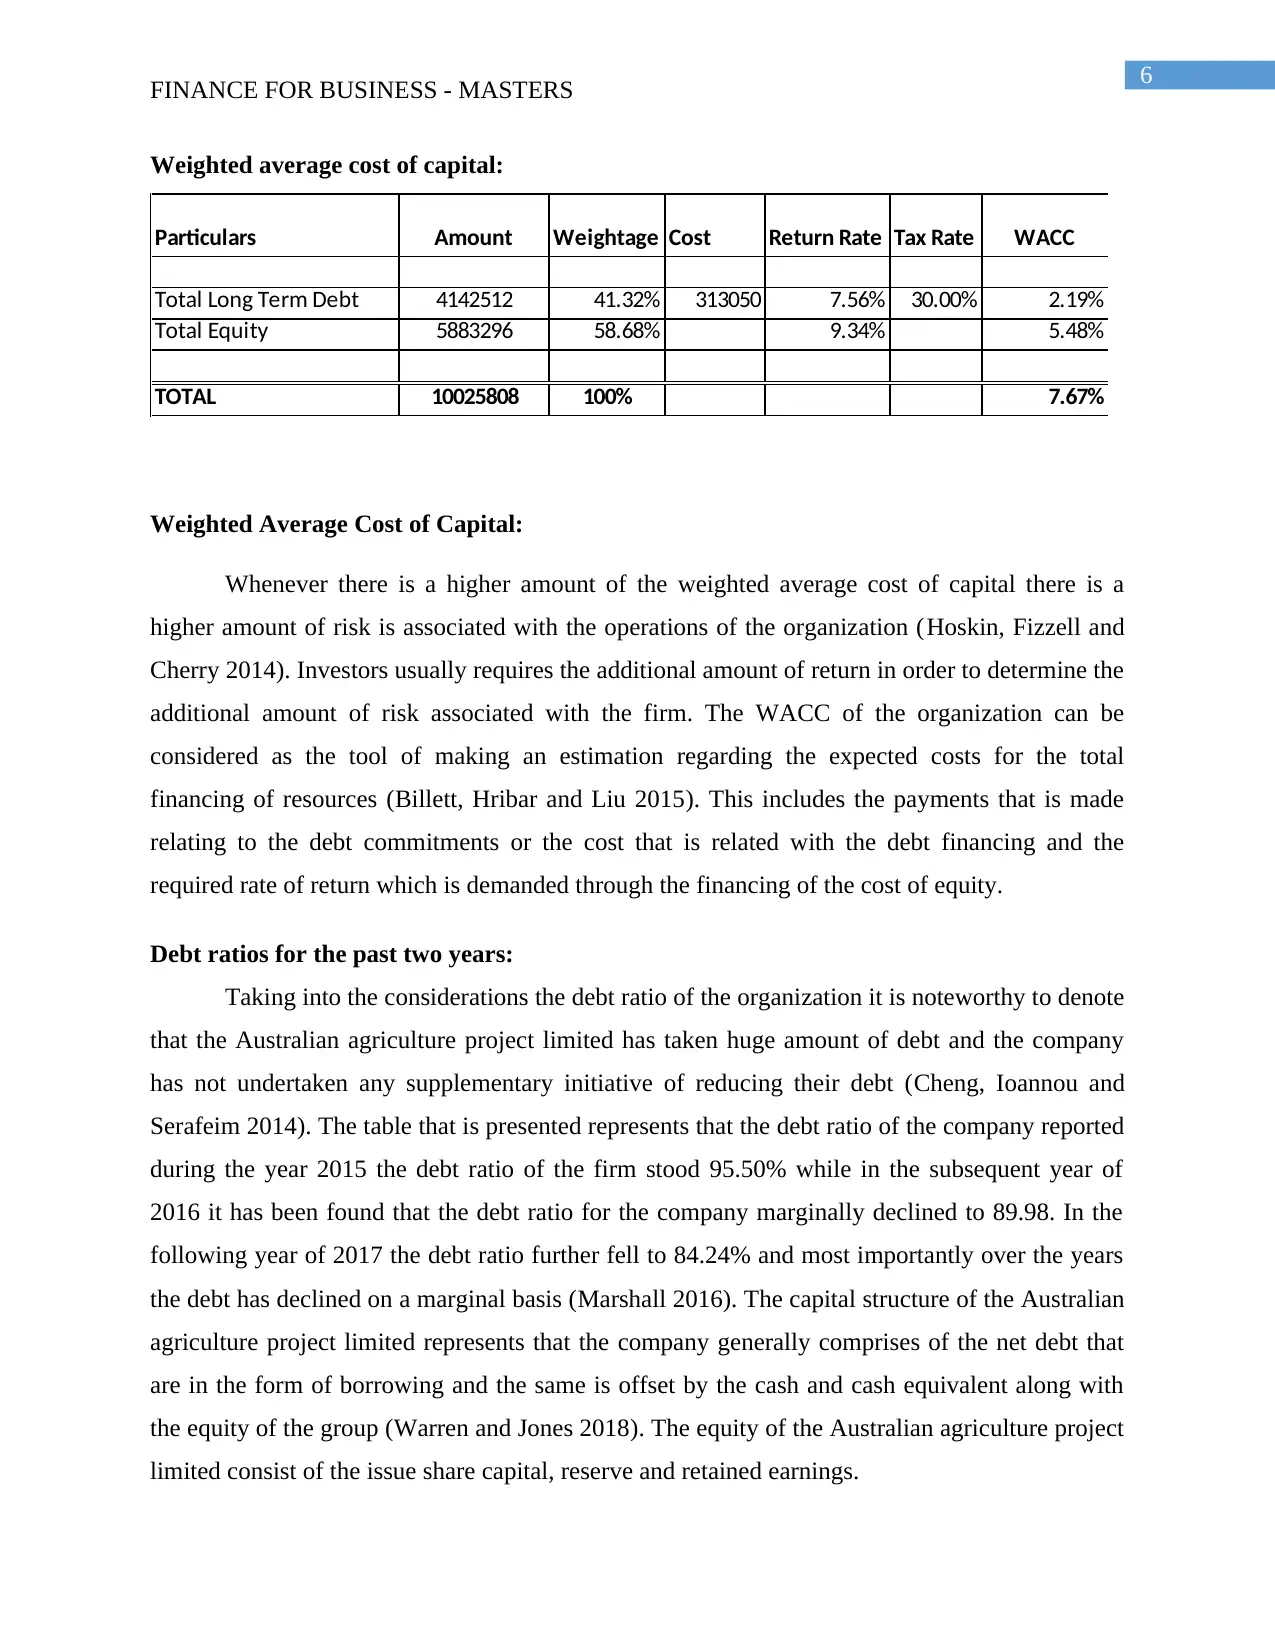
Weighted Average Cost of Capital:
Whenever there is a higher amount of the weighted average cost of capital there is a
higher amount of risk is associated with the operations of the organization (Hoskin, Fizzell and
Cherry 2014). Investors usually requires the additional amount of return in order to determine the
additional amount of risk associated with the firm. The WACC of the organization can be
considered as the tool of making an estimation regarding the expected costs for the total
financing of resources (Billett, Hribar and Liu 2015). This includes the payments that is made
relating to the debt commitments or the cost that is related with the debt financing and the
required rate of return which is demanded through the financing of the cost of equity.
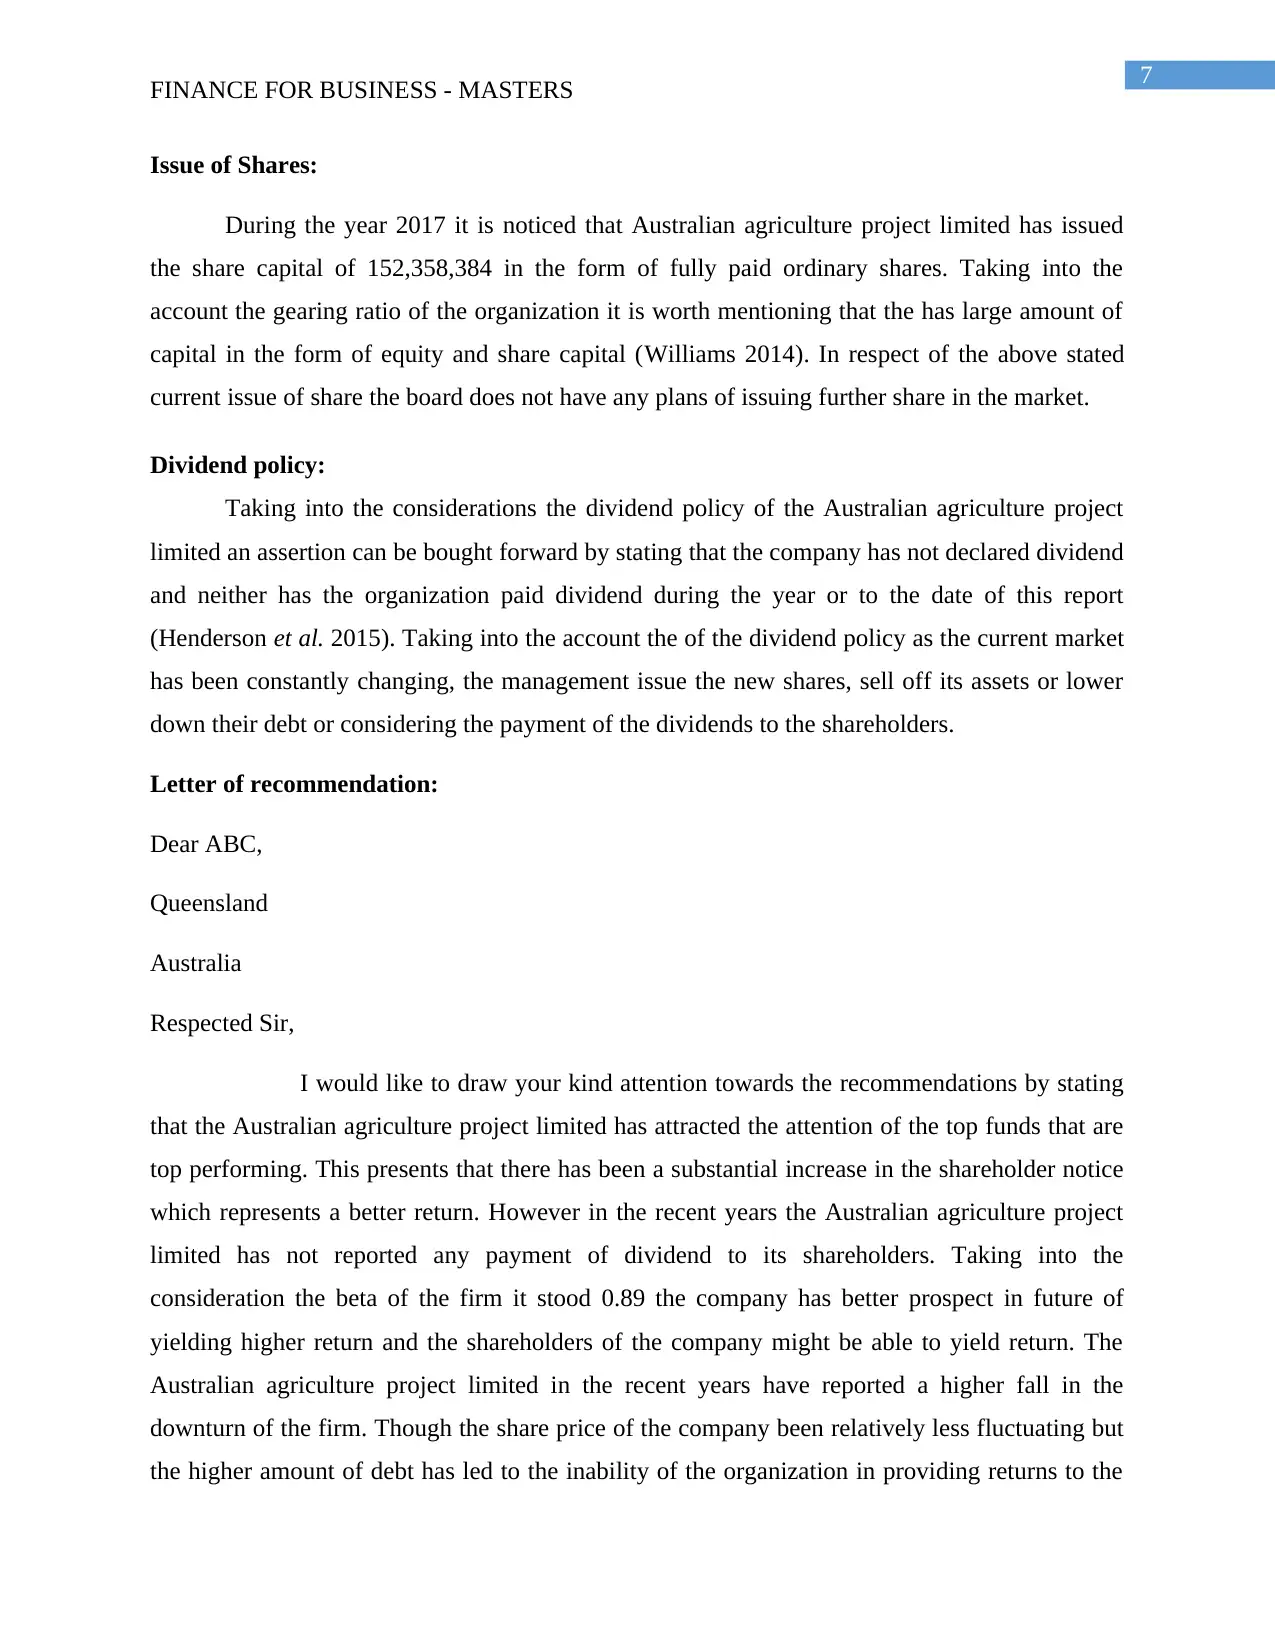
Debt ratios for the past two years:
Taking into the considerations the debt ratio of the organization it is noteworthy to denote
that the Australian agriculture project limited has taken huge amount of debt and the company
has not undertaken any supplementary initiative of reducing their debt (Cheng, Ioannou and
Serafeim 2014). The table that is presented represents that the debt ratio of the company reported
during the year 2015 the debt ratio of the firm stood 95.50% while in the subsequent year of
2016 it has been found that the debt ratio for the company marginally declined to 89.98. In the
following year of 2017 the debt ratio further fell to 84.24% and most importantly over the years
the debt has declined on a marginal basis (Marshall 2016). The capital structure of the Australian
agriculture project limited represents that the company generally comprises of the net debt that
are in the form of borrowing and the same is offset by the cash and cash equivalent along with
the equity of the group (Warren and Jones 2018). The equity of the Australian agriculture project
limited consist of the issue share capital, reserve and retained earnings.
FINANCE FOR BUSINESS - MASTERS
Weighted average cost of capital:
Particulars Amount Weightage Cost Return Rate Tax Rate WACC
Total Long Term Debt 4142512 41.32% 313050 7.56% 30.00% 2.19%
Total Equity 5883296 58.68% 9.34% 5.48%
TOTAL 10025808 100% 7.67%
Weighted Average Cost of Capital:
Whenever there is a higher amount of the weighted average cost of capital there is a
higher amount of risk is associated with the operations of the organization (Hoskin, Fizzell and
Cherry 2014). Investors usually requires the additional amount of return in order to determine the
additional amount of risk associated with the firm. The WACC of the organization can be
considered as the tool of making an estimation regarding the expected costs for the total
financing of resources (Billett, Hribar and Liu 2015). This includes the payments that is made
relating to the debt commitments or the cost that is related with the debt financing and the
required rate of return which is demanded through the financing of the cost of equity.
Debt ratios for the past two years:
Taking into the considerations the debt ratio of the organization it is noteworthy to denote
that the Australian agriculture project limited has taken huge amount of debt and the company
has not undertaken any supplementary initiative of reducing their debt (Cheng, Ioannou and
Serafeim 2014). The table that is presented represents that the debt ratio of the company reported
during the year 2015 the debt ratio of the firm stood 95.50% while in the subsequent year of
2016 it has been found that the debt ratio for the company marginally declined to 89.98. In the
following year of 2017 the debt ratio further fell to 84.24% and most importantly over the years
the debt has declined on a marginal basis (Marshall 2016). The capital structure of the Australian
agriculture project limited represents that the company generally comprises of the net debt that
are in the form of borrowing and the same is offset by the cash and cash equivalent along with
the equity of the group (Warren and Jones 2018). The equity of the Australian agriculture project
limited consist of the issue share capital, reserve and retained earnings.
Paraphrase This Document
Need a fresh take? Get an instant paraphrase of this document with our AI Paraphraser
7
FINANCE FOR BUSINESS - MASTERS
Issue of Shares:
During the year 2017 it is noticed that Australian agriculture project limited has issued
the share capital of 152,358,384 in the form of fully paid ordinary shares. Taking into the
account the gearing ratio of the organization it is worth mentioning that the has large amount of
capital in the form of equity and share capital (Williams 2014). In respect of the above stated
current issue of share the board does not have any plans of issuing further share in the market.
Dividend policy:
Taking into the considerations the dividend policy of the Australian agriculture project
limited an assertion can be bought forward by stating that the company has not declared dividend
and neither has the organization paid dividend during the year or to the date of this report
(Henderson et al. 2015). Taking into the account the of the dividend policy as the current market
has been constantly changing, the management issue the new shares, sell off its assets or lower
down their debt or considering the payment of the dividends to the shareholders.
Letter of recommendation:
Dear ABC,
Queensland
Australia
Respected Sir,
I would like to draw your kind attention towards the recommendations by stating
that the Australian agriculture project limited has attracted the attention of the top funds that are
top performing. This presents that there has been a substantial increase in the shareholder notice
which represents a better return. However in the recent years the Australian agriculture project
limited has not reported any payment of dividend to its shareholders. Taking into the
consideration the beta of the firm it stood 0.89 the company has better prospect in future of
yielding higher return and the shareholders of the company might be able to yield return. The
Australian agriculture project limited in the recent years have reported a higher fall in the
downturn of the firm. Though the share price of the company been relatively less fluctuating but
the higher amount of debt has led to the inability of the organization in providing returns to the
8
FINANCE FOR BUSINESS - MASTERS
shareholders. An important assertion in this regard is that Australian agriculture project limited
has been constantly adjustsing the capital strcture in order to gain a significant advantage relating
to the favorable cost of capital or higher return on the assets. Since the market has been
constantly changing, the management might issue new number of shares and sell the assets in
order to reduce their debt obligations and consider the payment of dividends to the shareholders.
Most importantly the company in the recent years have expressed their interest of paying
dividends to their shareholders. There hasn’t been much fluctuation in the share price of the firm
and hence as an investment prospect the investors can consider making an investment in
Australian agriculture project limited.
I hope that the recommendations that have been stated above has sufficiently provided you with
the appropriate information concerning the investment prospect and as an advice investing in the
company may yield return in the coming years.
Thanking you,
ABC
Investment Company
⊘ This is a preview!⊘
Do you want full access?
Subscribe today to unlock all pages.
Trusted by 1+ million students worldwide
9
FINANCE FOR BUSINESS - MASTERS
Reference List:
Baker, M. and Wurgler, J., 2015. Do strict capital requirements raise the cost of capital? Bank
regulation, capital structure, and the low-risk anomaly. The American Economic Review, 105(5),
pp.315-320.
Barberis, N., Greenwood, R., Jin, L. and Shleifer, A., 2015. X-CAPM: An extrapolative capital
asset pricing model. Journal of Financial Economics, 115(1), pp.1-24.
Billett, M.T., Hribar, P. and Liu, Y., 2015. Shareholder-manager alignment and the cost of debt.
Brooks, R., 2015. Financial management: core concepts. Pearson.
Brotherson, W.T., Eades, K.M., Harris, R.S. and Higgins, R.C., 2015. 'Best Practices' in
Estimating the Cost of Capital: An Update.
Cheng, B., Ioannou, I. and Serafeim, G., 2014. Corporate social responsibility and access to
finance. Strategic Management Journal, 35(1), pp.1-23.
Core, J.E., Hail, L. and Verdi, R.S., 2015. Mandatory disclosure quality, inside ownership, and
cost of capital. European Accounting Review, 24(1), pp.1-29.
Frank, M.Z. and Shen, T., 2016. Investment and the weighted average cost of capital. Journal of
Financial Economics, 119(2), pp.300-315.
Henderson, S., Peirson, G., Herbohn, K. and Howieson, B., 2015. Issues in financial accounting.
Pearson Higher Education AU.
Hoskin, R.E., Fizzell, M.R. and Cherry, D.C., 2014. Financial Accounting: a user perspective.
Wiley Global Education.
Johnstone, D., 2016. The effect of information on uncertainty and the cost of
capital. Contemporary Accounting Research, 33(2), pp.752-774.
Li, X., 2015. Accounting conservatism and the cost of capital: An international analysis. Journal
of Business Finance & Accounting, 42(5-6), pp.555-582.
Marshall, D., 2016. Accounting: What the numbers mean. McGraw-Hill Higher Education.
Paraphrase This Document
Need a fresh take? Get an instant paraphrase of this document with our AI Paraphraser

10
FINANCE FOR BUSINESS - MASTERS
Voopl.com.au. (2018). Victoria Olive Oil Project. [online] Available at:
http://www.voopl.com.au/aap-shareholders [Accessed 24 Jan. 2018].
Warren, C.S. and Jones, J., 2018. Corporate financial accounting. Cengage Learning.
Williams, J., 2014. Financial accounting. McGraw-Hill Higher Education.
11
FINANCE FOR BUSINESS - MASTERS
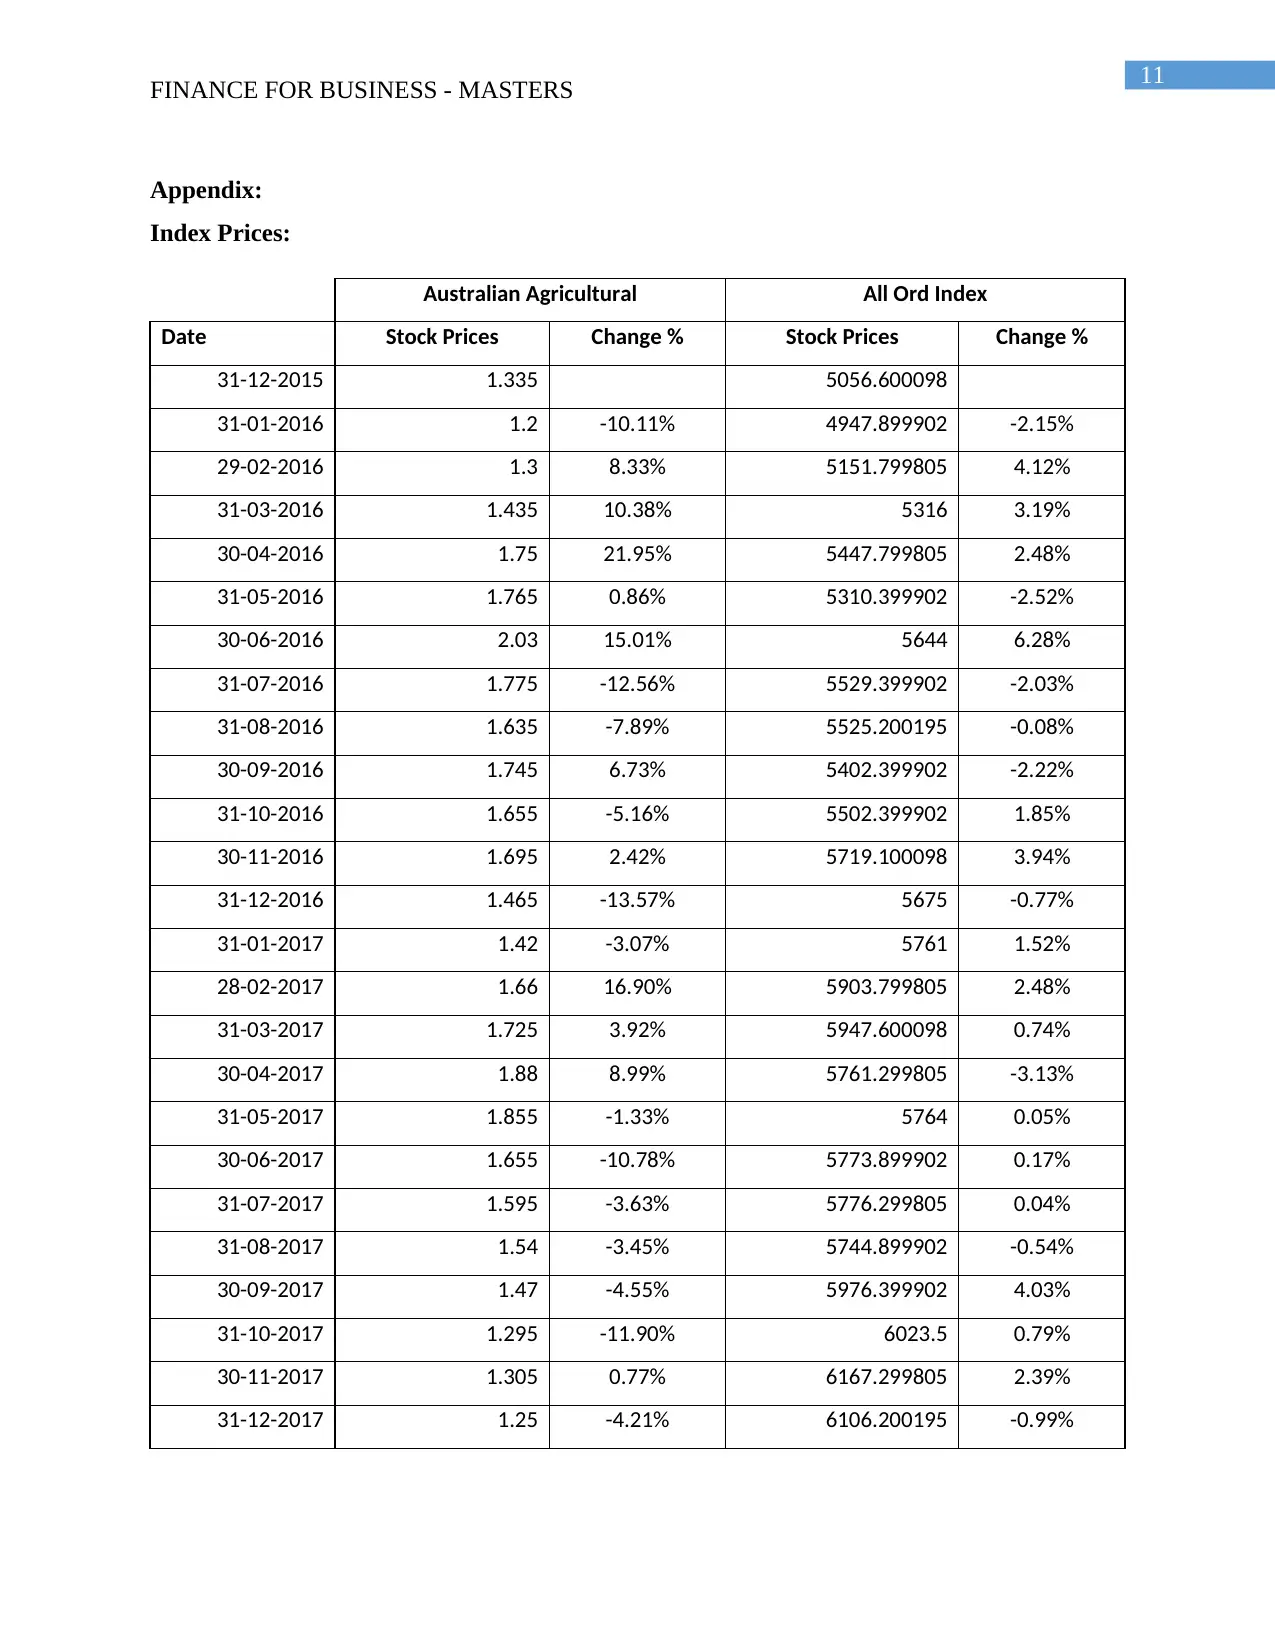
Appendix:
Index Prices:
Australian Agricultural All Ord Index
Date Stock Prices Change % Stock Prices Change %
31-12-2015 1.335 5056.600098
31-01-2016 1.2 -10.11% 4947.899902 -2.15%
29-02-2016 1.3 8.33% 5151.799805 4.12%
31-03-2016 1.435 10.38% 5316 3.19%
30-04-2016 1.75 21.95% 5447.799805 2.48%
31-05-2016 1.765 0.86% 5310.399902 -2.52%
30-06-2016 2.03 15.01% 5644 6.28%
31-07-2016 1.775 -12.56% 5529.399902 -2.03%
31-08-2016 1.635 -7.89% 5525.200195 -0.08%
30-09-2016 1.745 6.73% 5402.399902 -2.22%
31-10-2016 1.655 -5.16% 5502.399902 1.85%
30-11-2016 1.695 2.42% 5719.100098 3.94%
31-12-2016 1.465 -13.57% 5675 -0.77%
31-01-2017 1.42 -3.07% 5761 1.52%
28-02-2017 1.66 16.90% 5903.799805 2.48%
31-03-2017 1.725 3.92% 5947.600098 0.74%
30-04-2017 1.88 8.99% 5761.299805 -3.13%
31-05-2017 1.855 -1.33% 5764 0.05%
30-06-2017 1.655 -10.78% 5773.899902 0.17%
31-07-2017 1.595 -3.63% 5776.299805 0.04%
31-08-2017 1.54 -3.45% 5744.899902 -0.54%
30-09-2017 1.47 -4.55% 5976.399902 4.03%
31-10-2017 1.295 -11.90% 6023.5 0.79%
30-11-2017 1.305 0.77% 6167.299805 2.39%
31-12-2017 1.25 -4.21% 6106.200195 -0.99%
FINANCE FOR BUSINESS - MASTERS
Appendix:
Index Prices:
Australian Agricultural All Ord Index
Date Stock Prices Change % Stock Prices Change %
31-12-2015 1.335 5056.600098
31-01-2016 1.2 -10.11% 4947.899902 -2.15%
29-02-2016 1.3 8.33% 5151.799805 4.12%
31-03-2016 1.435 10.38% 5316 3.19%
30-04-2016 1.75 21.95% 5447.799805 2.48%
31-05-2016 1.765 0.86% 5310.399902 -2.52%
30-06-2016 2.03 15.01% 5644 6.28%
31-07-2016 1.775 -12.56% 5529.399902 -2.03%
31-08-2016 1.635 -7.89% 5525.200195 -0.08%
30-09-2016 1.745 6.73% 5402.399902 -2.22%
31-10-2016 1.655 -5.16% 5502.399902 1.85%
30-11-2016 1.695 2.42% 5719.100098 3.94%
31-12-2016 1.465 -13.57% 5675 -0.77%
31-01-2017 1.42 -3.07% 5761 1.52%
28-02-2017 1.66 16.90% 5903.799805 2.48%
31-03-2017 1.725 3.92% 5947.600098 0.74%
30-04-2017 1.88 8.99% 5761.299805 -3.13%
31-05-2017 1.855 -1.33% 5764 0.05%
30-06-2017 1.655 -10.78% 5773.899902 0.17%
31-07-2017 1.595 -3.63% 5776.299805 0.04%
31-08-2017 1.54 -3.45% 5744.899902 -0.54%
30-09-2017 1.47 -4.55% 5976.399902 4.03%
31-10-2017 1.295 -11.90% 6023.5 0.79%
30-11-2017 1.305 0.77% 6167.299805 2.39%
31-12-2017 1.25 -4.21% 6106.200195 -0.99%
⊘ This is a preview!⊘
Do you want full access?
Subscribe today to unlock all pages.
Trusted by 1+ million students worldwide
1 out of 13
Related Documents


Your All-in-One AI-Powered Toolkit for Academic Success.
+13062052269
info@desklib.com
Available 24*7 on WhatsApp / Email
![[object Object]](/_next/static/media/star-bottom.7253800d.svg)
Unlock your academic potential
Copyright © 2020–2026 A2Z Services. All Rights Reserved. Developed and managed by ZUCOL.