Weekly Rent Analysis for International Students in Australian Suburbs
VerifiedAdded on 2020/02/24
|8
|2396
|93
Report
AI Summary
This report analyzes the weekly rent paid by international students in four Australian suburbs: Sydney, Parramatta, Randwick, and Auburn. The study utilizes both primary and secondary datasets to compare rent costs, dwelling types, and the relationship between weekly rent and bond amounts. The findings reveal significant variations in average weekly rent across the suburbs, with Sydney being the most expensive and Auburn the most affordable. The analysis also explores the types of dwellings available, with flats being the most common. Furthermore, the report establishes a strong positive correlation between weekly rent and bond amounts. This information is crucial for international students planning their accommodation and budgeting for their stay in Australia. The report concludes by providing insights into the implications of these findings for students' accommodation choices.
Name
Student ID
Section 1: Introduction
Weekly rent is an important component that many international students have to consider before deciding
whether to take an offer or not. This study sought to analyze the weekly rent paid by international
students across four suburbs in Australia namely Sydney, Parramatta, Randwick and Auburn. The idea
was to document on the type of dwelling found in this suburbs and the weekly rent one would have to
incur so as to live any of this suburbs. Two datasets were analyzed. The first dataset (dataset 1) was a
primary data collected from students residing in the four suburbs while the second dataset (dataset 2) was
a secondary data obtained from the Rental Bond Board of NSW Fair trading.
Dataset 1:
Dataset 1 is a primary data that was collected among the international students who reside in Auburn,
Parramatta, Randwick and Sydney. A total of 100 respondents (25 respondents from each of the four
suburbs) took part in the study where they were asked to state the suburb they reside in and the weekly
rent they pay. One of the variable (weekly rent) is a numerical variable while the other (suburb) is a
nominal variable.
Dataset 2:
For dataset 2, it is a secondary data since the data was collected by someone else sometime back other
than the researcher and then it was stored in some database for future use. The dataset is kept and
maintained by The Rental Bond Board of NSW Fair Trading. Within the dataset, there are six variables
namely, bond amount, weekly rent, dwelling type, number of bedrooms, postcode and suburb. Four of the
six variables are numerical variables (bond amount, weekly rent, number of bedrooms and postcode)
while the other two variables nominal variables (categorical).
Section 2: International Students’ Weekly Rent
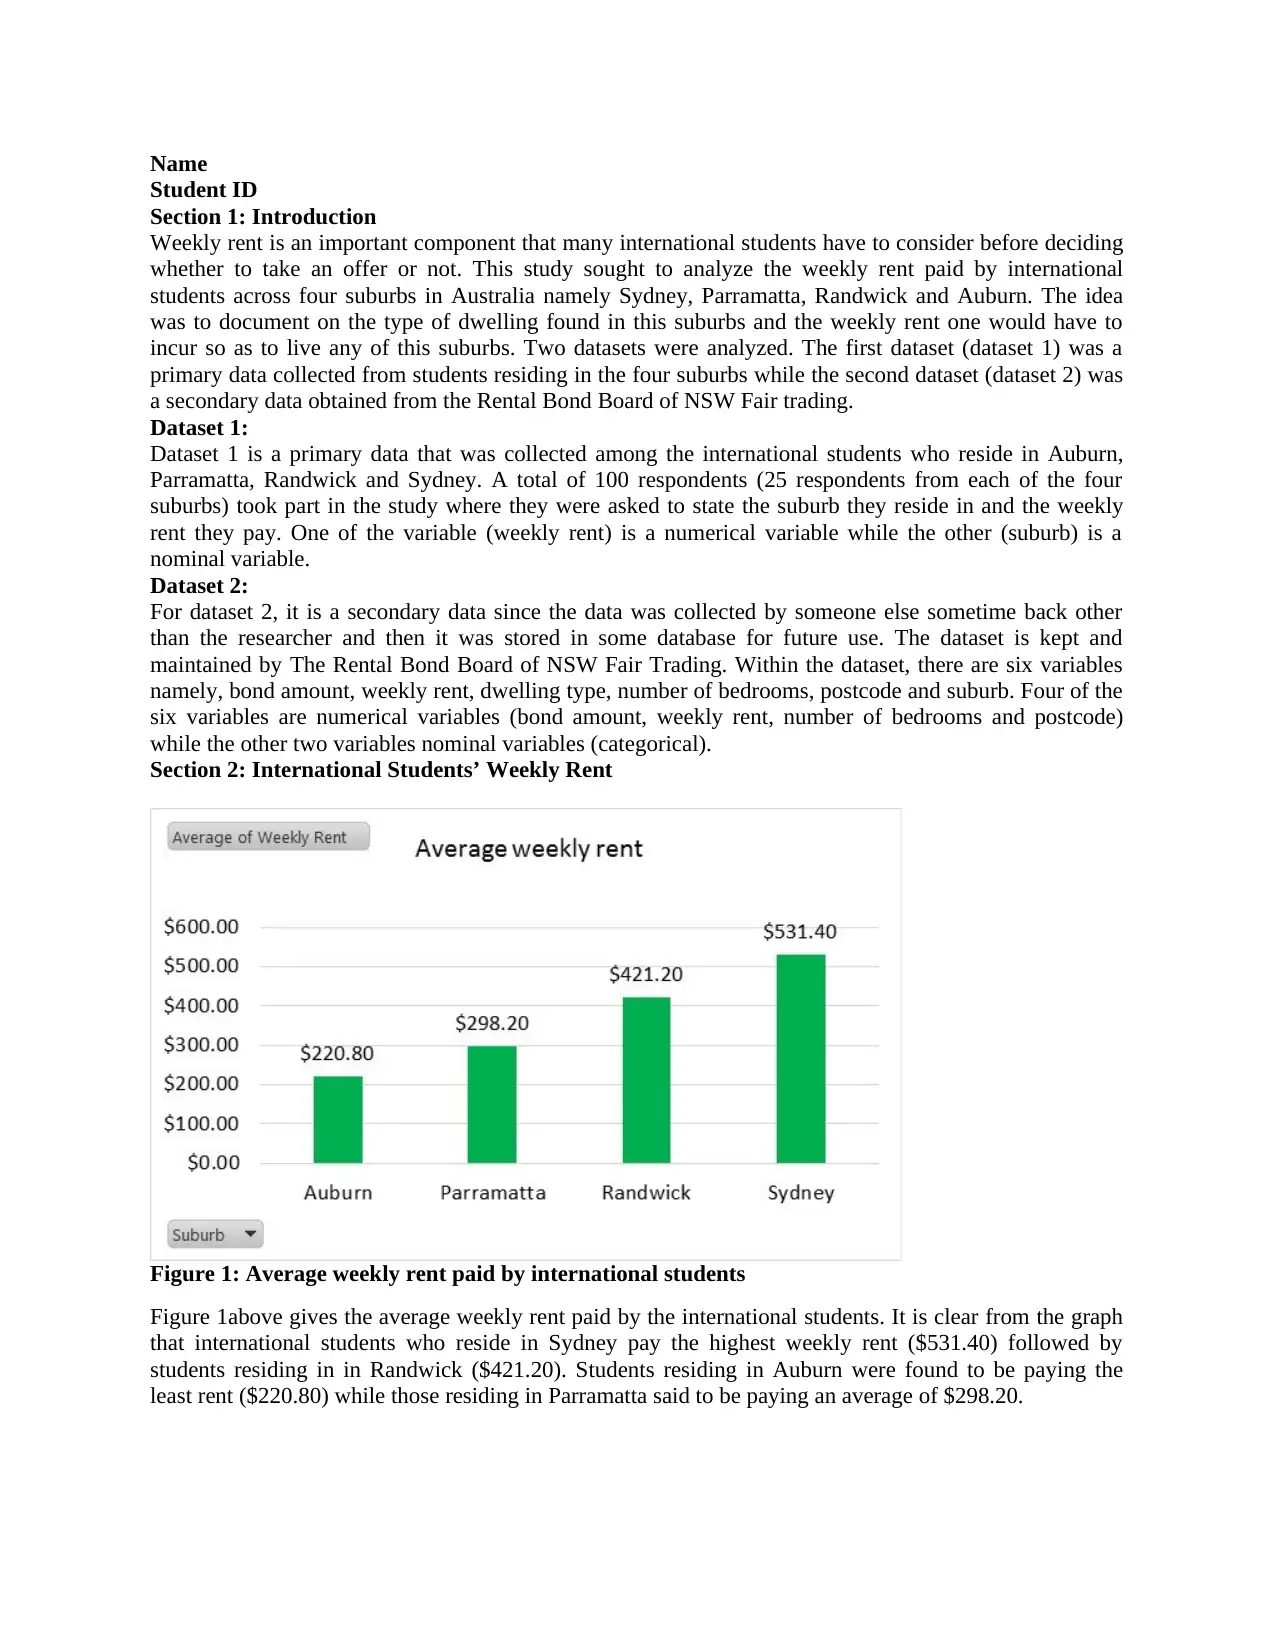
Figure 1: Average weekly rent paid by international students
Figure 1above gives the average weekly rent paid by the international students. It is clear from the graph
that international students who reside in Sydney pay the highest weekly rent ($531.40) followed by
students residing in in Randwick ($421.20). Students residing in Auburn were found to be paying the
least rent ($220.80) while those residing in Parramatta said to be paying an average of $298.20.
Student ID
Section 1: Introduction
Weekly rent is an important component that many international students have to consider before deciding
whether to take an offer or not. This study sought to analyze the weekly rent paid by international
students across four suburbs in Australia namely Sydney, Parramatta, Randwick and Auburn. The idea
was to document on the type of dwelling found in this suburbs and the weekly rent one would have to
incur so as to live any of this suburbs. Two datasets were analyzed. The first dataset (dataset 1) was a
primary data collected from students residing in the four suburbs while the second dataset (dataset 2) was
a secondary data obtained from the Rental Bond Board of NSW Fair trading.
Dataset 1:
Dataset 1 is a primary data that was collected among the international students who reside in Auburn,
Parramatta, Randwick and Sydney. A total of 100 respondents (25 respondents from each of the four
suburbs) took part in the study where they were asked to state the suburb they reside in and the weekly
rent they pay. One of the variable (weekly rent) is a numerical variable while the other (suburb) is a
nominal variable.
Dataset 2:
For dataset 2, it is a secondary data since the data was collected by someone else sometime back other
than the researcher and then it was stored in some database for future use. The dataset is kept and
maintained by The Rental Bond Board of NSW Fair Trading. Within the dataset, there are six variables
namely, bond amount, weekly rent, dwelling type, number of bedrooms, postcode and suburb. Four of the
six variables are numerical variables (bond amount, weekly rent, number of bedrooms and postcode)
while the other two variables nominal variables (categorical).
Section 2: International Students’ Weekly Rent
Figure 1: Average weekly rent paid by international students
Figure 1above gives the average weekly rent paid by the international students. It is clear from the graph
that international students who reside in Sydney pay the highest weekly rent ($531.40) followed by
students residing in in Randwick ($421.20). Students residing in Auburn were found to be paying the
least rent ($220.80) while those residing in Parramatta said to be paying an average of $298.20.
Paraphrase This Document
Need a fresh take? Get an instant paraphrase of this document with our AI Paraphraser
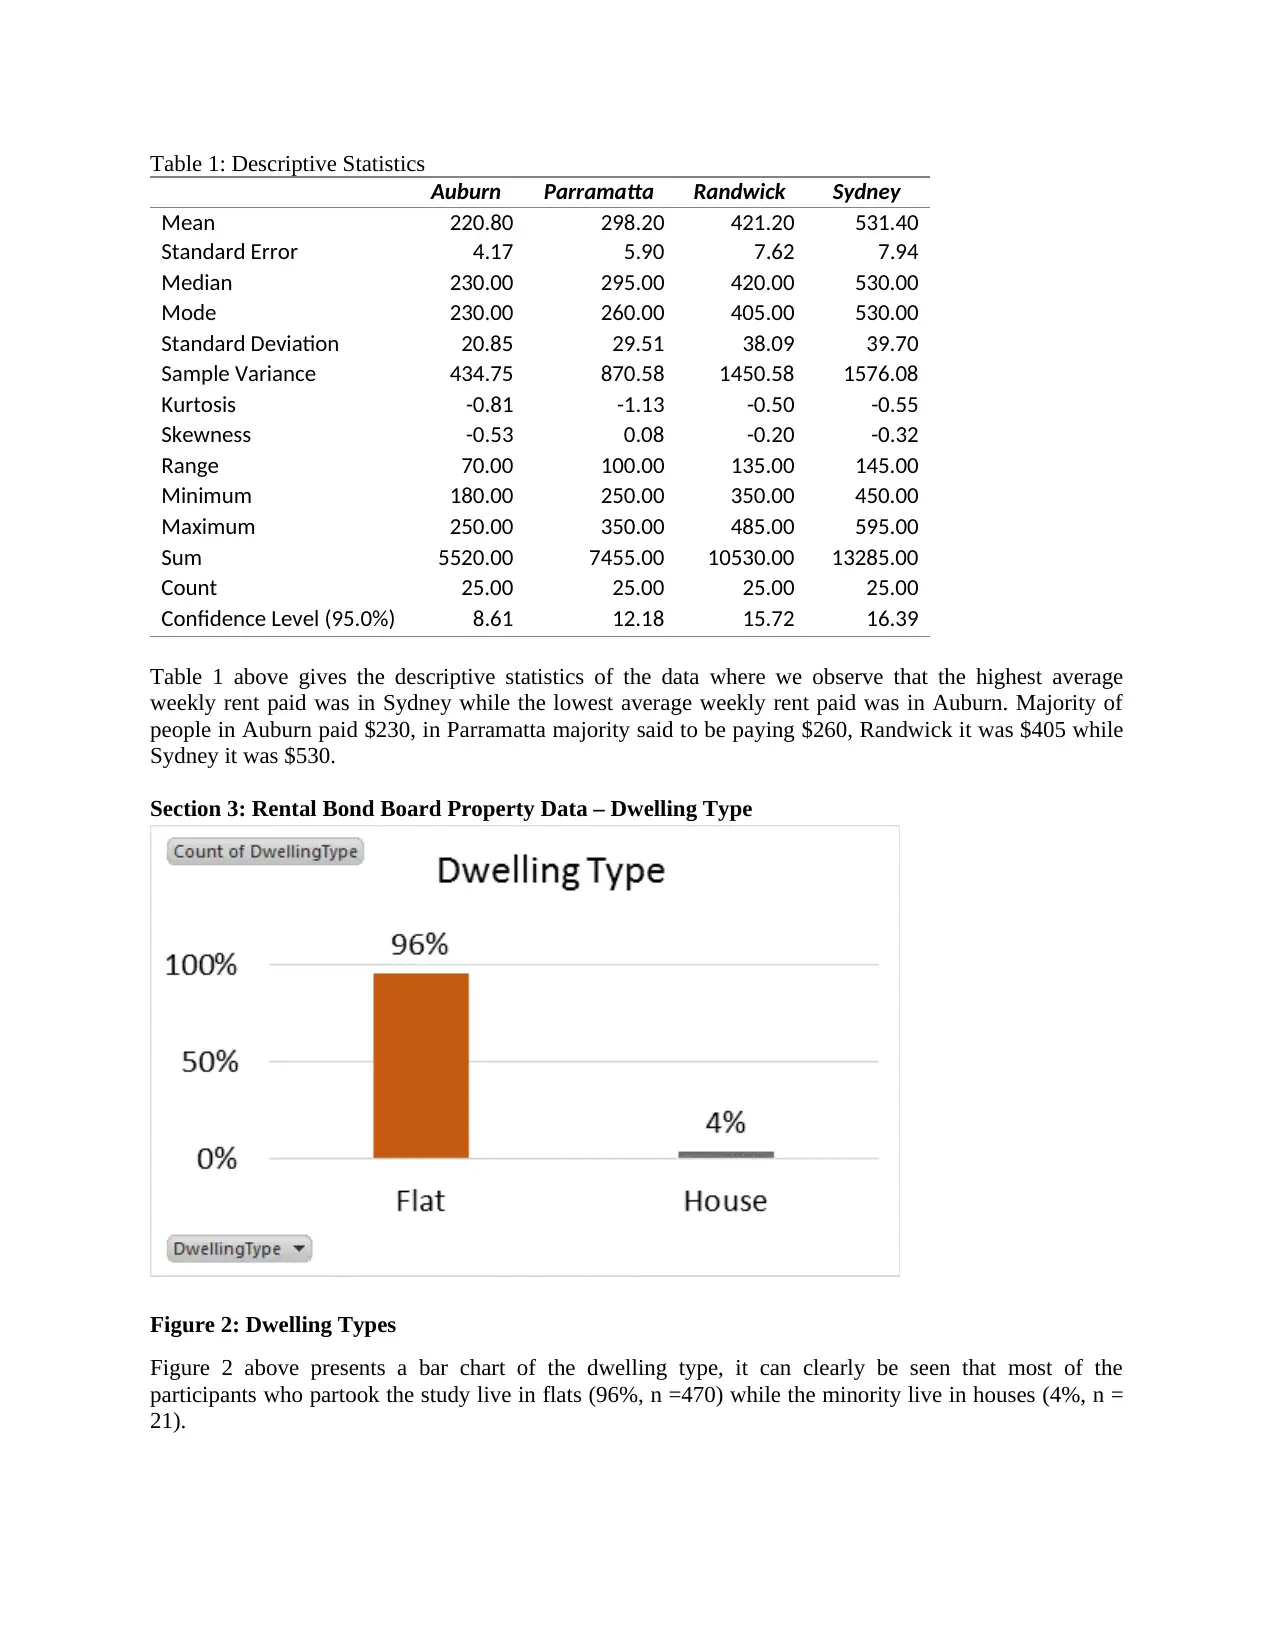
Table 1: Descriptive Statistics
Auburn Parramatta Randwick Sydney
Mean 220.80 298.20 421.20 531.40
Standard Error 4.17 5.90 7.62 7.94
Median 230.00 295.00 420.00 530.00
Mode 230.00 260.00 405.00 530.00
Standard Deviation 20.85 29.51 38.09 39.70
Sample Variance 434.75 870.58 1450.58 1576.08
Kurtosis -0.81 -1.13 -0.50 -0.55
Skewness -0.53 0.08 -0.20 -0.32
Range 70.00 100.00 135.00 145.00
Minimum 180.00 250.00 350.00 450.00
Maximum 250.00 350.00 485.00 595.00
Sum 5520.00 7455.00 10530.00 13285.00
Count 25.00 25.00 25.00 25.00
Confidence Level (95.0%) 8.61 12.18 15.72 16.39
Table 1 above gives the descriptive statistics of the data where we observe that the highest average
weekly rent paid was in Sydney while the lowest average weekly rent paid was in Auburn. Majority of
people in Auburn paid $230, in Parramatta majority said to be paying $260, Randwick it was $405 while
Sydney it was $530.
Section 3: Rental Bond Board Property Data – Dwelling Type
Figure 2: Dwelling Types
Figure 2 above presents a bar chart of the dwelling type, it can clearly be seen that most of the
participants who partook the study live in flats (96%, n =470) while the minority live in houses (4%, n =
21).
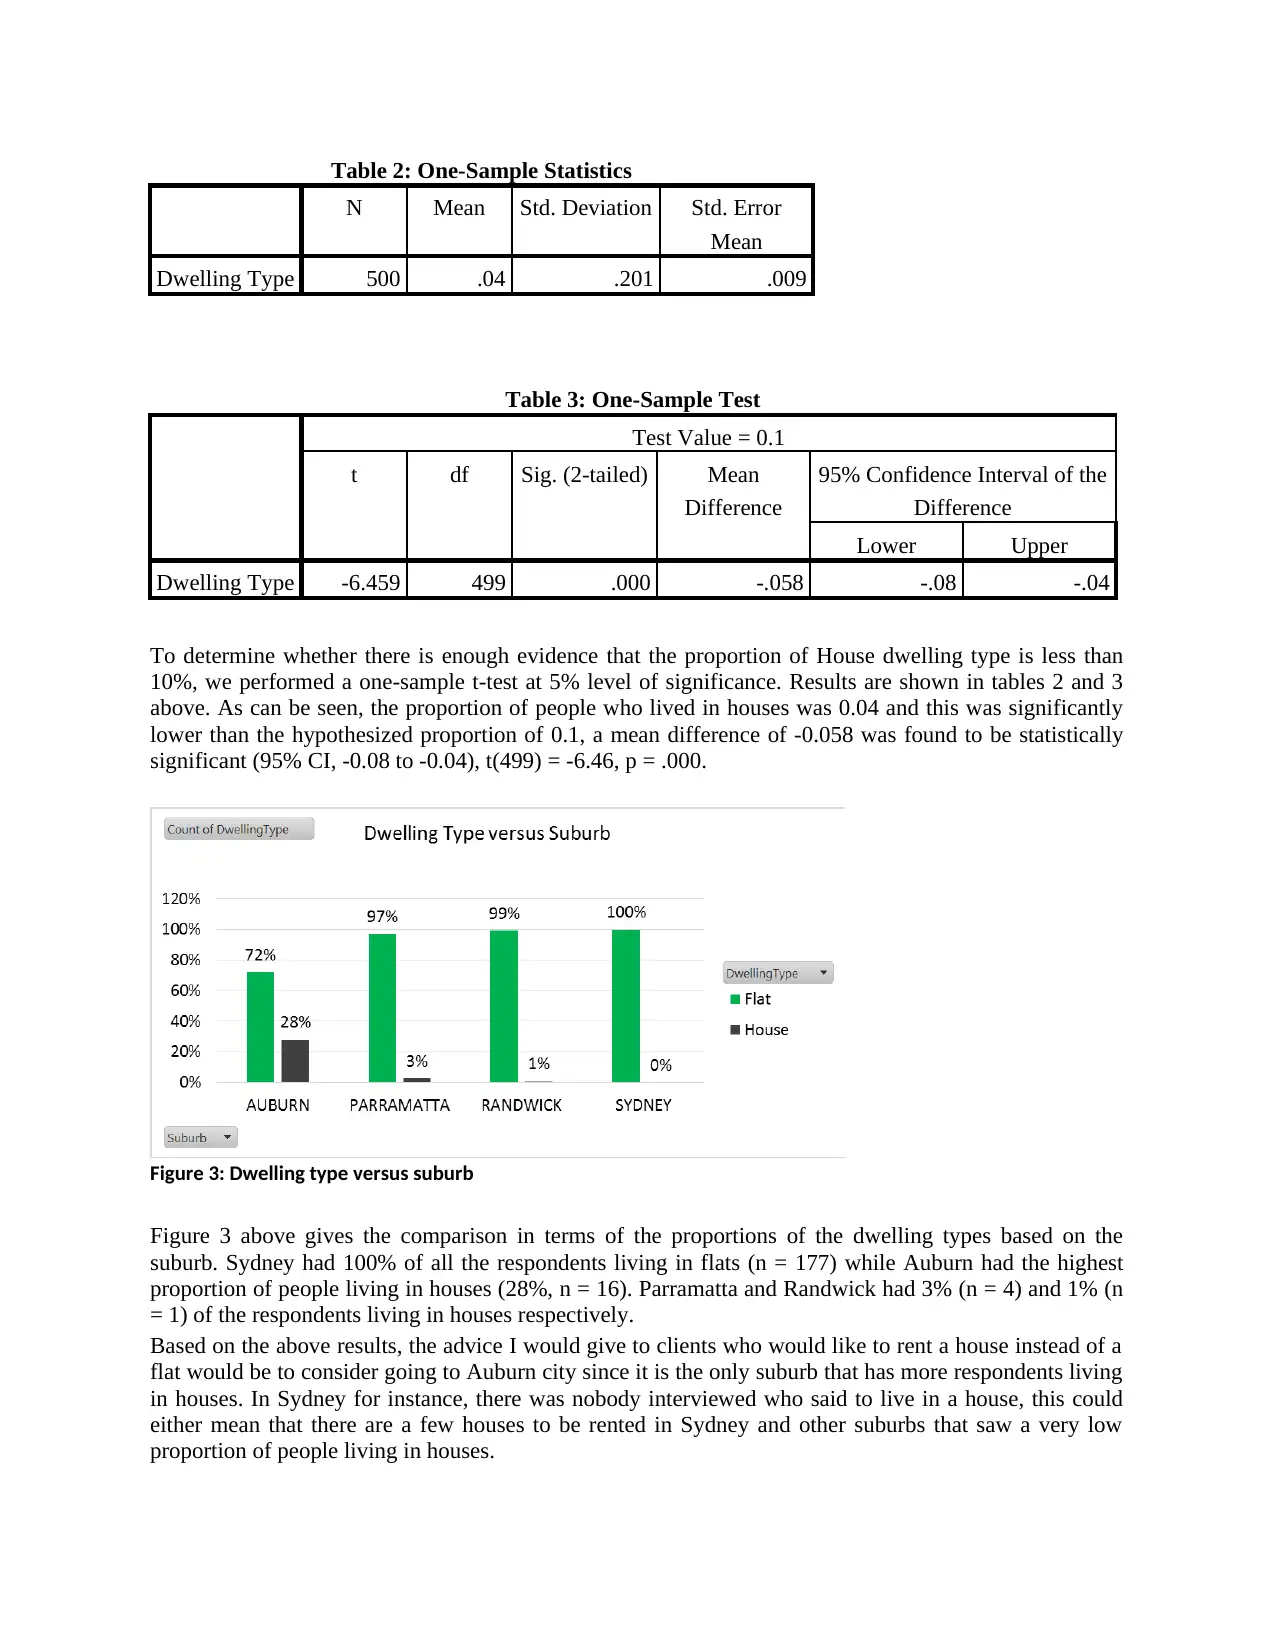
Table 2: One-Sample Statistics
N Mean Std. Deviation Std. Error
Mean
Dwelling Type 500 .04 .201 .009
Table 3: One-Sample Test
Test Value = 0.1
t df Sig. (2-tailed) Mean
Difference
95% Confidence Interval of the
Difference
Lower Upper
Dwelling Type -6.459 499 .000 -.058 -.08 -.04
To determine whether there is enough evidence that the proportion of House dwelling type is less than
10%, we performed a one-sample t-test at 5% level of significance. Results are shown in tables 2 and 3
above. As can be seen, the proportion of people who lived in houses was 0.04 and this was significantly
lower than the hypothesized proportion of 0.1, a mean difference of -0.058 was found to be statistically
significant (95% CI, -0.08 to -0.04), t(499) = -6.46, p = .000.
Figure 3 above gives the comparison in terms of the proportions of the dwelling types based on the
suburb. Sydney had 100% of all the respondents living in flats (n = 177) while Auburn had the highest
proportion of people living in houses (28%, n = 16). Parramatta and Randwick had 3% (n = 4) and 1% (n
= 1) of the respondents living in houses respectively.
Based on the above results, the advice I would give to clients who would like to rent a house instead of a
flat would be to consider going to Auburn city since it is the only suburb that has more respondents living
in houses. In Sydney for instance, there was nobody interviewed who said to live in a house, this could
either mean that there are a few houses to be rented in Sydney and other suburbs that saw a very low
proportion of people living in houses.
Figure 3: Dwelling type versus suburb
⊘ This is a preview!⊘
Do you want full access?
Subscribe today to unlock all pages.
Trusted by 1+ million students worldwide
Section 4: Rental Bond Board Property Data – Weekly Rent
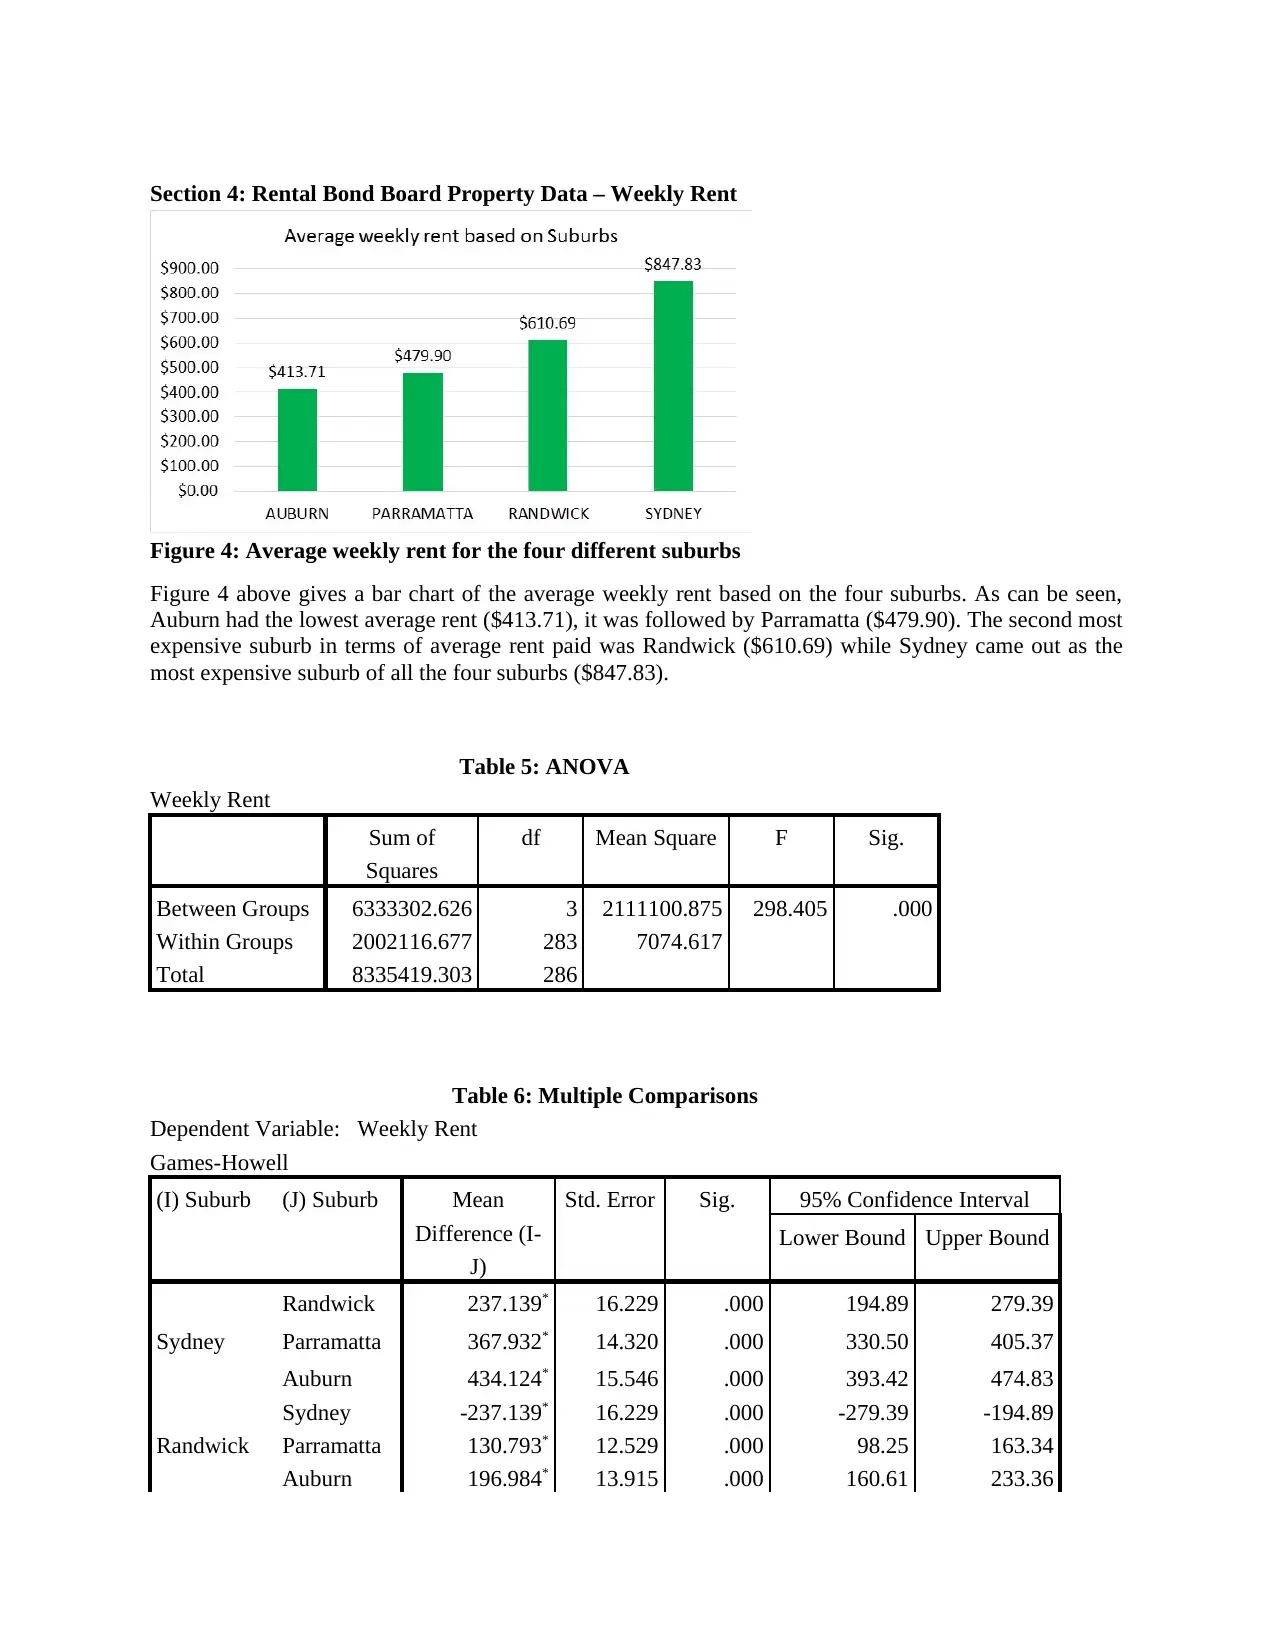
Figure 4: Average weekly rent for the four different suburbs
Figure 4 above gives a bar chart of the average weekly rent based on the four suburbs. As can be seen,
Auburn had the lowest average rent ($413.71), it was followed by Parramatta ($479.90). The second most
expensive suburb in terms of average rent paid was Randwick ($610.69) while Sydney came out as the
most expensive suburb of all the four suburbs ($847.83).
Table 5: ANOVA
Weekly Rent
Sum of
Squares
df Mean Square F Sig.
Between Groups 6333302.626 3 2111100.875 298.405 .000
Within Groups 2002116.677 283 7074.617
Total 8335419.303 286
Table 6: Multiple Comparisons
Dependent Variable: Weekly Rent
Games-Howell
(I) Suburb (J) Suburb Mean
Difference (I-
J)
Std. Error Sig. 95% Confidence Interval
Lower Bound Upper Bound
Sydney
Randwick 237.139* 16.229 .000 194.89 279.39
Parramatta 367.932* 14.320 .000 330.50 405.37
Auburn 434.124* 15.546 .000 393.42 474.83
Randwick
Sydney -237.139* 16.229 .000 -279.39 -194.89
Parramatta 130.793* 12.529 .000 98.25 163.34
Auburn 196.984* 13.915 .000 160.61 233.36
Paraphrase This Document
Need a fresh take? Get an instant paraphrase of this document with our AI Paraphraser
Parramatta
Sydney -367.932* 14.320 .000 -405.37 -330.50
Randwick -130.793* 12.529 .000 -163.34 -98.25
Auburn 66.191* 11.632 .000 35.56 96.82
Auburn Sydney -434.124* 15.546 .000 -474.83 -393.42
Randwick -196.984* 13.915 .000 -233.36 -160.61
Parramatta -66.191* 11.632 .000 -96.82 -35.56
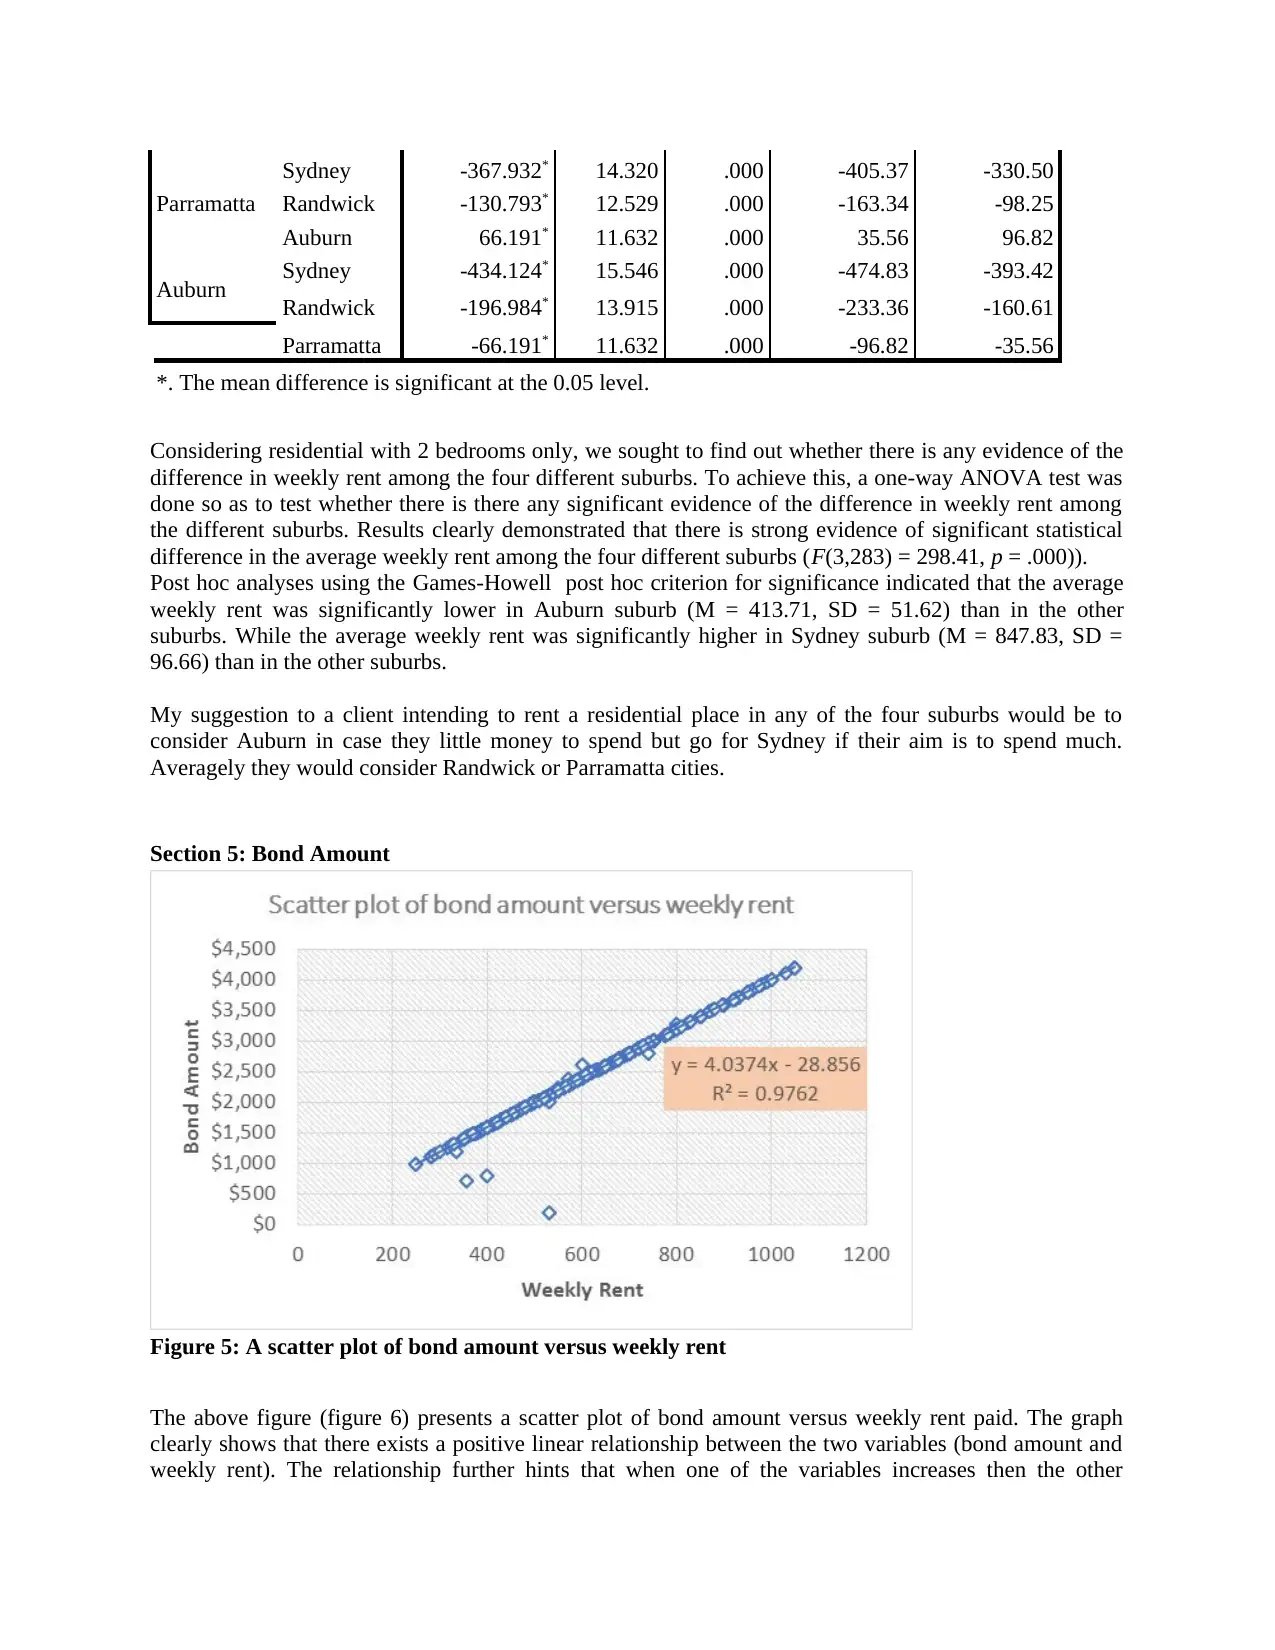
*. The mean difference is significant at the 0.05 level.
Considering residential with 2 bedrooms only, we sought to find out whether there is any evidence of the
difference in weekly rent among the four different suburbs. To achieve this, a one-way ANOVA test was
done so as to test whether there is there any significant evidence of the difference in weekly rent among
the different suburbs. Results clearly demonstrated that there is strong evidence of significant statistical
difference in the average weekly rent among the four different suburbs (F(3,283) = 298.41, p = .000)).
Post hoc analyses using the Games-Howell post hoc criterion for significance indicated that the average
weekly rent was significantly lower in Auburn suburb (M = 413.71, SD = 51.62) than in the other
suburbs. While the average weekly rent was significantly higher in Sydney suburb (M = 847.83, SD =
96.66) than in the other suburbs.
My suggestion to a client intending to rent a residential place in any of the four suburbs would be to
consider Auburn in case they little money to spend but go for Sydney if their aim is to spend much.
Averagely they would consider Randwick or Parramatta cities.
Section 5: Bond Amount
Figure 5: A scatter plot of bond amount versus weekly rent
The above figure (figure 6) presents a scatter plot of bond amount versus weekly rent paid. The graph
clearly shows that there exists a positive linear relationship between the two variables (bond amount and
weekly rent). The relationship further hints that when one of the variables increases then the other
Sydney -367.932* 14.320 .000 -405.37 -330.50
Randwick -130.793* 12.529 .000 -163.34 -98.25
Auburn 66.191* 11.632 .000 35.56 96.82
Auburn Sydney -434.124* 15.546 .000 -474.83 -393.42
Randwick -196.984* 13.915 .000 -233.36 -160.61
Parramatta -66.191* 11.632 .000 -96.82 -35.56
*. The mean difference is significant at the 0.05 level.
Considering residential with 2 bedrooms only, we sought to find out whether there is any evidence of the
difference in weekly rent among the four different suburbs. To achieve this, a one-way ANOVA test was
done so as to test whether there is there any significant evidence of the difference in weekly rent among
the different suburbs. Results clearly demonstrated that there is strong evidence of significant statistical
difference in the average weekly rent among the four different suburbs (F(3,283) = 298.41, p = .000)).
Post hoc analyses using the Games-Howell post hoc criterion for significance indicated that the average
weekly rent was significantly lower in Auburn suburb (M = 413.71, SD = 51.62) than in the other
suburbs. While the average weekly rent was significantly higher in Sydney suburb (M = 847.83, SD =
96.66) than in the other suburbs.
My suggestion to a client intending to rent a residential place in any of the four suburbs would be to
consider Auburn in case they little money to spend but go for Sydney if their aim is to spend much.
Averagely they would consider Randwick or Parramatta cities.
Section 5: Bond Amount
Figure 5: A scatter plot of bond amount versus weekly rent
The above figure (figure 6) presents a scatter plot of bond amount versus weekly rent paid. The graph
clearly shows that there exists a positive linear relationship between the two variables (bond amount and
weekly rent). The relationship further hints that when one of the variables increases then the other
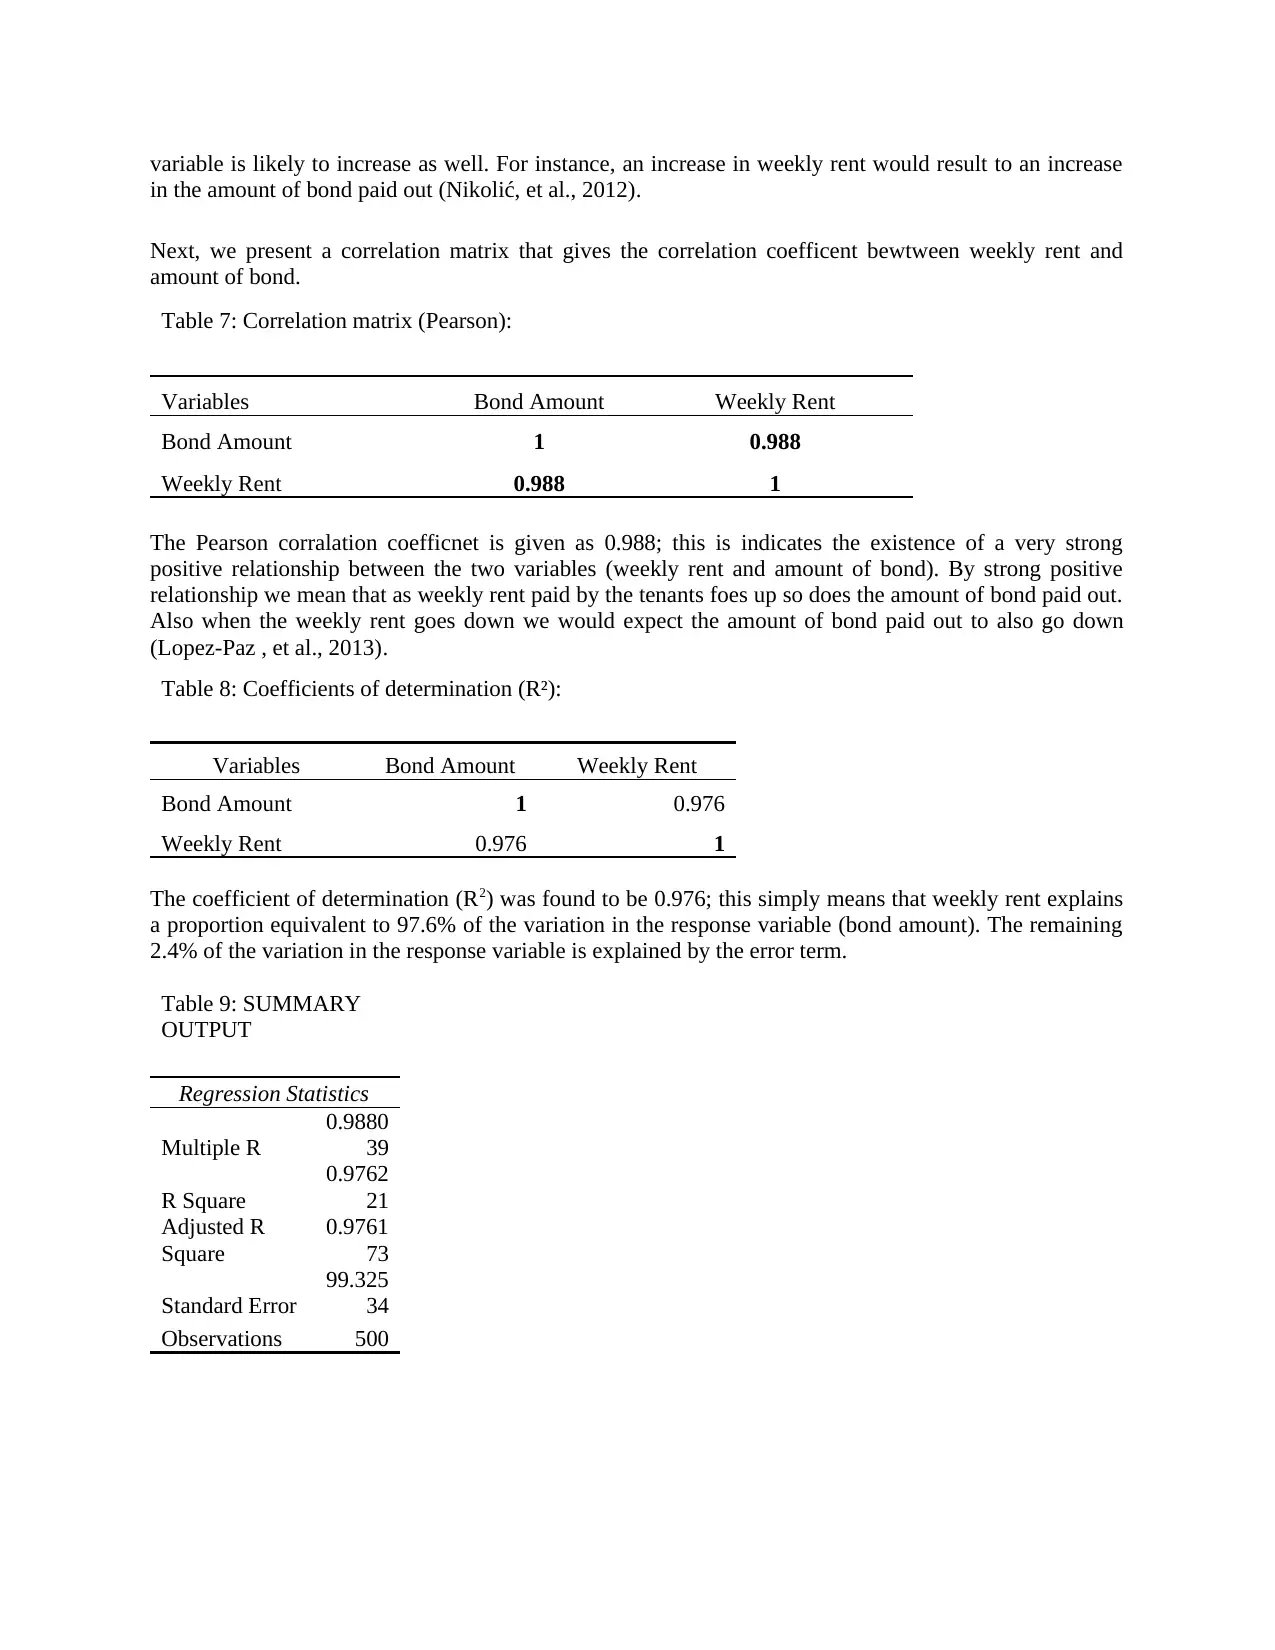
variable is likely to increase as well. For instance, an increase in weekly rent would result to an increase
in the amount of bond paid out (Nikolić, et al., 2012).
Next, we present a correlation matrix that gives the correlation coefficent bewtween weekly rent and
amount of bond.
Table 7: Correlation matrix (Pearson):
Variables Bond Amount Weekly Rent
Bond Amount 1 0.988
Weekly Rent 0.988 1
The Pearson corralation coefficnet is given as 0.988; this is indicates the existence of a very strong
positive relationship between the two variables (weekly rent and amount of bond). By strong positive
relationship we mean that as weekly rent paid by the tenants foes up so does the amount of bond paid out.
Also when the weekly rent goes down we would expect the amount of bond paid out to also go down
(Lopez-Paz , et al., 2013).
Table 8: Coefficients of determination (R²):
Variables Bond Amount Weekly Rent
Bond Amount 1 0.976
Weekly Rent 0.976 1
The coefficient of determination (R2) was found to be 0.976; this simply means that weekly rent explains
a proportion equivalent to 97.6% of the variation in the response variable (bond amount). The remaining
2.4% of the variation in the response variable is explained by the error term.
Table 9: SUMMARY
OUTPUT
Regression Statistics
Multiple R
0.9880
39
R Square
0.9762
21
Adjusted R
Square
0.9761
73
Standard Error
99.325
34
Observations 500
⊘ This is a preview!⊘
Do you want full access?
Subscribe today to unlock all pages.
Trusted by 1+ million students worldwide
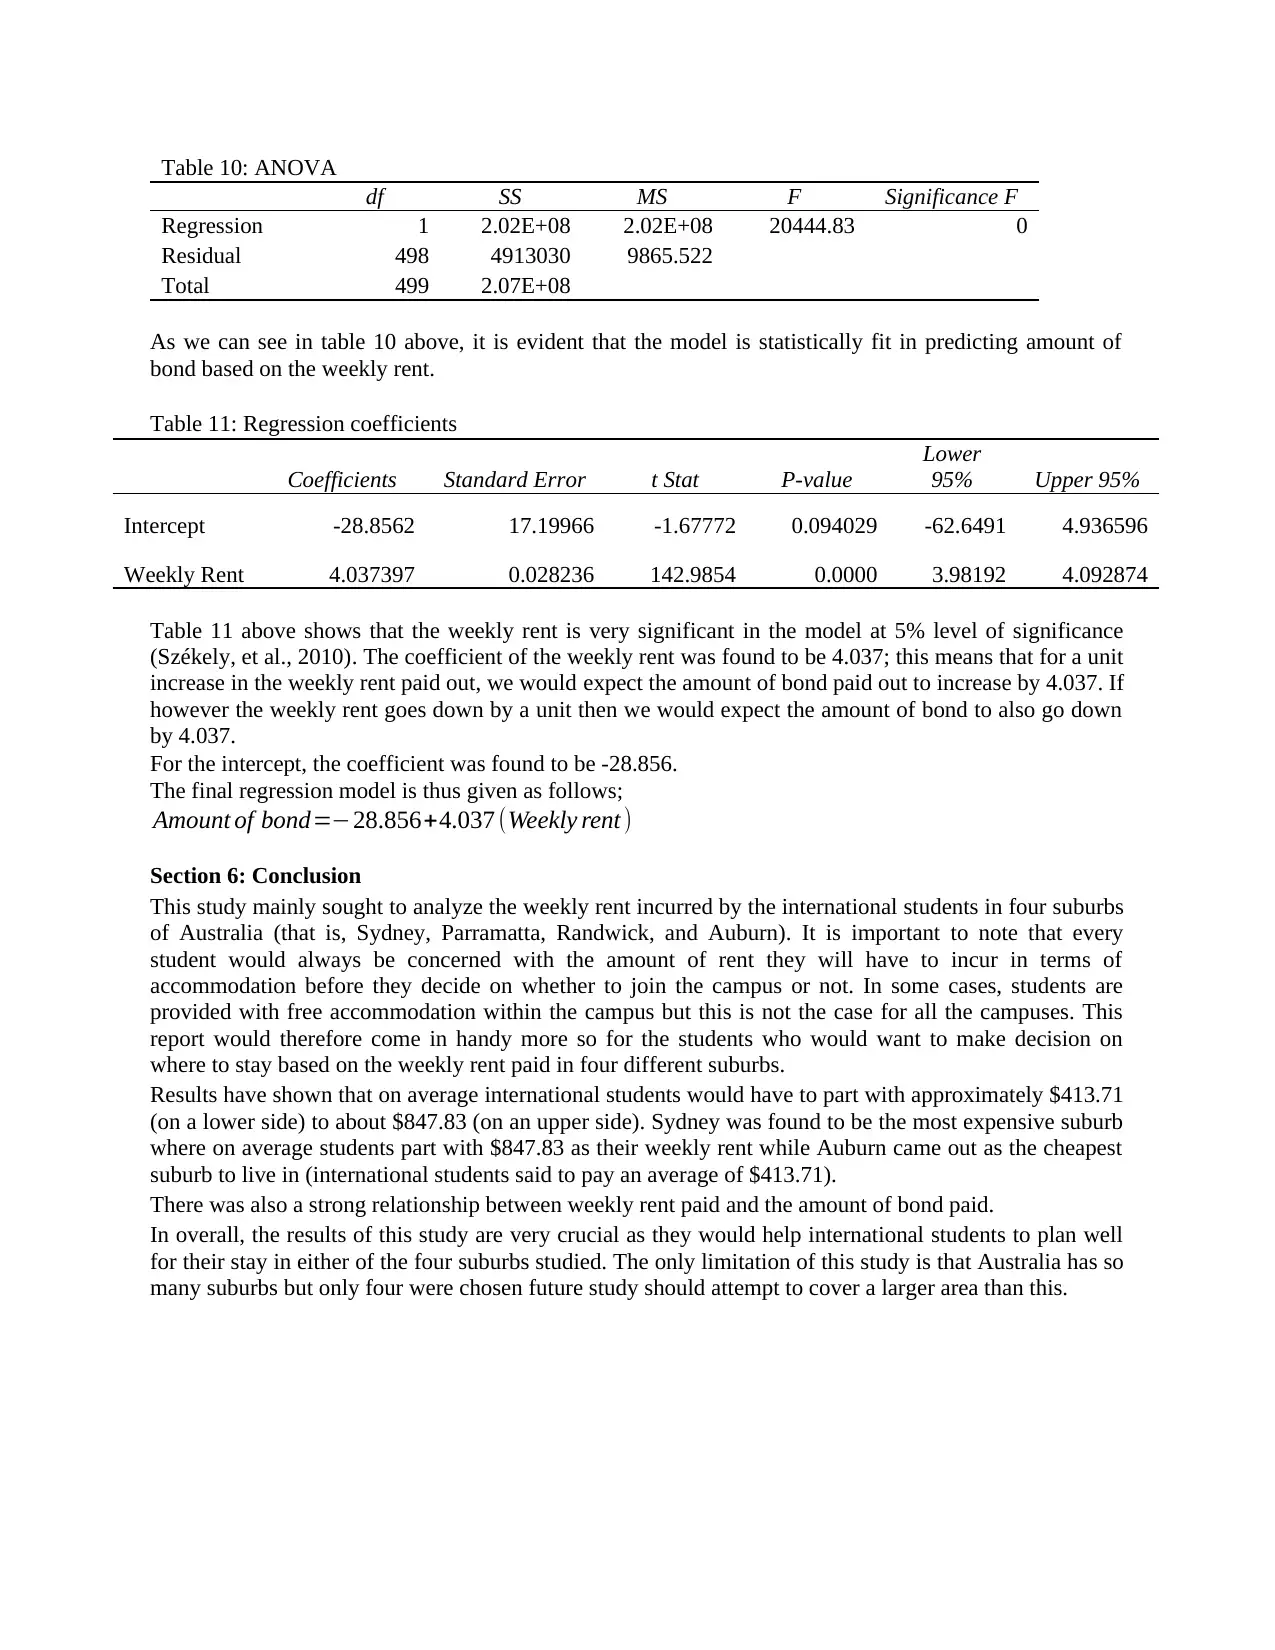
Table 10: ANOVA
df SS MS F Significance F
Regression 1 2.02E+08 2.02E+08 20444.83 0
Residual 498 4913030 9865.522
Total 499 2.07E+08
As we can see in table 10 above, it is evident that the model is statistically fit in predicting amount of
bond based on the weekly rent.
Table 11: Regression coefficients
Coefficients Standard Error t Stat P-value
Lower
95% Upper 95%
Intercept -28.8562 17.19966 -1.67772 0.094029 -62.6491 4.936596
Weekly Rent 4.037397 0.028236 142.9854 0.0000 3.98192 4.092874
Table 11 above shows that the weekly rent is very significant in the model at 5% level of significance
(Székely, et al., 2010). The coefficient of the weekly rent was found to be 4.037; this means that for a unit
increase in the weekly rent paid out, we would expect the amount of bond paid out to increase by 4.037. If
however the weekly rent goes down by a unit then we would expect the amount of bond to also go down
by 4.037.
For the intercept, the coefficient was found to be -28.856.
The final regression model is thus given as follows;
Amount of bond=−28.856+4.037 (Weekly rent )
Section 6: Conclusion
This study mainly sought to analyze the weekly rent incurred by the international students in four suburbs
of Australia (that is, Sydney, Parramatta, Randwick, and Auburn). It is important to note that every
student would always be concerned with the amount of rent they will have to incur in terms of
accommodation before they decide on whether to join the campus or not. In some cases, students are
provided with free accommodation within the campus but this is not the case for all the campuses. This
report would therefore come in handy more so for the students who would want to make decision on
where to stay based on the weekly rent paid in four different suburbs.
Results have shown that on average international students would have to part with approximately $413.71
(on a lower side) to about $847.83 (on an upper side). Sydney was found to be the most expensive suburb
where on average students part with $847.83 as their weekly rent while Auburn came out as the cheapest
suburb to live in (international students said to pay an average of $413.71).
There was also a strong relationship between weekly rent paid and the amount of bond paid.
In overall, the results of this study are very crucial as they would help international students to plan well
for their stay in either of the four suburbs studied. The only limitation of this study is that Australia has so
many suburbs but only four were chosen future study should attempt to cover a larger area than this.
Paraphrase This Document
Need a fresh take? Get an instant paraphrase of this document with our AI Paraphraser
References
Lopez-Paz , D., Hennig , P. & Schölkopf , B., 2013. The Randomized Dependence Coefficient.
Conference on Neural Information Processing Systems.
Nikolić, D., Muresan, R. C., Feng, W. & Singer, W., 2012. Scaled correlation analysis: a better way to
compute a cross-correlogram. European Journal of Neuroscience, p. 1–21.
Székely, G., Rizzo, J. & Bakirov, N. K., 2010. Measuring and testing independence by correlation of
distances. Annals of Statistics, 35(6), p. 2769–2794.
1 out of 8
Related Documents


Your All-in-One AI-Powered Toolkit for Academic Success.
+13062052269
info@desklib.com
Available 24*7 on WhatsApp / Email
![[object Object]](/_next/static/media/star-bottom.7253800d.svg)
Unlock your academic potential
Copyright © 2020–2026 A2Z Services. All Rights Reserved. Developed and managed by ZUCOL.