Applied Research: Analysis of Secondary Student Behaviors in Australia
VerifiedAdded on 2019/11/14
|15
|4567
|440
Report
AI Summary
This report presents the findings of an applied research study on the behaviors of Australian secondary students, focusing on alcohol and drug use, technology usage, and cyberbullying. The research involved a survey of over 2,136 students, incorporating both traditional school-based and online recruitment methods, including Year 11 students for the first time. The study revealed that 60% of the students reported alcohol consumption, with varying frequencies, and that male students reported higher rates of alcohol and drug use compared to female students. The report also examines the prevalence of cyberbullying and the widespread use of technology among students. The methodology included questionnaires, and the results are analyzed by gender and year level. The study provides valuable insights into the challenges and maturity of young people, highlighting the need for continued efforts to address these issues and support students.
Running head: APPLIED RESEARCH 1
Tittle
Name
Instructor’s name
Tittle
Name
Instructor’s name
Paraphrase This Document
Need a fresh take? Get an instant paraphrase of this document with our AI Paraphraser
APPLIED RESEARCH 2
Abstract
With over 2136 Australian secondary students taking part in the 2013 survey, light has
been shed on some of the behaviors among secondary students that have raised concerns to
their parents. Two behaviors which were put into consideration in this report include alcohol
and drug abuse; and the use of technology and cyberbullying. This report uncovers the extent
of these behaviors which continue to be among the biggest challenges facing teenagers,
including their significant impacts. The survey was administered by use of questionnaires, as it
has been done in the previous surveys. However, due to challenges in getting the required
sample size, a new sampling method was introduced. Students could be recruited online
(Recruited Online Survey) alongside the traditional school-based survey. Also, for the first
time Year, 11 students were included in the survey. More female students participated in the
survey (61%) compared to male students (39%). Out of all the students who took the survey,
60% reported they had taken alcohol but the frequency was seen to vary with 10% of the
students taking often. More males drink alcohol (6%) than females (3%). Few students use
drugs majority being male students. Cyberbullying is experienced by a few students through
receiving calls and being left out of things on the internet. It is, however, clear to note that
more students use internet and technology on daily basis. There is still much to be done to help
the secondary students but we cannot ignore the fact that they have shown great maturity in
their decision making.
Keywords: survey, cyberbullying, alcohol, drug use
2
APPLIED RESEARCH 3
Introduction
Due to concerns of how the young people were vulnerable to HIV infection in the 1990s,
the Australian Government Department of Health initiated and funded a national survey of the
sexual health of secondary students in Australia (Kippax, Connell, Dowsett, & Crawford, 1993).
This research has been carried out every five years with the objective of getting a clear picture of
the knowledge and experiences of Australian teenagers on sexual matters. The data collected has
been widely used by various individuals and organizations including parents and policy-makers
over the last couple of years to find ways of educating the young people.
In the recent survey, new questions have been added that examine issues on alcohol and
drug use; and the use of technology and cyberbullying. The addition of the topics was after
parents raising concerns of their children experiencing cyberbullying or using drugs. According
to Telstra’s Schoolyard to Screen study, 40% of parents in Australia ranked cyberbullying among
their biggest worries while 9% of parents were worried that their child would consume alcohol or
take drugs. Jackie Coates, head of the Telstra Foundation said during the launch of PROJECT
ROCKIT, "Our research found that parents want more help dealing with these issues, with two in
three (68%) saying more help is needed to educate and empower young people about
cyberbullying." (Star, 2017). This clearly shows the need to conduct a survey that would include
alcohol and drug use; and the use of technology and cyberbullying.
It is important to note that these surveys generate valuable information about the young
secondary students including their knowledge on matters concerning their health and daily
experiences. However, the release of each report of the surveys to the public gives negative
3
⊘ This is a preview!⊘
Do you want full access?
Subscribe today to unlock all pages.
Trusted by 1+ million students worldwide
APPLIED RESEARCH 4
perceptions of the secondary students and it is therefore important not only to look at the
negative side of the information but also consider the good side of young students.
Method
The 2013 survey had a similar methodology to the previously used methodologies only
with the addition of some sections in the questionnaire (section E and F that included questions
on alcohol cigarette and marijuana use and internet, technology and social media respectively.)
With the increase in the use of technology in education, it was also prudent to introduce an
online format of the questionnaire alongside the traditional pen-and-paper version (Garrison &
Anderson, 2003).
The reduced response rate experienced in the previous survey proved that getting the
appropriate sample size had been difficult to achieve. Therefore, an alternative approach was
used in the 2013 survey to increase the sample size.
First, the schools that were randomly selected from all school types in all states and
territories of Australia in the 2008 study were approached again to participate in the 2013 survey
(704 schools). Letters were sent to the principals of the schools and 62 principals agreed to
participate in the study. A list of other 33 schools was created and principals sent information
about the study. In general, out of the 95 school principals who received documentation about
their consent, only 41 principals signed back the consent sheets agreeing to take part in the study
whereas 15 principals withdrew after being given consent.
The second approach was to invite all Year 10, Year 11 and Year 12 (both male and
female) students to take part in the exercise. Previously, only Year 10 and Year 12 students were
randomly selected from all classes and if the class size was less than 20, a class at that year level
4
Paraphrase This Document
Need a fresh take? Get an instant paraphrase of this document with our AI Paraphraser
APPLIED RESEARCH 5
randomly selected, was added. The approach of including Year 11 students in the study was due
to the challenges experienced in obtaining the necessary sample size.
In August of 2013, it was decided to recruit more Australian secondary students in Years
10 to 12 to ensure the survey had many potential participants. The students were to be recruited
through Recruited Online Survey (ROS) that was independent of school recruitment. An
advertisement for recruitment of potential participants was posted on various platforms in which
the participant would be re-directed to the survey website. The website used in the 2013 study
was whatsitlike.org.au. The student was supposed to provide information on the name and
postcode of the school, type of school, state or territory of their school and if the school is mixed-
sex or single-sex.
The use of multiple recruitment strategies and data collection methodologies enables the
study to have a broader representation of Australian secondary students and a wide range of
participants.
Results
The data collected in the 2013 study was analyzed by gender. Besides the usual ‘male’
and ‘female’, students were given the option of ‘other’, for the first time. However, the 23
students who chose ‘other’ were included in the sample. This was due to the low-class size. Of
the 2,136 students included in the final sample, 1,361 students (63.7%) completed the school-
based survey and 775 students (36.3%) completed the online school's based survey.
Table 1.1: The sample size and the rate of participation in each state
State School-based survey Recruited online survey Total sample
Number of Sample size Number of Sample size
5
APPLIED RESEARCH 6
schools schools size
ACT 1 52 9 20 72
NSW 5 245 124 181 426
NT 1 58 3 4 62
QLD 3 51 59 102 153
SA 2 98 48 126 224
TAS 1 24 19 34 58
VIC 8 558 122 259 817
WA 5 272 31 47 319
Unknown - 3 2 5
Total 26 1361 415 775 2136
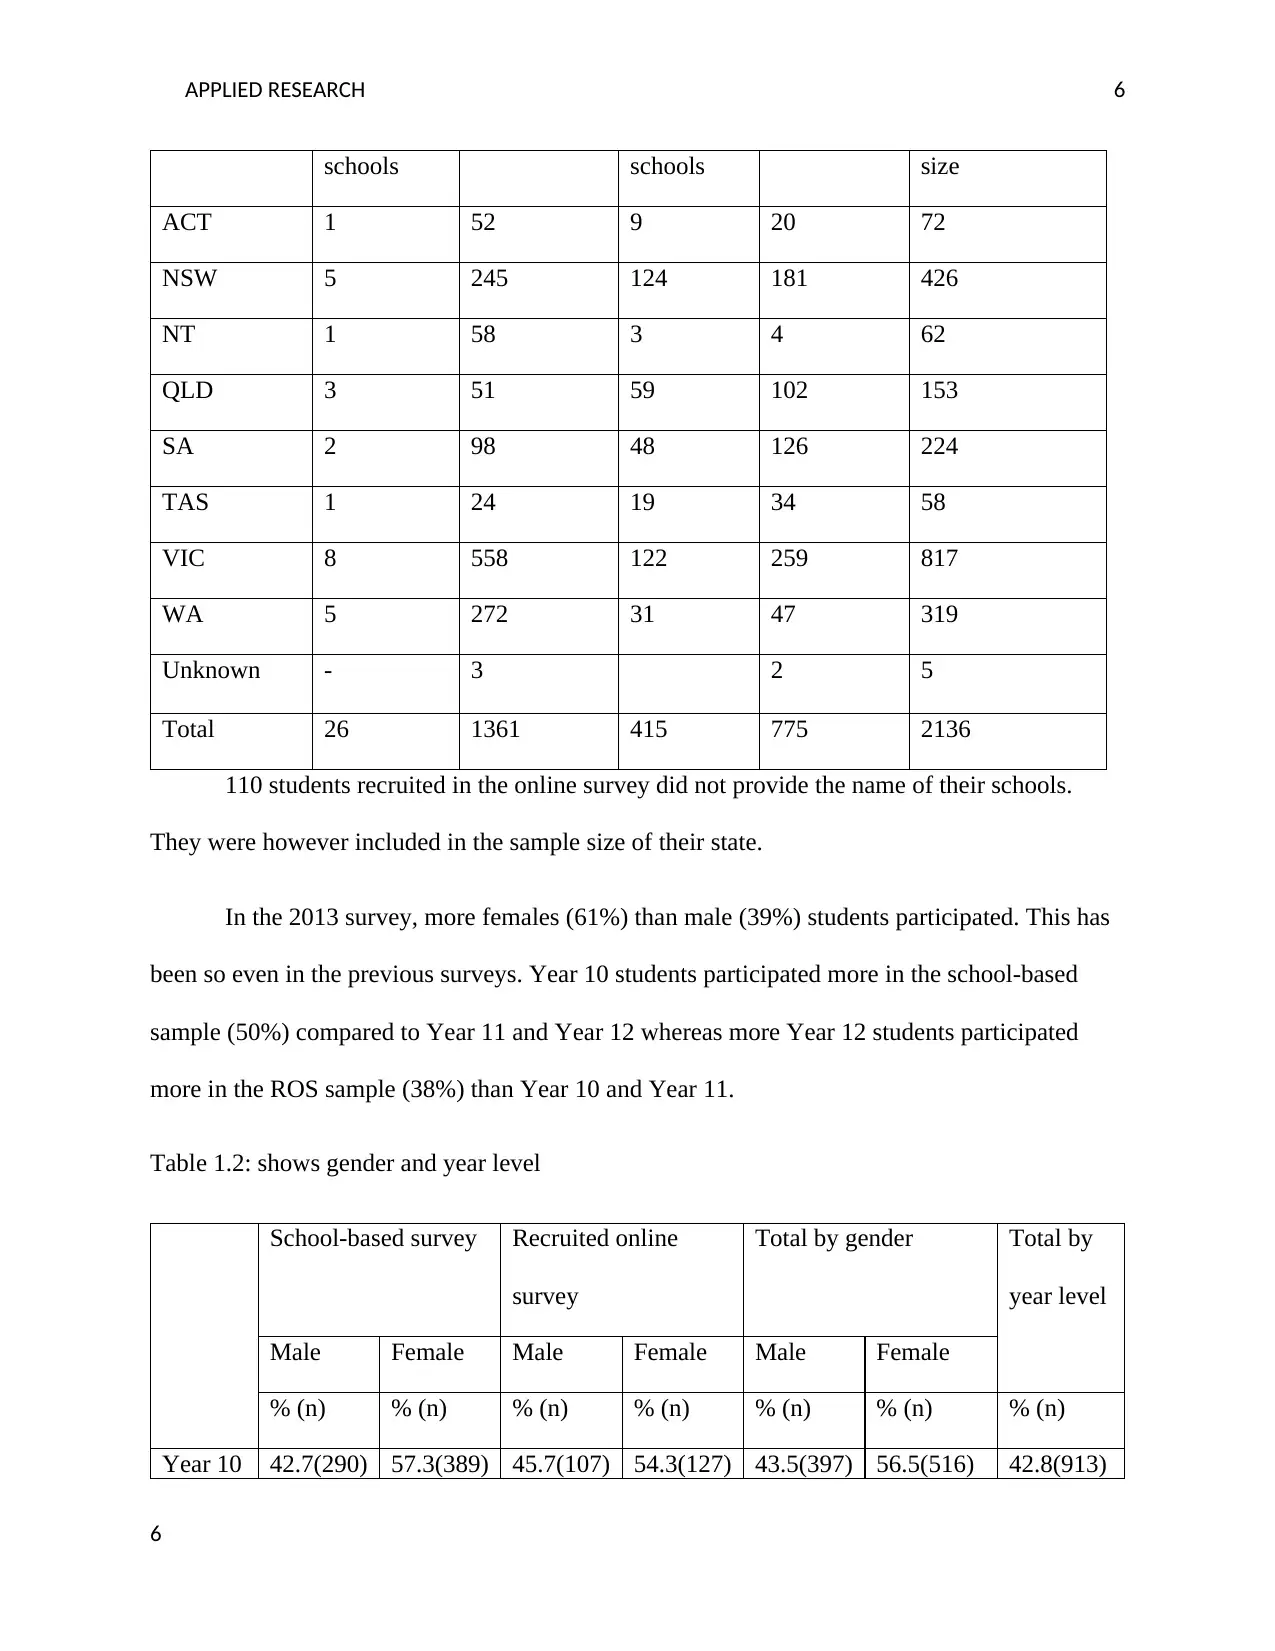
110 students recruited in the online survey did not provide the name of their schools.
They were however included in the sample size of their state.
In the 2013 survey, more females (61%) than male (39%) students participated. This has
been so even in the previous surveys. Year 10 students participated more in the school-based
sample (50%) compared to Year 11 and Year 12 whereas more Year 12 students participated
more in the ROS sample (38%) than Year 10 and Year 11.
Table 1.2: shows gender and year level
School-based survey Recruited online
survey
Total by gender Total by
year level
Male Female Male Female Male Female
% (n) % (n) % (n) % (n) % (n) % (n) % (n)
Year 10 42.7(290) 57.3(389) 45.7(107) 54.3(127) 43.5(397) 56.5(516) 42.8(913)
6
schools schools size
ACT 1 52 9 20 72
NSW 5 245 124 181 426
NT 1 58 3 4 62
QLD 3 51 59 102 153
SA 2 98 48 126 224
TAS 1 24 19 34 58
VIC 8 558 122 259 817
WA 5 272 31 47 319
Unknown - 3 2 5
Total 26 1361 415 775 2136
110 students recruited in the online survey did not provide the name of their schools.
They were however included in the sample size of their state.
In the 2013 survey, more females (61%) than male (39%) students participated. This has
been so even in the previous surveys. Year 10 students participated more in the school-based
sample (50%) compared to Year 11 and Year 12 whereas more Year 12 students participated
more in the ROS sample (38%) than Year 10 and Year 11.
Table 1.2: shows gender and year level
School-based survey Recruited online
survey
Total by gender Total by
year level
Male Female Male Female Male Female
% (n) % (n) % (n) % (n) % (n) % (n) % (n)
Year 10 42.7(290) 57.3(389) 45.7(107) 54.3(127) 43.5(397) 56.5(516) 42.8(913)
6
⊘ This is a preview!⊘
Do you want full access?
Subscribe today to unlock all pages.
Trusted by 1+ million students worldwide
APPLIED RESEARCH 7
Year 11 34.1(133) 65.9(257) 30.2(75) 69.8(173) 32.6(208) 67.4(430) 29.9(638)
Year 12 43.3(125) 56.7(164) 32.3(94) 67.7(197) 37.8(219) 62.2(361) 27.2(580)
Total 40.4(550) 59.6(811) 35.7(277) 64.3(498) 38.7(827) 61.3(1309
)
100(2136)
Year 10 Year 11 Year 12
0
100
200
300
400
500
600
397
208 219
516
430
361
Participation by gender and year level
Male Female
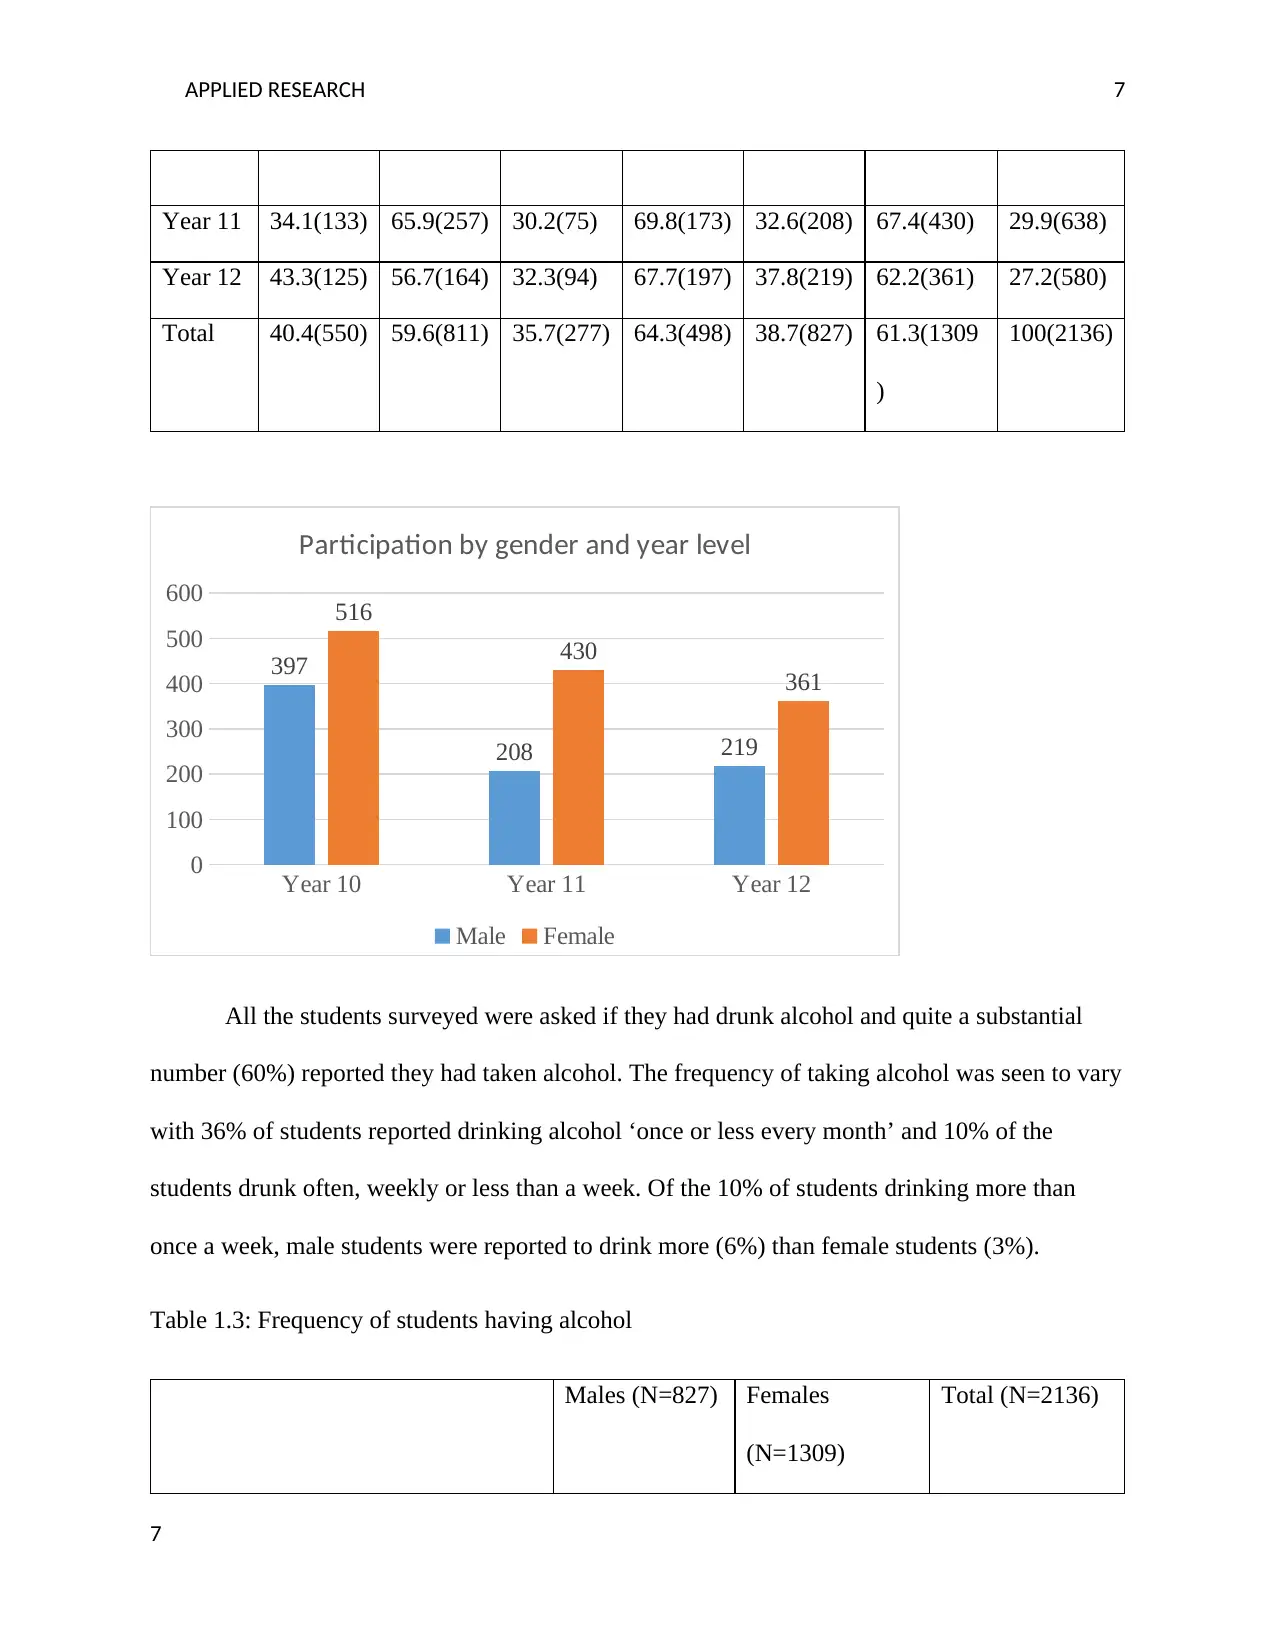
All the students surveyed were asked if they had drunk alcohol and quite a substantial
number (60%) reported they had taken alcohol. The frequency of taking alcohol was seen to vary
with 36% of students reported drinking alcohol ‘once or less every month’ and 10% of the
students drunk often, weekly or less than a week. Of the 10% of students drinking more than
once a week, male students were reported to drink more (6%) than female students (3%).
Table 1.3: Frequency of students having alcohol
Males (N=827) Females
(N=1309)
Total (N=2136)
7
Year 11 34.1(133) 65.9(257) 30.2(75) 69.8(173) 32.6(208) 67.4(430) 29.9(638)
Year 12 43.3(125) 56.7(164) 32.3(94) 67.7(197) 37.8(219) 62.2(361) 27.2(580)
Total 40.4(550) 59.6(811) 35.7(277) 64.3(498) 38.7(827) 61.3(1309
)
100(2136)
Year 10 Year 11 Year 12
0
100
200
300
400
500
600
397
208 219
516
430
361
Participation by gender and year level
Male Female
All the students surveyed were asked if they had drunk alcohol and quite a substantial
number (60%) reported they had taken alcohol. The frequency of taking alcohol was seen to vary
with 36% of students reported drinking alcohol ‘once or less every month’ and 10% of the
students drunk often, weekly or less than a week. Of the 10% of students drinking more than
once a week, male students were reported to drink more (6%) than female students (3%).
Table 1.3: Frequency of students having alcohol
Males (N=827) Females
(N=1309)
Total (N=2136)
7
Paraphrase This Document
Need a fresh take? Get an instant paraphrase of this document with our AI Paraphraser
APPLIED RESEARCH 8
% (n) % (n) % (n)
Year 10 Never drink alcohol 46.4 (181/390) 50.4 (258/512) 48.7 (439/902)
Once a month or less 31.0 (121/390) 31.5 (161/512) 31.3 (282/902)
2-3 days a month 12.1 (47/390) 12,1 (62/512) 12.1 (109/902)
About 1 days a week 4.1 (16/390) 4.3 (22/512) 4.2 (38/902)
More than once a week 6.4 (25/390) 1.8 (9/512) 3.8 (34/902)
Year 11 Never drink alcohol 41.1 (83/202) 44.2 (187/423) 43.2 (270/625)
Once a month or less 35.6 (72/202) 37.4 (158/423) 36.8 (230/625)
2-3 days a month 11.4 (23/202) 12.1 (51/423) 11.8 (74/625)
About 1 day a week 5.0 (10/202) 3.8 (16/423) 4.2 (26/625)
More than once a week 6.9 (14/202) 2.6 (11/423) 4.0 (25/625)
Year 12 Never drink alcohol 19.0 (41/216) 26.6 (96/361) 23.7 (137/577)
Once a month or less 44.9 (97/216) 39.3 (142/361) 41.4 (239/577)
2-3 days a month 18.5 (40/216) 20.8 (75/361) 19.9 (115/577)
About 1 day a week 12.0 (26/216) 10.0 (36/361) 10.8 (62/577)
More than once a week 5.6 (12/216) 3.3 (12/361) 4.2 (24/577)
Total Never drink alcohol 37.9 (307/811) 41.7 (541/1298) 40.2 (848/2109)
Once a month or less 35.8 (290/811) 35.6 (462/1298) 35.7 (752/2109)
2-3 days a month 13.6 (110/811) 14.6 (189/1298) 14.2 (299/2109)
About 1 day a week 6.4 (52/811) 5.7 (74/1298) 6.0 (126/2109)
More than once a week 6.4 (52/811) 2.5 (32/1298) 4.0 (84/2109)
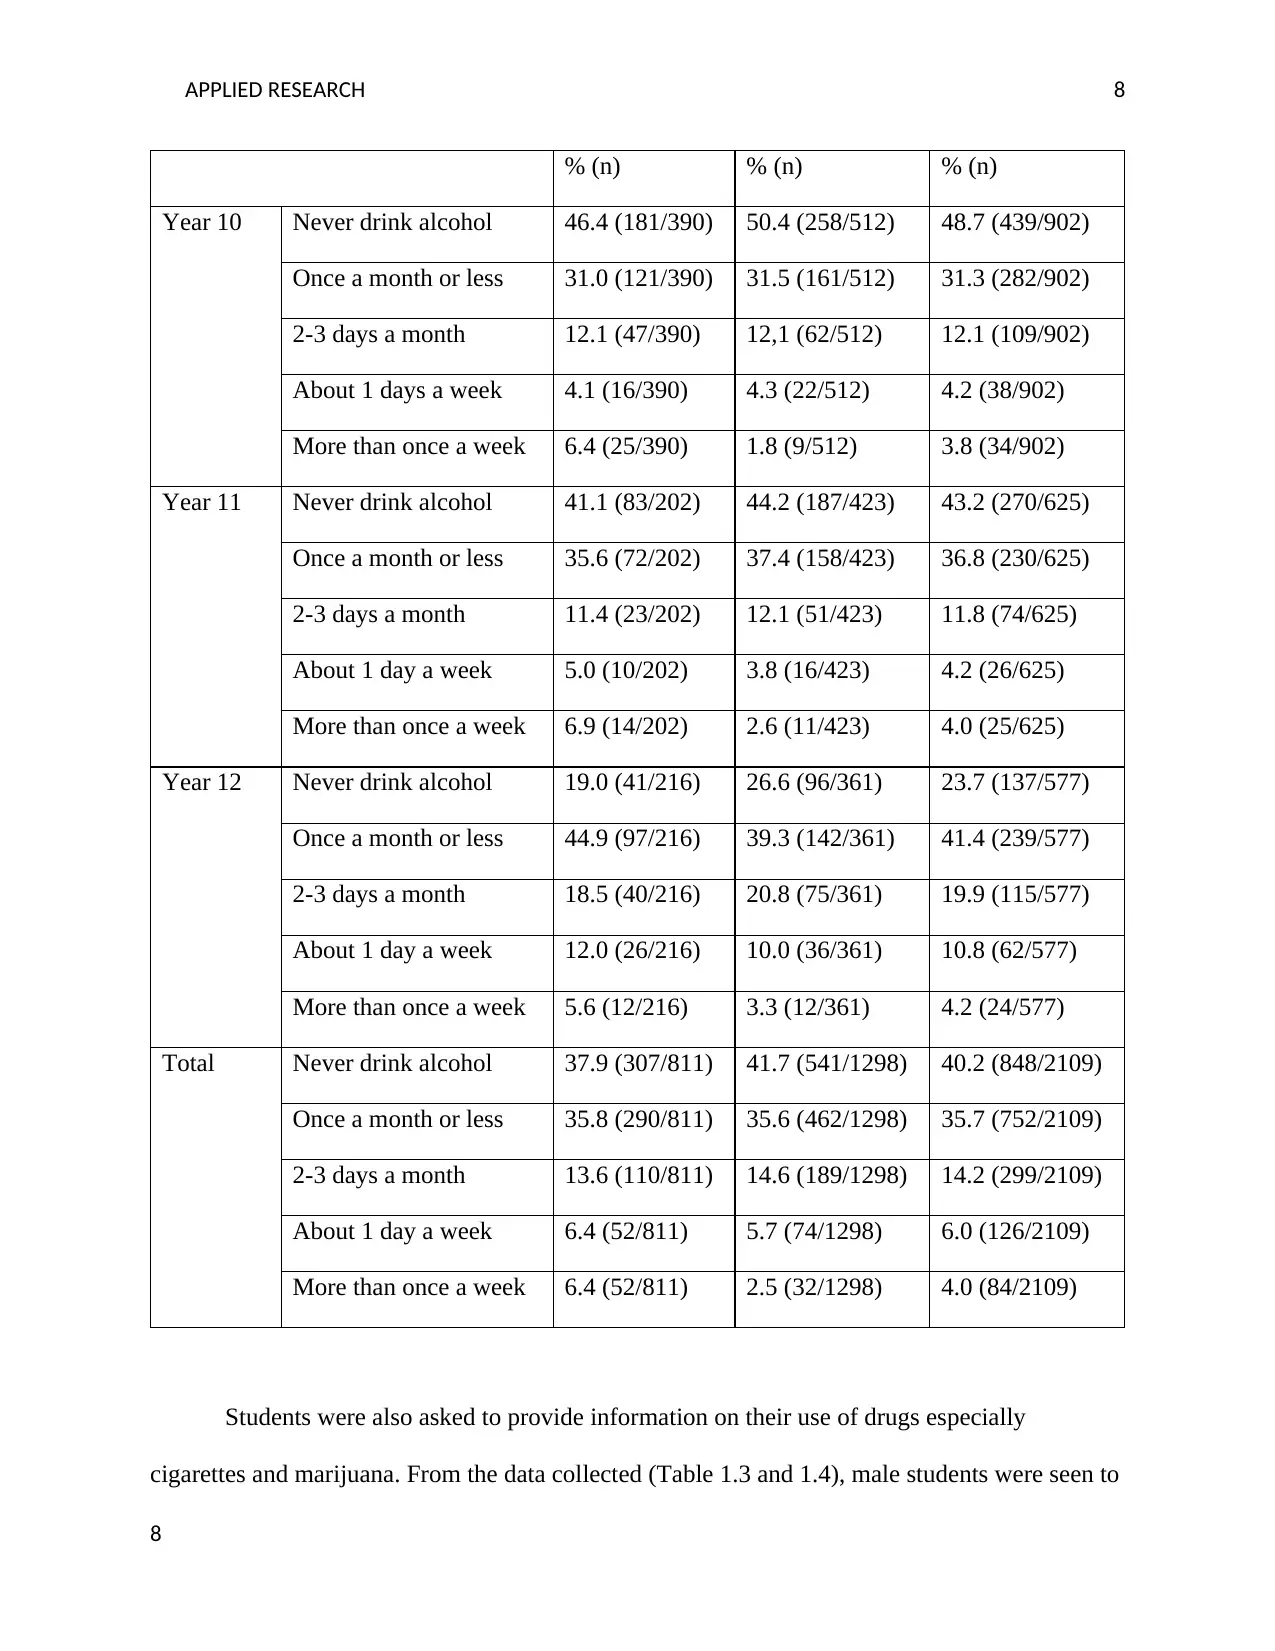
Students were also asked to provide information on their use of drugs especially
cigarettes and marijuana. From the data collected (Table 1.3 and 1.4), male students were seen to
8
% (n) % (n) % (n)
Year 10 Never drink alcohol 46.4 (181/390) 50.4 (258/512) 48.7 (439/902)
Once a month or less 31.0 (121/390) 31.5 (161/512) 31.3 (282/902)
2-3 days a month 12.1 (47/390) 12,1 (62/512) 12.1 (109/902)
About 1 days a week 4.1 (16/390) 4.3 (22/512) 4.2 (38/902)
More than once a week 6.4 (25/390) 1.8 (9/512) 3.8 (34/902)
Year 11 Never drink alcohol 41.1 (83/202) 44.2 (187/423) 43.2 (270/625)
Once a month or less 35.6 (72/202) 37.4 (158/423) 36.8 (230/625)
2-3 days a month 11.4 (23/202) 12.1 (51/423) 11.8 (74/625)
About 1 day a week 5.0 (10/202) 3.8 (16/423) 4.2 (26/625)
More than once a week 6.9 (14/202) 2.6 (11/423) 4.0 (25/625)
Year 12 Never drink alcohol 19.0 (41/216) 26.6 (96/361) 23.7 (137/577)
Once a month or less 44.9 (97/216) 39.3 (142/361) 41.4 (239/577)
2-3 days a month 18.5 (40/216) 20.8 (75/361) 19.9 (115/577)
About 1 day a week 12.0 (26/216) 10.0 (36/361) 10.8 (62/577)
More than once a week 5.6 (12/216) 3.3 (12/361) 4.2 (24/577)
Total Never drink alcohol 37.9 (307/811) 41.7 (541/1298) 40.2 (848/2109)
Once a month or less 35.8 (290/811) 35.6 (462/1298) 35.7 (752/2109)
2-3 days a month 13.6 (110/811) 14.6 (189/1298) 14.2 (299/2109)
About 1 day a week 6.4 (52/811) 5.7 (74/1298) 6.0 (126/2109)
More than once a week 6.4 (52/811) 2.5 (32/1298) 4.0 (84/2109)
Students were also asked to provide information on their use of drugs especially
cigarettes and marijuana. From the data collected (Table 1.3 and 1.4), male students were seen to
8
APPLIED RESEARCH 9
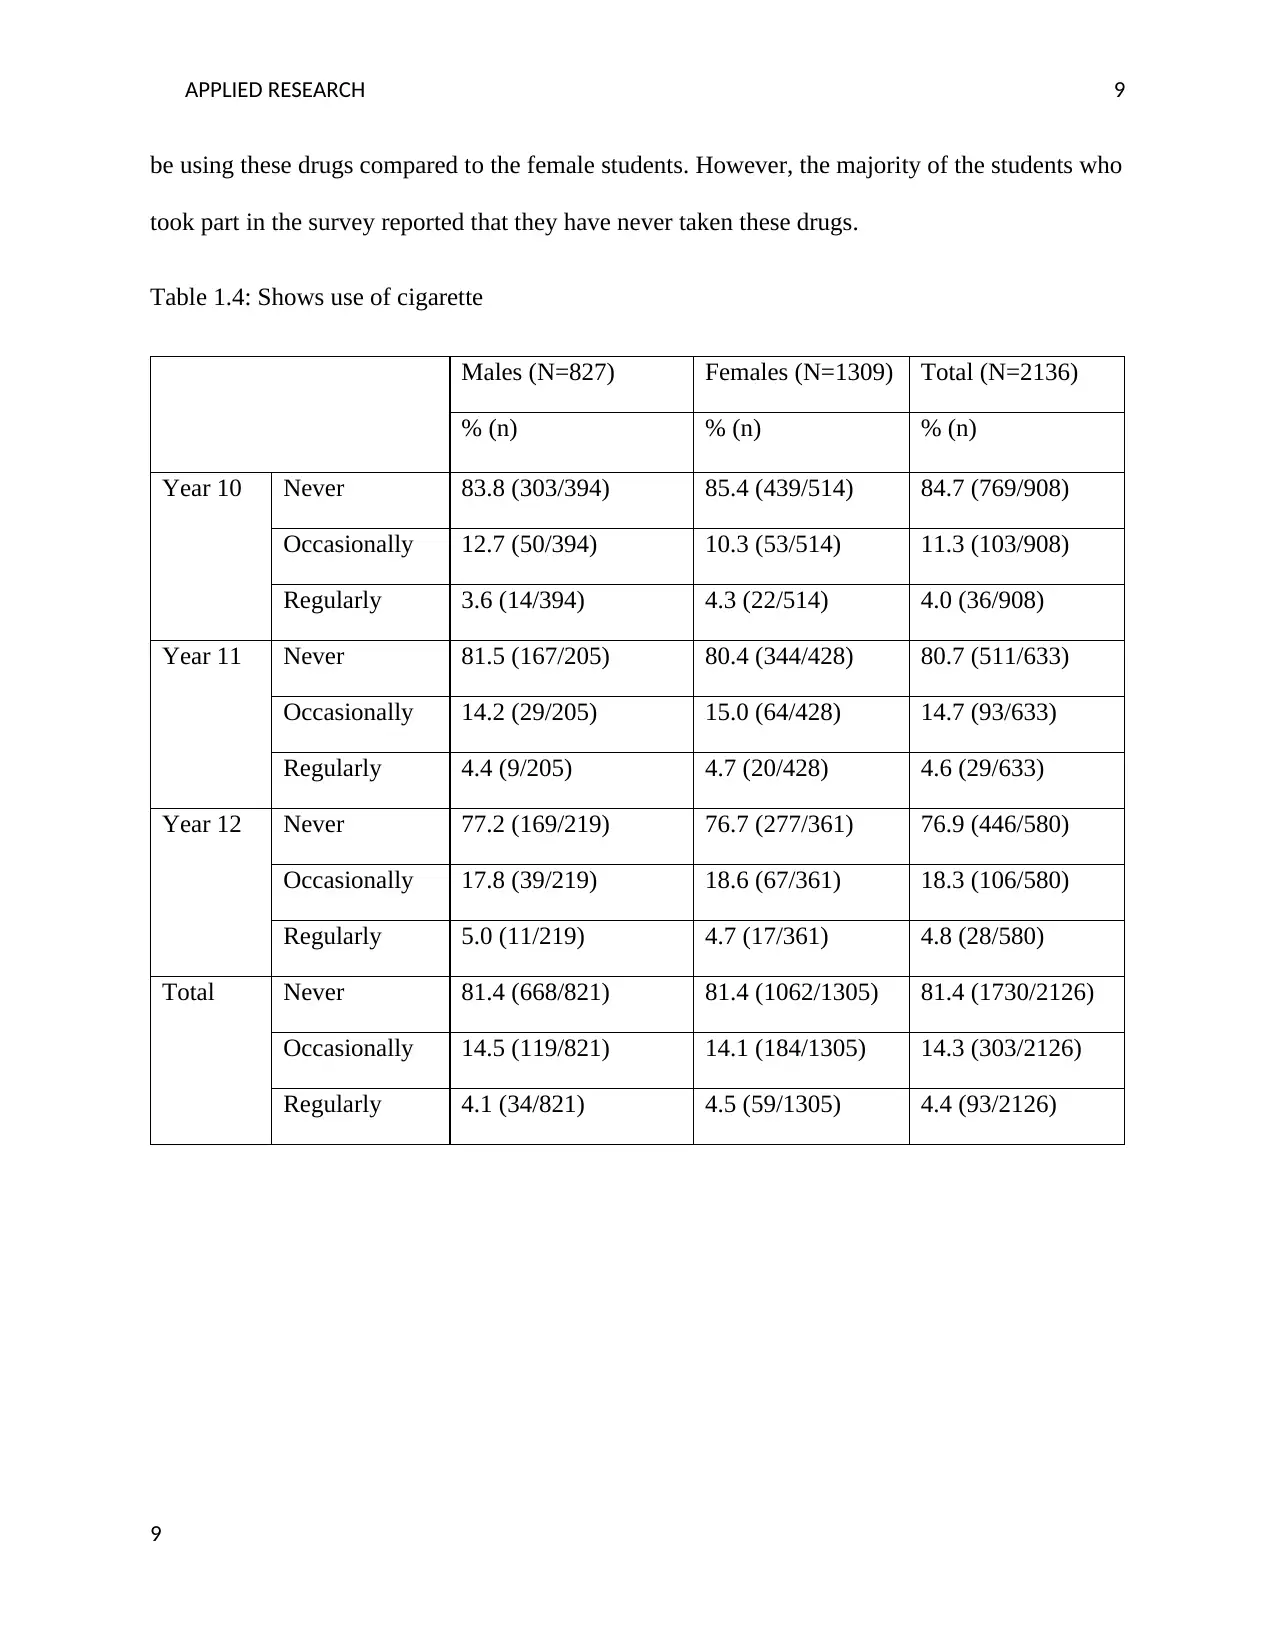
be using these drugs compared to the female students. However, the majority of the students who
took part in the survey reported that they have never taken these drugs.
Table 1.4: Shows use of cigarette
Males (N=827) Females (N=1309) Total (N=2136)
% (n) % (n) % (n)
Year 10 Never 83.8 (303/394) 85.4 (439/514) 84.7 (769/908)
Occasionally 12.7 (50/394) 10.3 (53/514) 11.3 (103/908)
Regularly 3.6 (14/394) 4.3 (22/514) 4.0 (36/908)
Year 11 Never 81.5 (167/205) 80.4 (344/428) 80.7 (511/633)
Occasionally 14.2 (29/205) 15.0 (64/428) 14.7 (93/633)
Regularly 4.4 (9/205) 4.7 (20/428) 4.6 (29/633)
Year 12 Never 77.2 (169/219) 76.7 (277/361) 76.9 (446/580)
Occasionally 17.8 (39/219) 18.6 (67/361) 18.3 (106/580)
Regularly 5.0 (11/219) 4.7 (17/361) 4.8 (28/580)
Total Never 81.4 (668/821) 81.4 (1062/1305) 81.4 (1730/2126)
Occasionally 14.5 (119/821) 14.1 (184/1305) 14.3 (303/2126)
Regularly 4.1 (34/821) 4.5 (59/1305) 4.4 (93/2126)
9
⊘ This is a preview!⊘
Do you want full access?
Subscribe today to unlock all pages.
Trusted by 1+ million students worldwide
APPLIED RESEARCH 10
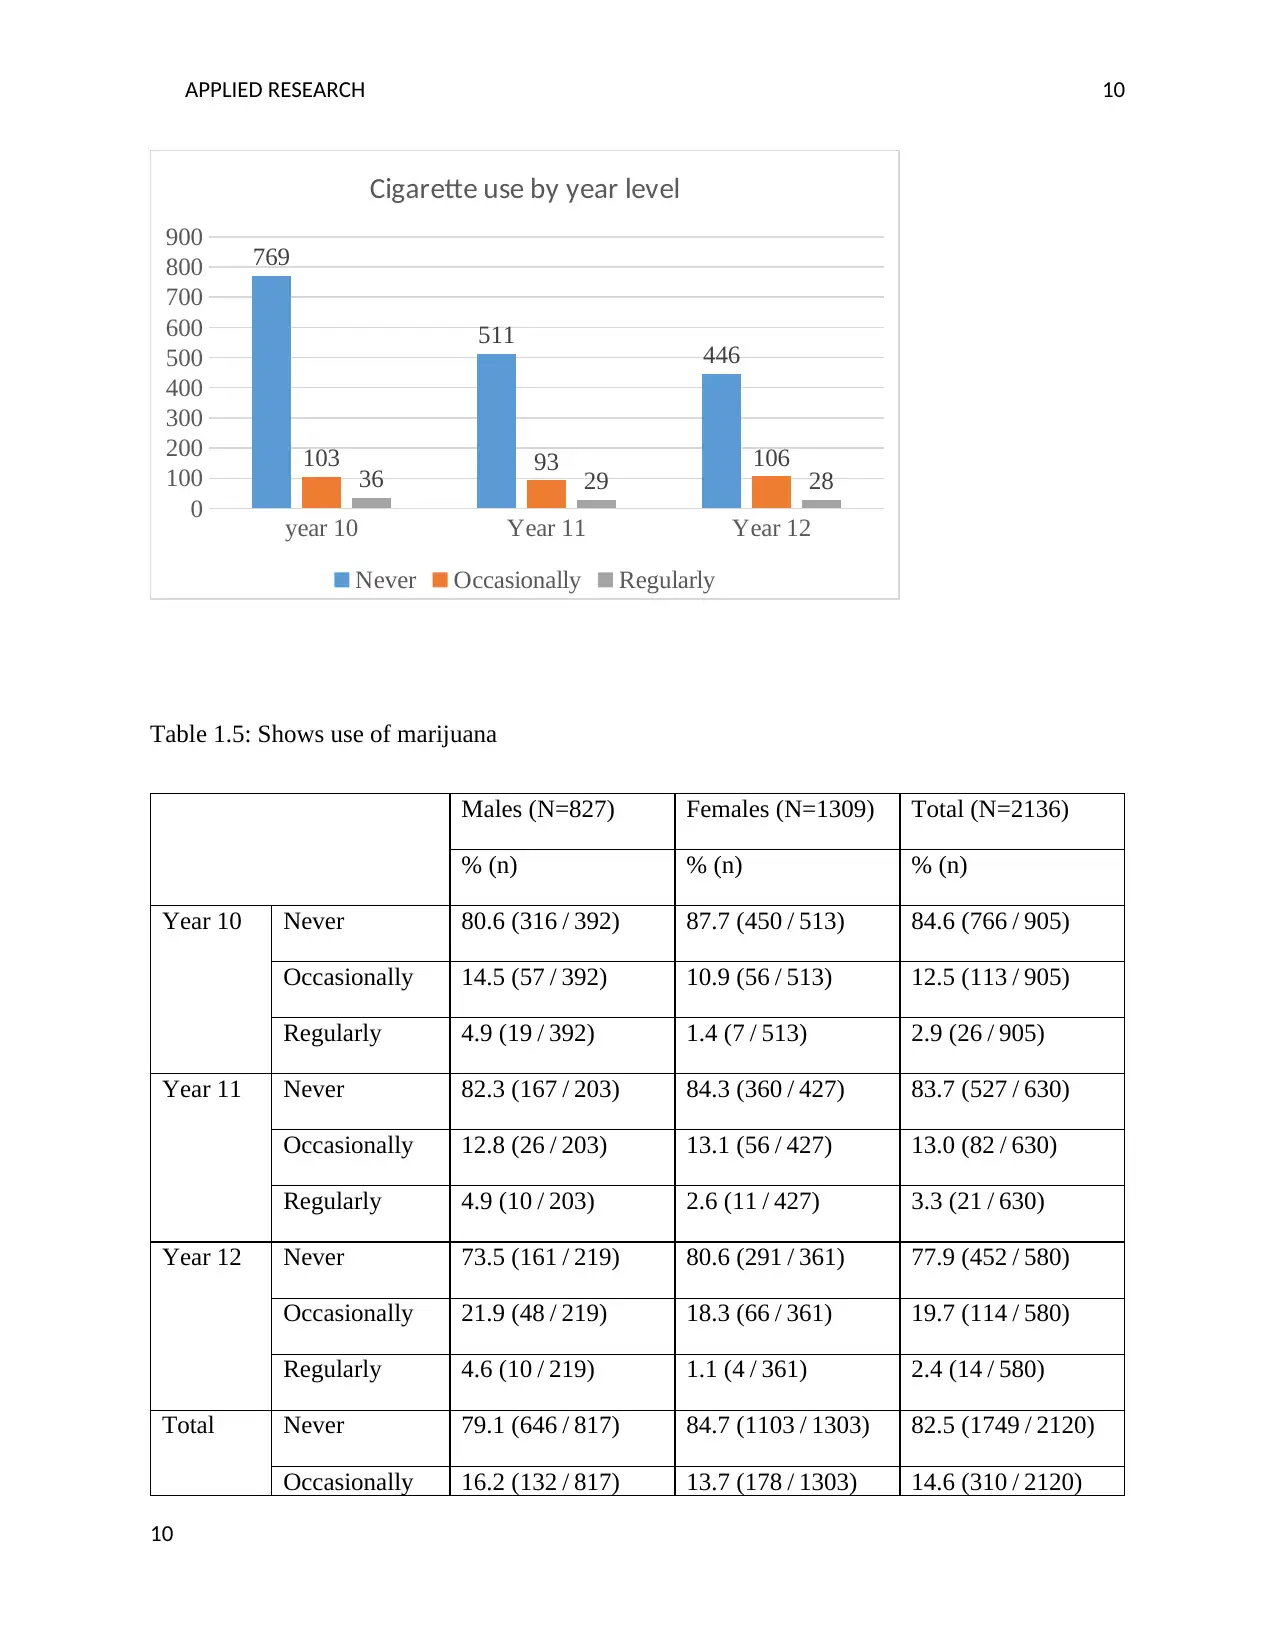
year 10 Year 11 Year 12
0
100
200
300
400
500
600
700
800
900 769
511 446
103 93 106
36 29 28
Cigarette use by year level
Never Occasionally Regularly
Table 1.5: Shows use of marijuana
Males (N=827) Females (N=1309) Total (N=2136)
% (n) % (n) % (n)
Year 10 Never 80.6 (316 / 392) 87.7 (450 / 513) 84.6 (766 / 905)
Occasionally 14.5 (57 / 392) 10.9 (56 / 513) 12.5 (113 / 905)
Regularly 4.9 (19 / 392) 1.4 (7 / 513) 2.9 (26 / 905)
Year 11 Never 82.3 (167 / 203) 84.3 (360 / 427) 83.7 (527 / 630)
Occasionally 12.8 (26 / 203) 13.1 (56 / 427) 13.0 (82 / 630)
Regularly 4.9 (10 / 203) 2.6 (11 / 427) 3.3 (21 / 630)
Year 12 Never 73.5 (161 / 219) 80.6 (291 / 361) 77.9 (452 / 580)
Occasionally 21.9 (48 / 219) 18.3 (66 / 361) 19.7 (114 / 580)
Regularly 4.6 (10 / 219) 1.1 (4 / 361) 2.4 (14 / 580)
Total Never 79.1 (646 / 817) 84.7 (1103 / 1303) 82.5 (1749 / 2120)
Occasionally 16.2 (132 / 817) 13.7 (178 / 1303) 14.6 (310 / 2120)
10
Paraphrase This Document
Need a fresh take? Get an instant paraphrase of this document with our AI Paraphraser
APPLIED RESEARCH 11
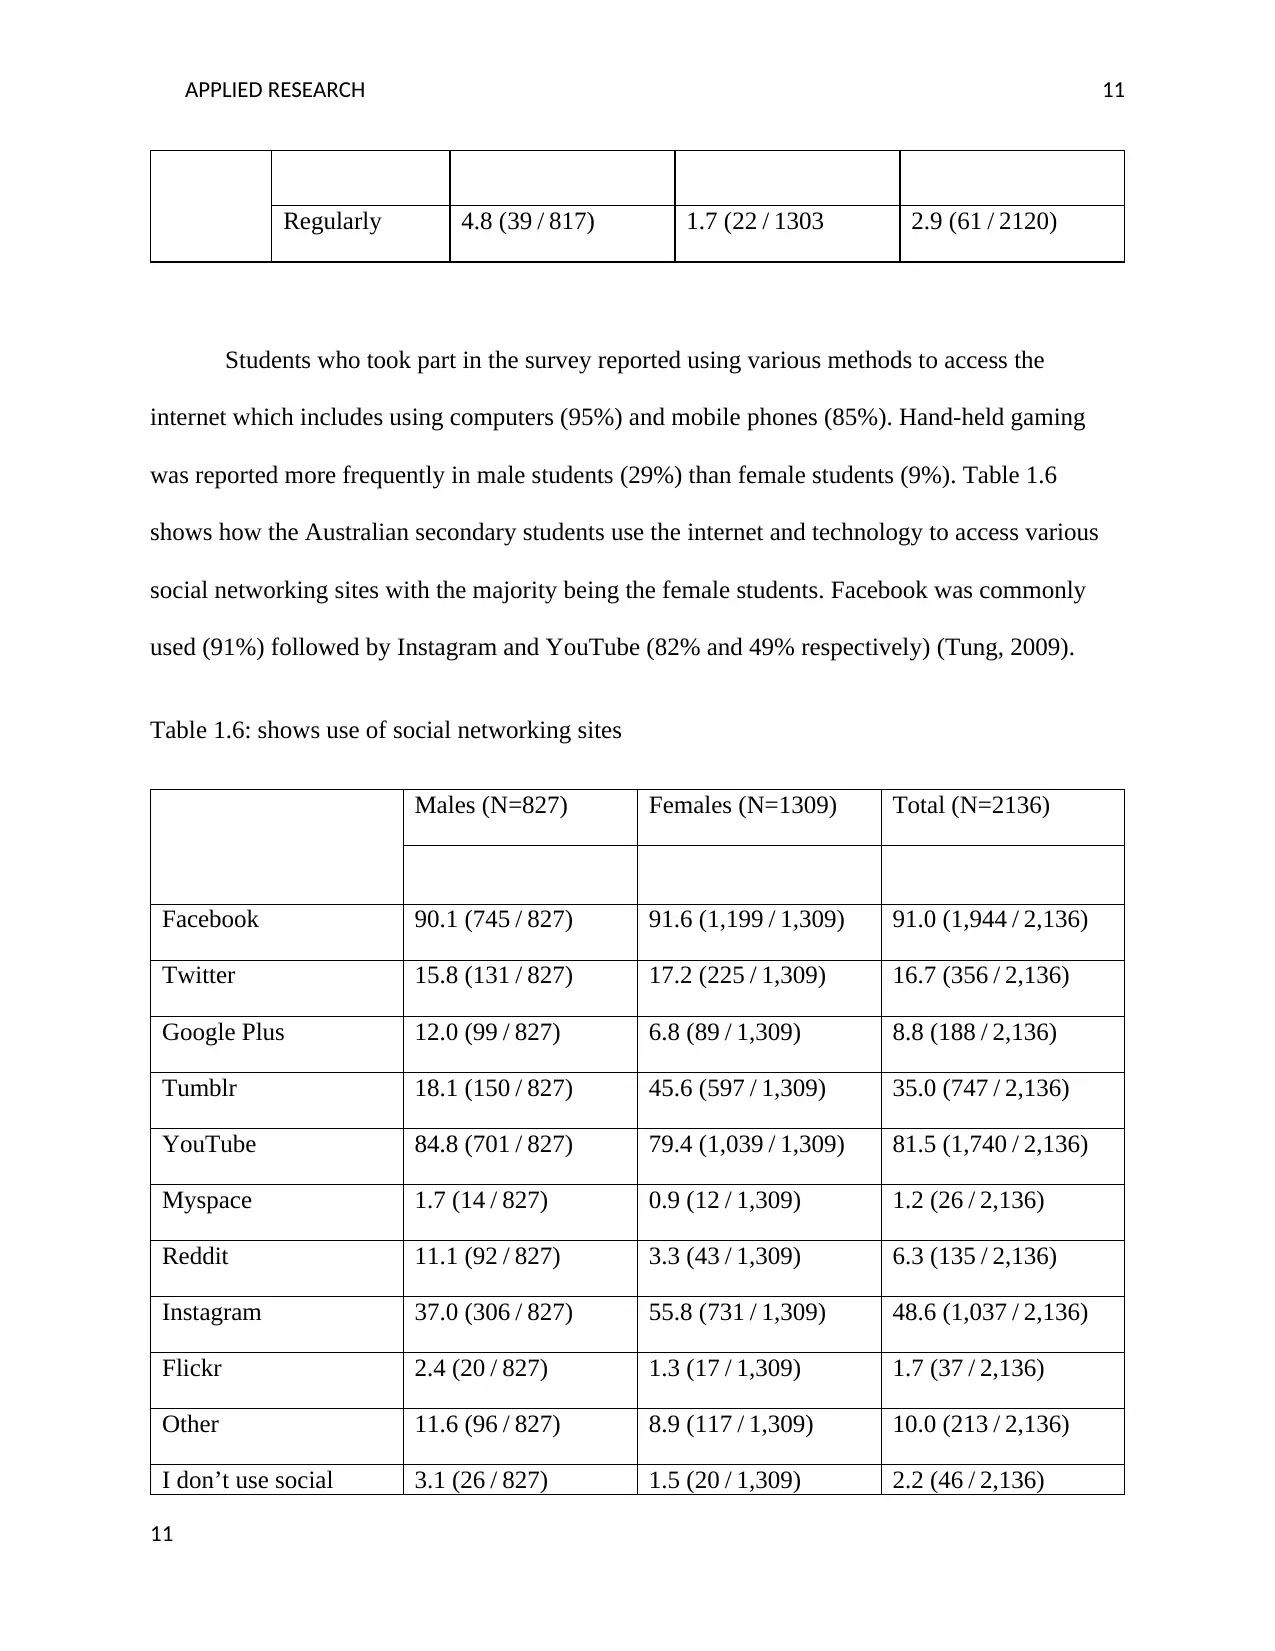
Regularly 4.8 (39 / 817) 1.7 (22 / 1303 2.9 (61 / 2120)
Students who took part in the survey reported using various methods to access the
internet which includes using computers (95%) and mobile phones (85%). Hand-held gaming
was reported more frequently in male students (29%) than female students (9%). Table 1.6
shows how the Australian secondary students use the internet and technology to access various
social networking sites with the majority being the female students. Facebook was commonly
used (91%) followed by Instagram and YouTube (82% and 49% respectively) (Tung, 2009).
Table 1.6: shows use of social networking sites
Males (N=827) Females (N=1309) Total (N=2136)
%
Facebook 90.1 (745 / 827) 91.6 (1,199 / 1,309) 91.0 (1,944 / 2,136)
Twitter 15.8 (131 / 827) 17.2 (225 / 1,309) 16.7 (356 / 2,136)
Google Plus 12.0 (99 / 827) 6.8 (89 / 1,309) 8.8 (188 / 2,136)
Tumblr 18.1 (150 / 827) 45.6 (597 / 1,309) 35.0 (747 / 2,136)
YouTube 84.8 (701 / 827) 79.4 (1,039 / 1,309) 81.5 (1,740 / 2,136)
Myspace 1.7 (14 / 827) 0.9 (12 / 1,309) 1.2 (26 / 2,136)
Reddit 11.1 (92 / 827) 3.3 (43 / 1,309) 6.3 (135 / 2,136)
Instagram 37.0 (306 / 827) 55.8 (731 / 1,309) 48.6 (1,037 / 2,136)
Flickr 2.4 (20 / 827) 1.3 (17 / 1,309) 1.7 (37 / 2,136)
Other 11.6 (96 / 827) 8.9 (117 / 1,309) 10.0 (213 / 2,136)
I don’t use social 3.1 (26 / 827) 1.5 (20 / 1,309) 2.2 (46 / 2,136)
11
APPLIED RESEARCH 12
networking
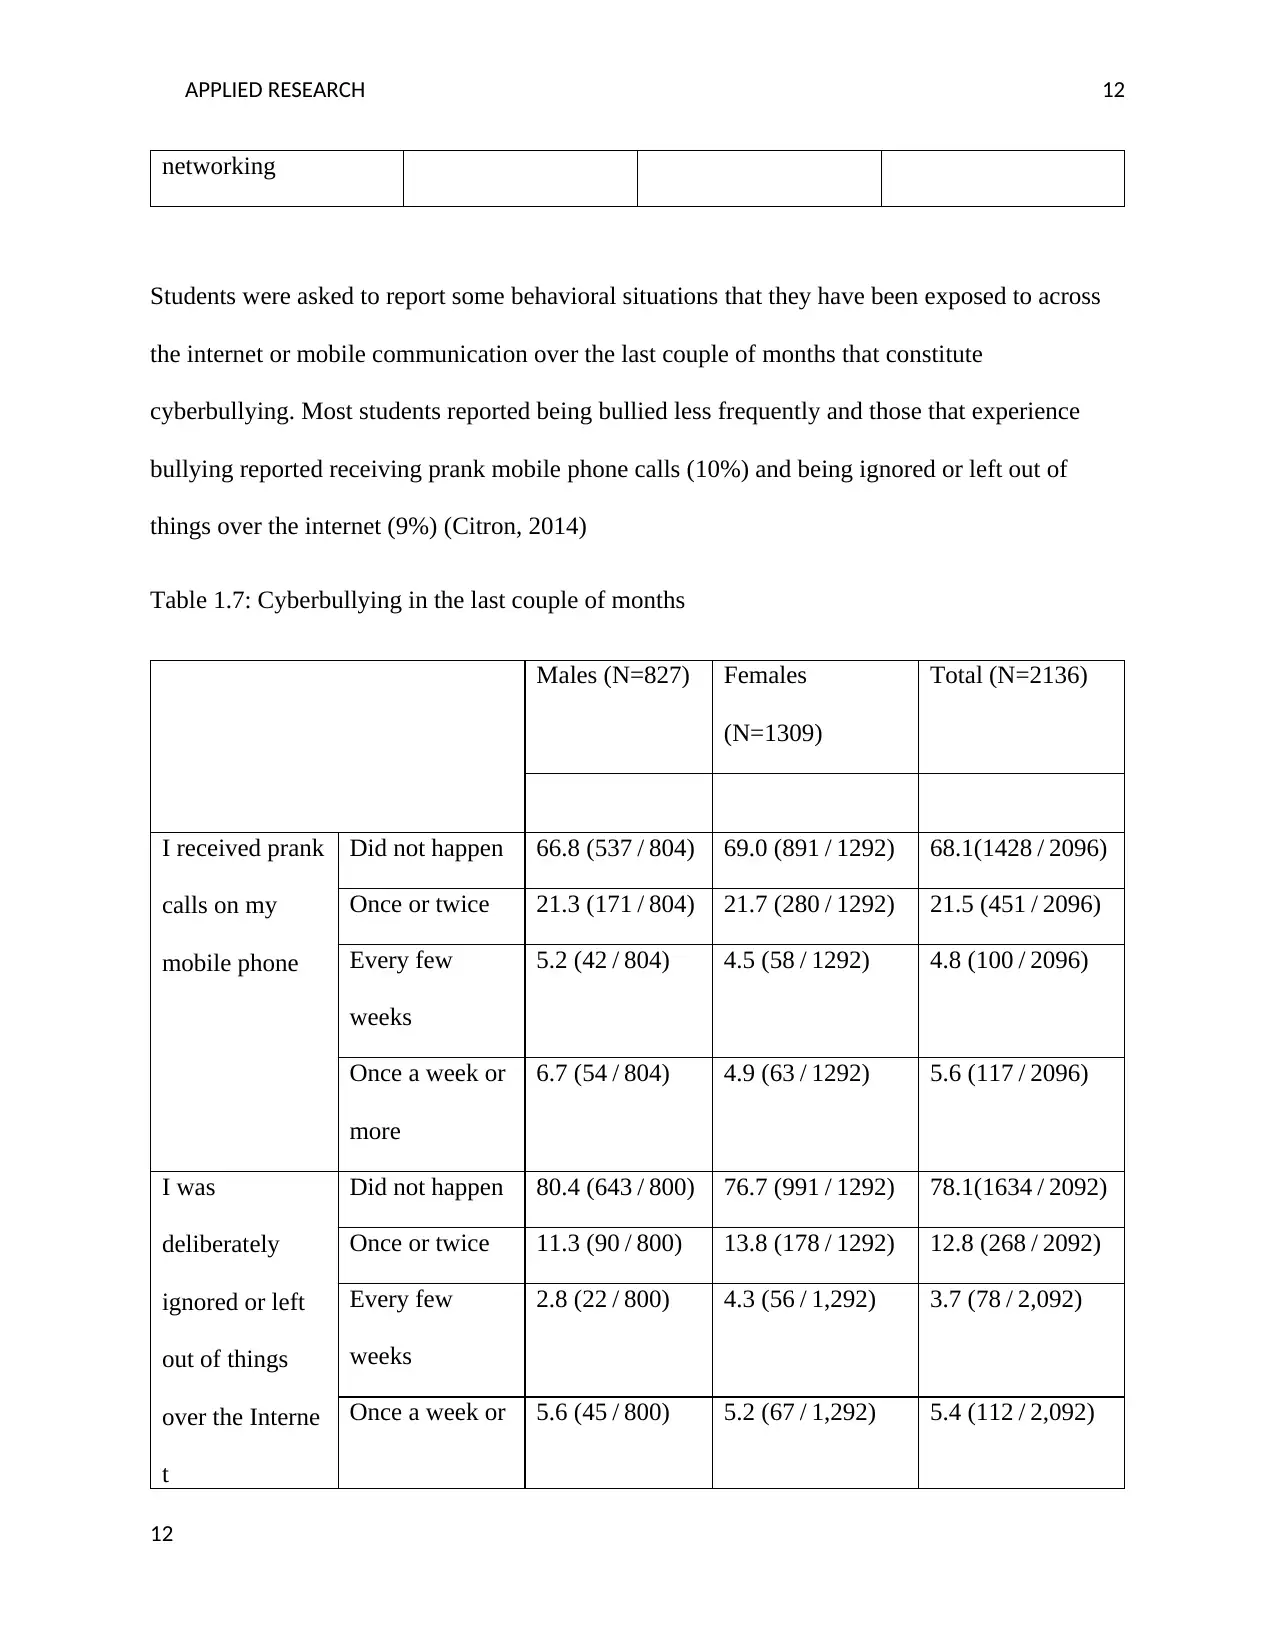
Students were asked to report some behavioral situations that they have been exposed to across
the internet or mobile communication over the last couple of months that constitute
cyberbullying. Most students reported being bullied less frequently and those that experience
bullying reported receiving prank mobile phone calls (10%) and being ignored or left out of
things over the internet (9%) (Citron, 2014)
Table 1.7: Cyberbullying in the last couple of months
Males (N=827) Females
(N=1309)
Total (N=2136)
I received prank
calls on my
mobile phone
Did not happen 66.8 (537 / 804) 69.0 (891 / 1292) 68.1(1428 / 2096)
Once or twice 21.3 (171 / 804) 21.7 (280 / 1292) 21.5 (451 / 2096)
Every few
weeks
5.2 (42 / 804) 4.5 (58 / 1292) 4.8 (100 / 2096)
Once a week or
more
6.7 (54 / 804) 4.9 (63 / 1292) 5.6 (117 / 2096)
I was
deliberately
ignored or left
out of things
over the Interne
t
Did not happen 80.4 (643 / 800) 76.7 (991 / 1292) 78.1(1634 / 2092)
Once or twice 11.3 (90 / 800) 13.8 (178 / 1292) 12.8 (268 / 2092)
Every few
weeks
2.8 (22 / 800) 4.3 (56 / 1,292) 3.7 (78 / 2,092)
Once a week or 5.6 (45 / 800) 5.2 (67 / 1,292) 5.4 (112 / 2,092)
12
networking
Students were asked to report some behavioral situations that they have been exposed to across
the internet or mobile communication over the last couple of months that constitute
cyberbullying. Most students reported being bullied less frequently and those that experience
bullying reported receiving prank mobile phone calls (10%) and being ignored or left out of
things over the internet (9%) (Citron, 2014)
Table 1.7: Cyberbullying in the last couple of months
Males (N=827) Females
(N=1309)
Total (N=2136)
I received prank
calls on my
mobile phone
Did not happen 66.8 (537 / 804) 69.0 (891 / 1292) 68.1(1428 / 2096)
Once or twice 21.3 (171 / 804) 21.7 (280 / 1292) 21.5 (451 / 2096)
Every few
weeks
5.2 (42 / 804) 4.5 (58 / 1292) 4.8 (100 / 2096)
Once a week or
more
6.7 (54 / 804) 4.9 (63 / 1292) 5.6 (117 / 2096)
I was
deliberately
ignored or left
out of things
over the Interne
t
Did not happen 80.4 (643 / 800) 76.7 (991 / 1292) 78.1(1634 / 2092)
Once or twice 11.3 (90 / 800) 13.8 (178 / 1292) 12.8 (268 / 2092)
Every few
weeks
2.8 (22 / 800) 4.3 (56 / 1,292) 3.7 (78 / 2,092)
Once a week or 5.6 (45 / 800) 5.2 (67 / 1,292) 5.4 (112 / 2,092)
12
⊘ This is a preview!⊘
Do you want full access?
Subscribe today to unlock all pages.
Trusted by 1+ million students worldwide
1 out of 15
Related Documents


Your All-in-One AI-Powered Toolkit for Academic Success.
+13062052269
info@desklib.com
Available 24*7 on WhatsApp / Email
![[object Object]](/_next/static/media/star-bottom.7253800d.svg)
Unlock your academic potential
Copyright © 2020–2026 A2Z Services. All Rights Reserved. Developed and managed by ZUCOL.