Detailed Financial Analysis Report: ASX Listed Companies Performance
VerifiedAdded on 2020/06/03
|19
|4604
|58
Report
AI Summary
This report provides a comprehensive financial analysis of several companies listed on the Australian Stock Exchange (ASX). The analysis includes an examination of the treasury notes rate in Australia and the measurement of monthly returns for each share, utilizing share price indices and market price indices. Furthermore, the report analyzes the expected return of each share and calculates their respective beta values. The Capital Asset Pricing Model (CAPM) is employed to determine the fair return for each company, and the security market line is presented graphically. A portfolio is prepared, and the rate of return and beta value are calculated. The study covers a period from January 1, 2000, to December 31, 2017, providing insights into the profitability and market value of these companies. The report concludes with an assessment of the financial performance and investment potential of the analyzed companies.

FINANCE
Paraphrase This Document
Need a fresh take? Get an instant paraphrase of this document with our AI Paraphraser
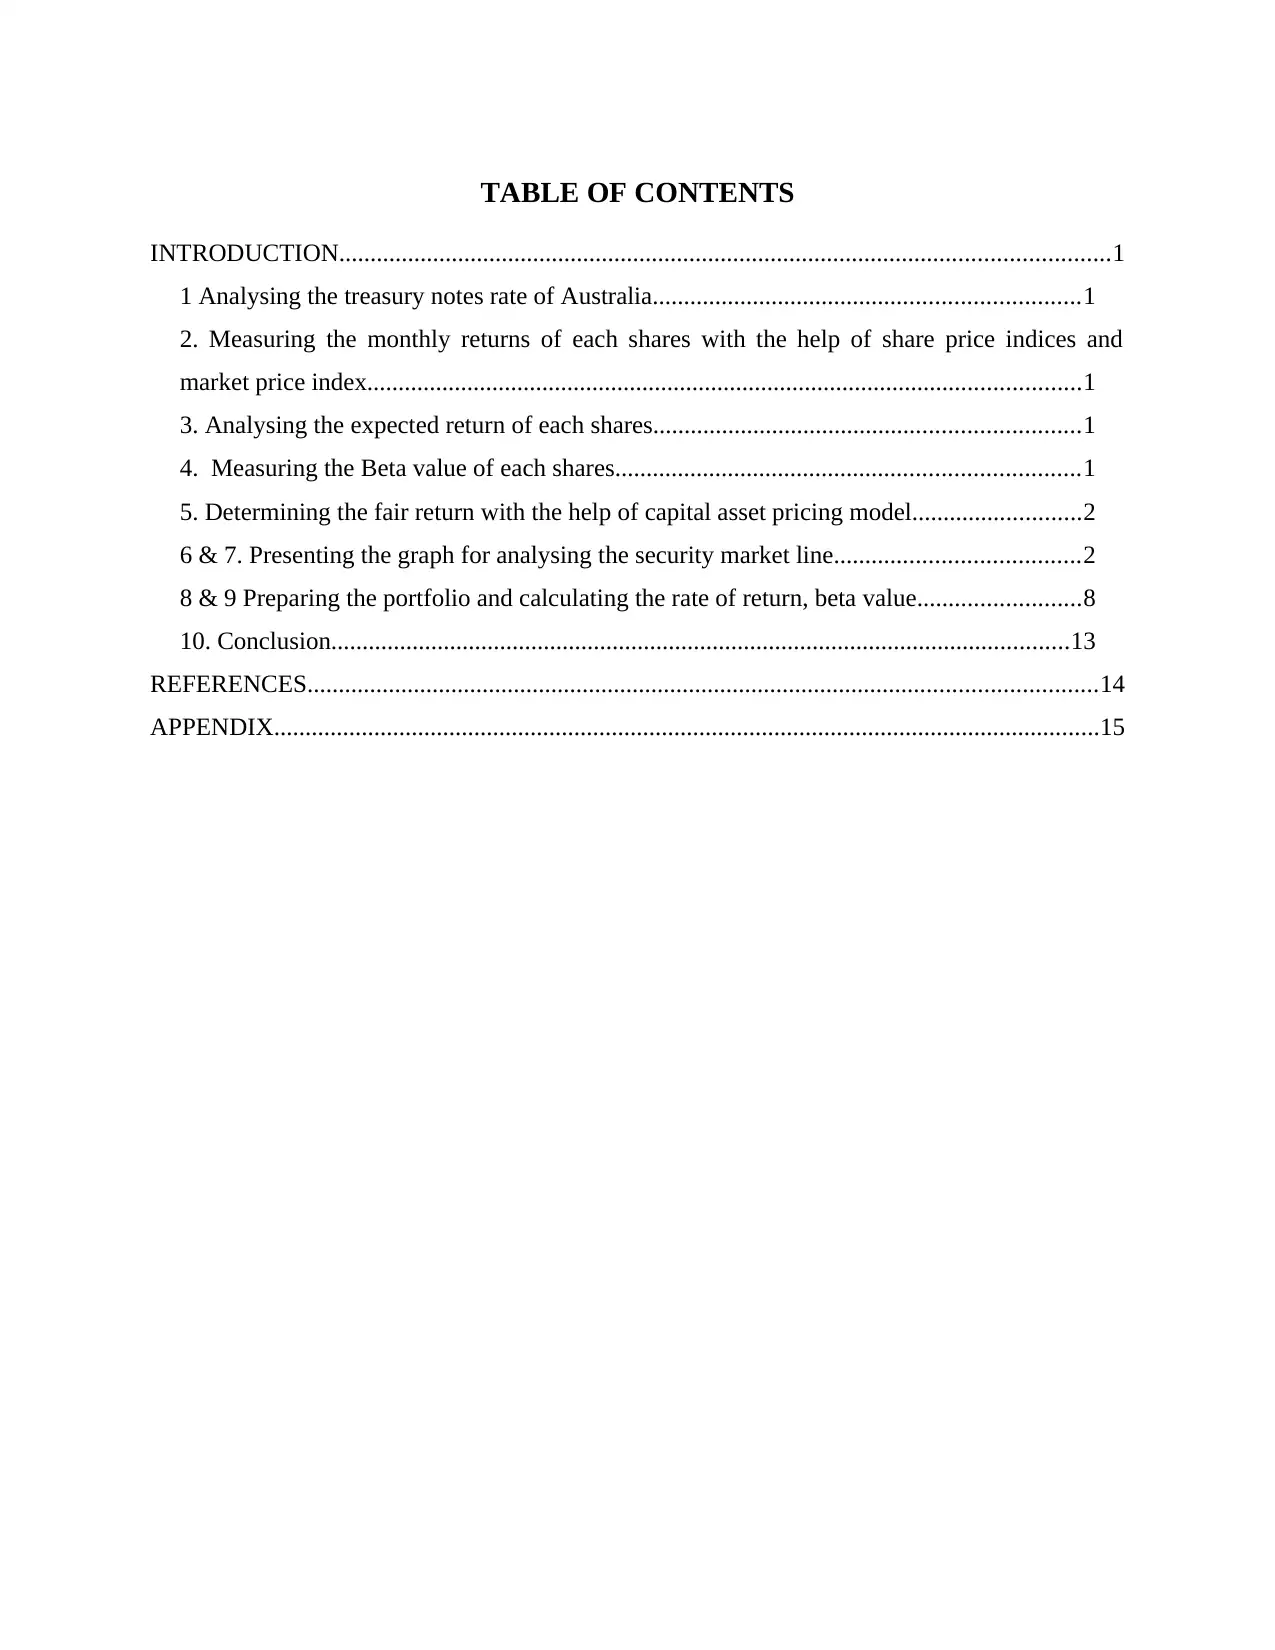
TABLE OF CONTENTS
INTRODUCTION...........................................................................................................................1
1 Analysing the treasury notes rate of Australia....................................................................1
2. Measuring the monthly returns of each shares with the help of share price indices and
market price index..................................................................................................................1
3. Analysing the expected return of each shares....................................................................1
4. Measuring the Beta value of each shares..........................................................................1
5. Determining the fair return with the help of capital asset pricing model...........................2
6 & 7. Presenting the graph for analysing the security market line.......................................2
8 & 9 Preparing the portfolio and calculating the rate of return, beta value..........................8
10. Conclusion......................................................................................................................13
REFERENCES..............................................................................................................................14
APPENDIX....................................................................................................................................15

INTRODUCTION
In order to analyse profitability of the Australian Stock Exchange listed companies there
is need to measure their market value as well as efficiency in meeting the debts. In the present
study there will be measurements over the 7 organisations which has the appropriate market
value and have the sufficiency equity in the market. The report will be based on analysing the 7
companies such as AGL Energy Limited, ANZ Banking group Limited, BHP Billiton Limited,
Macquarie group limited, National Aust. Bank, Telstra Corporation and Westfield Corp Staped
Securities.
1 Analysing the treasury notes rate of Australia
In order to analyse the risk free rate of Treasury Notes in Australia which were on the
basis of the shortest maturity (Brock, 2018). Therefore, the analysis can be seen in the below
listed Appendix A. The collected information were from 1 January 2000 to 31st December 2017.
2. Measuring the monthly returns of each shares with the help of share price indices and market
price index
By considering the share value of 7 ASX listed corporations there has been analysis
based on determining the risk free rate and market rate (Joy, 2018). However, all the organisation
has been analysed and they present the risk free rate as in Appendix B.
3. Analysing the expected return of each shares
The average of rate return for all the corporation which will be seen in Appendix B.
therefore, it beings the analysis as National Aust. Bank 0.90%, Telstra Corporation 0.81%
Westfield Corp Stapled Securities 0.78%,Macquarie group limited 0.84%, ANZ Banking group
limited 1.18%, BHP Billiton Limited 1.18% and AGL energy Limited 1.53%. Therefore, in
relation with analysing such operations it can be said that ANZ, AGL & BHP are to most
profitable industries in terms of giving the favourable returns to their clients (Lafortune,
Rothstein & Schanzenbach, 2018).
4. Measuring the Beta value of each shares
To analyse the beta value of the proposed data set there has been use of SLOPE formula
in excel sheet and which represents the Beta value of such data base (Guthman, 2018).
companies beta value (slope)
Beta
Value
1
⊘ This is a preview!⊘
Do you want full access?
Subscribe today to unlock all pages.
Trusted by 1+ million students worldwide
National Aust. Bank(ra) 0.00254 1.406
Telstra Corporation -0.00066 -0.458
Westfield Corp Stapled
Securities 0.00149 1.124
Macquarie group limited 0.00174 1.130
ANZ Banking group limited 0.00244 1.328
BHP Billiton Limited 0.00132 0.530
AGL energy Limited 0.00373 0.928
In consideration with analysing the Beta value of the industries it can be said that those
firms who have beta rate more the 1 than there share value id volatile and can have variation in
the future (Cerchiello & Nicola, 2018). On the other side, those industries which has lower beta
rate than 1 than the prices of their shares will remain constant for the long period.
5. Determining the fair return with the help of capital asset pricing model
To determining the CAPM value there is need to consider all the information which will
be useful for analysis (Rocheteau, Wright & Zhang, 2018). Moreover, the CAMP value of these
respected industries is:
National
Aust.
Bank
Telstra
Corporat
ion
Westfield Corp
Stapled
Securities
Macquarie
group
limited
ANZ
Banking
group
limited
BHP
Billiton
Limited
AGL
energy
Limited
risk
free
rate 1.303 1.303 1.303 1.303 1.303 1.303 1.303
mark
et
risk 0.90% 0.81% 0.78% 0.84% 1.18% 1.18% 1.53%
beta
value -0.587 0.241 1.298 -3.230 -0.359 1.837 -0.379
CAP
M 2.063 0.990 -0.379 5.485 1.767 -1.068 1.791
2
Paraphrase This Document
Need a fresh take? Get an instant paraphrase of this document with our AI Paraphraser
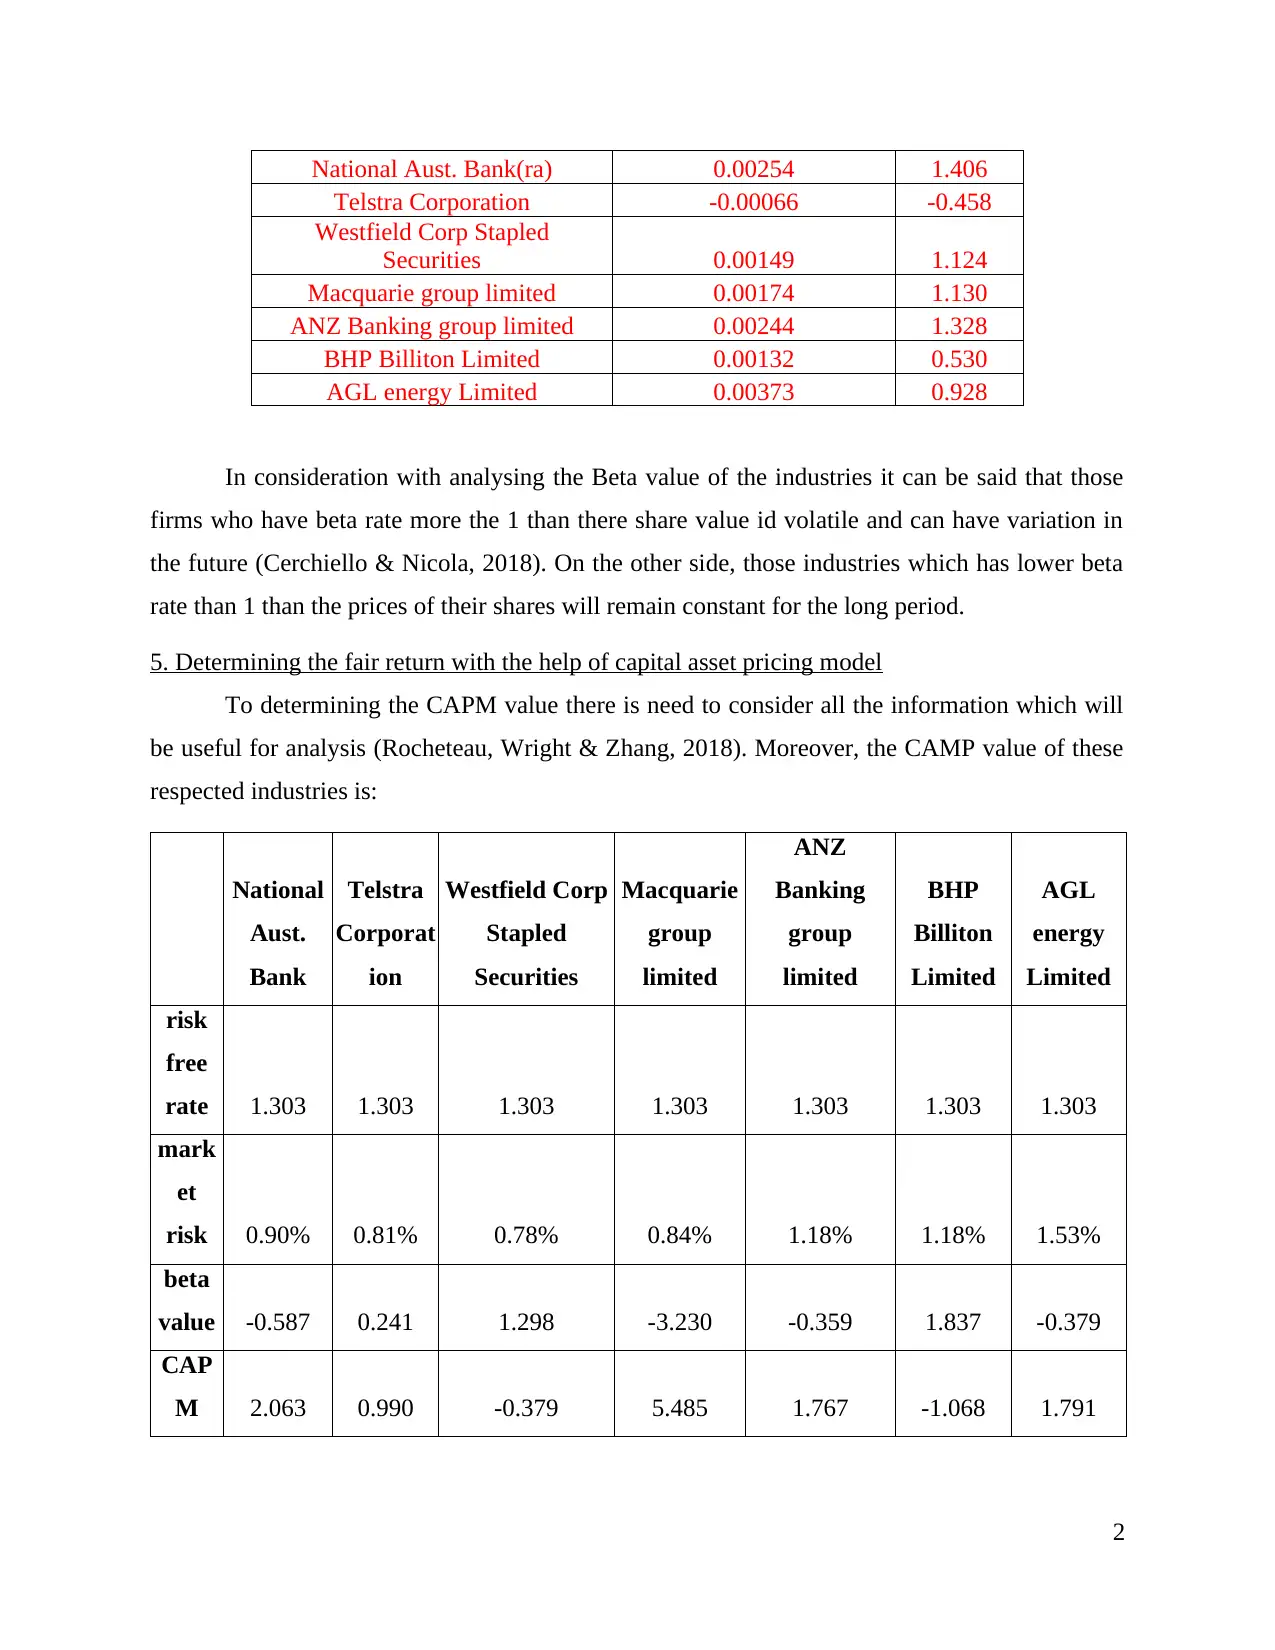
6 & 7. Presenting the graph for analysing the security market line
National Aust. Bank:
Rate of return Beta CAPM
9.1
0.00252479131255305
9.1
22.198521
1
22.198521
13.098521
9.1
National Aust. Bank
Risk free Market Stock
Telstra Corporation:
Rate of return Beta CAPM
9.1
-0.000653406166533815
9.1
2.614341
1
2.614341
-6.485659
9.1
Telstra Corporation
Stock Market Risk free
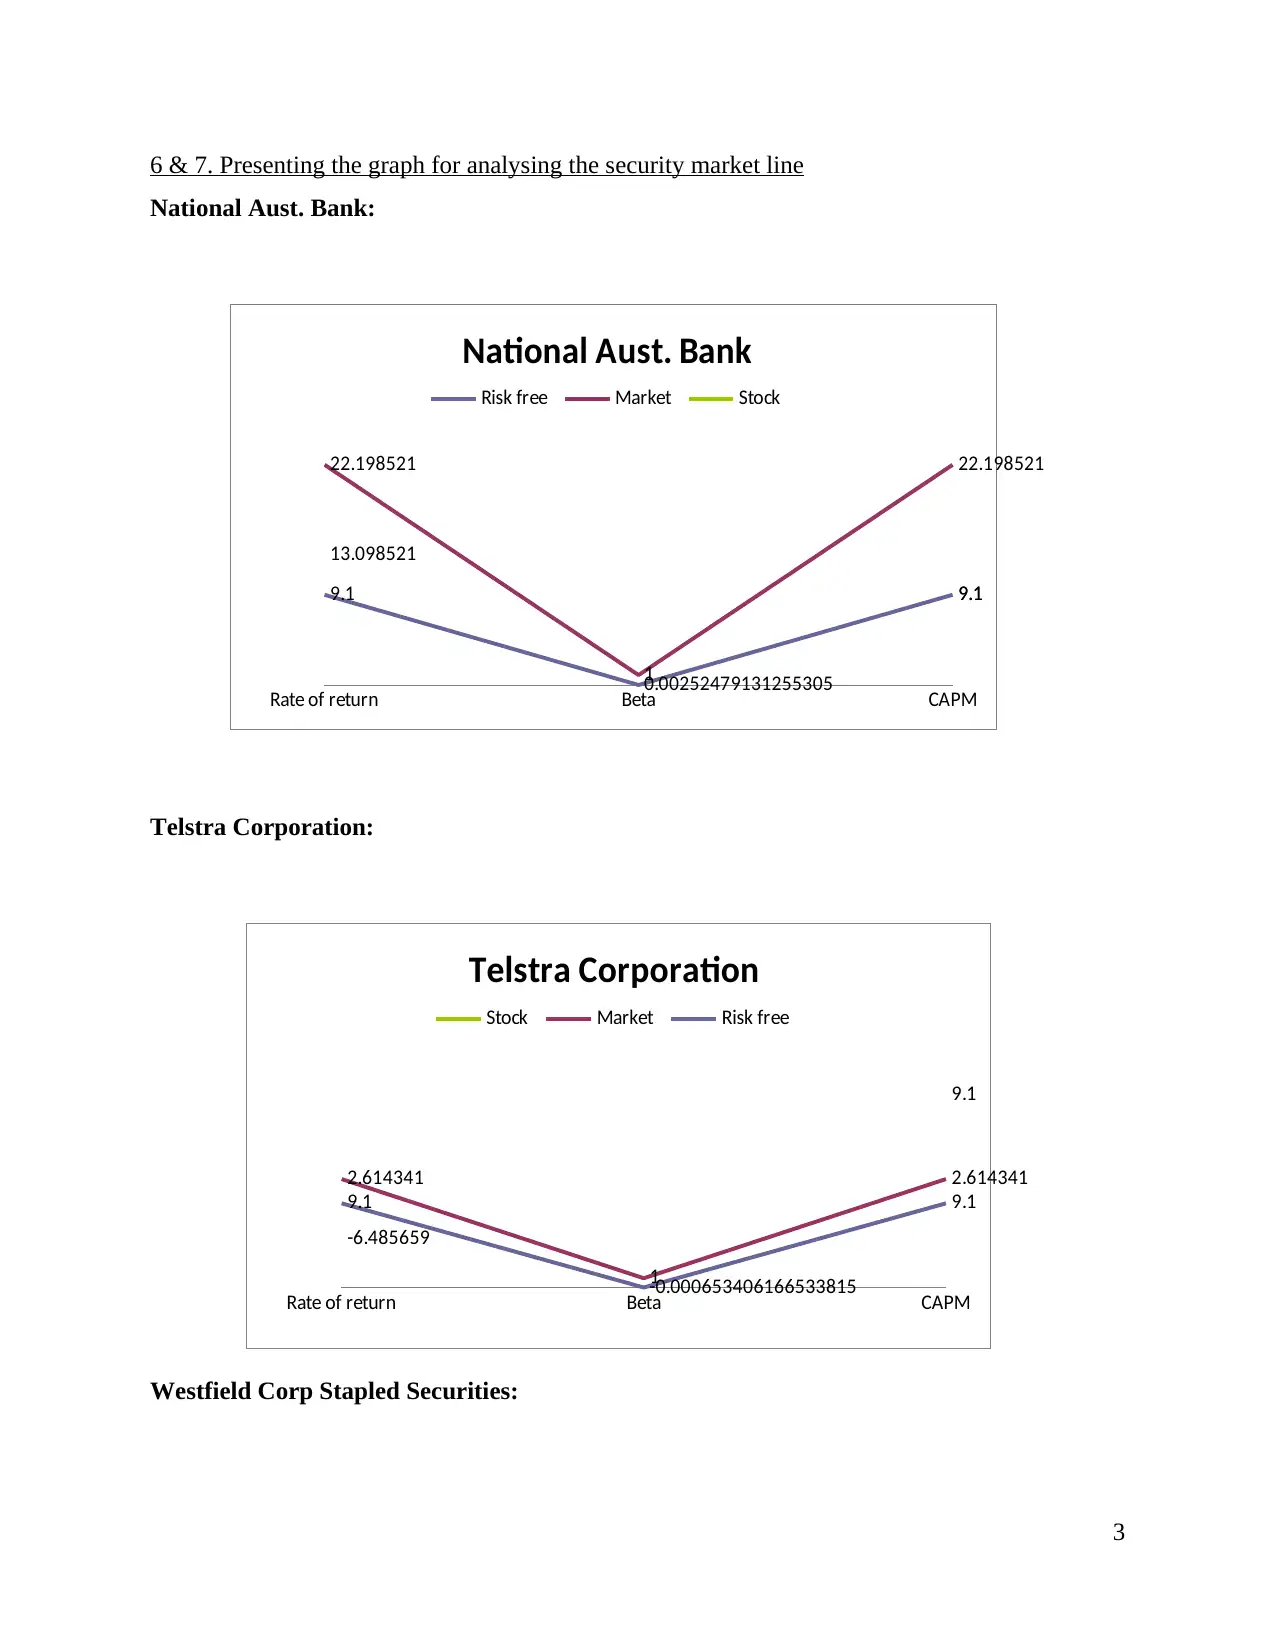
Westfield Corp Stapled Securities:
3
National Aust. Bank:
Rate of return Beta CAPM
9.1
0.00252479131255305
9.1
22.198521
1
22.198521
13.098521
9.1
National Aust. Bank
Risk free Market Stock
Telstra Corporation:
Rate of return Beta CAPM
9.1
-0.000653406166533815
9.1
2.614341
1
2.614341
-6.485659
9.1
Telstra Corporation
Stock Market Risk free
Westfield Corp Stapled Securities:
3
Rate of return Beta CAPM
9.1
0.0014618506371223
9.1
6.536245
1
6.536245
-2.563755
9.1
Westfield Corp Stapled Securities
Stock Market Risk free
Macquarie group limited:
Rate of return Beta CAPM
9.1
0.00170720689480324
9.1
16.885993
1
16.885993
7.785993 9.1
Macquarie group limited
Stock Market Risk free
ANZ Banking Group Limited:
4
9.1
0.0014618506371223
9.1
6.536245
1
6.536245
-2.563755
9.1
Westfield Corp Stapled Securities
Stock Market Risk free
Macquarie group limited:
Rate of return Beta CAPM
9.1
0.00170720689480324
9.1
16.885993
1
16.885993
7.785993 9.1
Macquarie group limited
Stock Market Risk free
ANZ Banking Group Limited:
4
⊘ This is a preview!⊘
Do you want full access?
Subscribe today to unlock all pages.
Trusted by 1+ million students worldwide
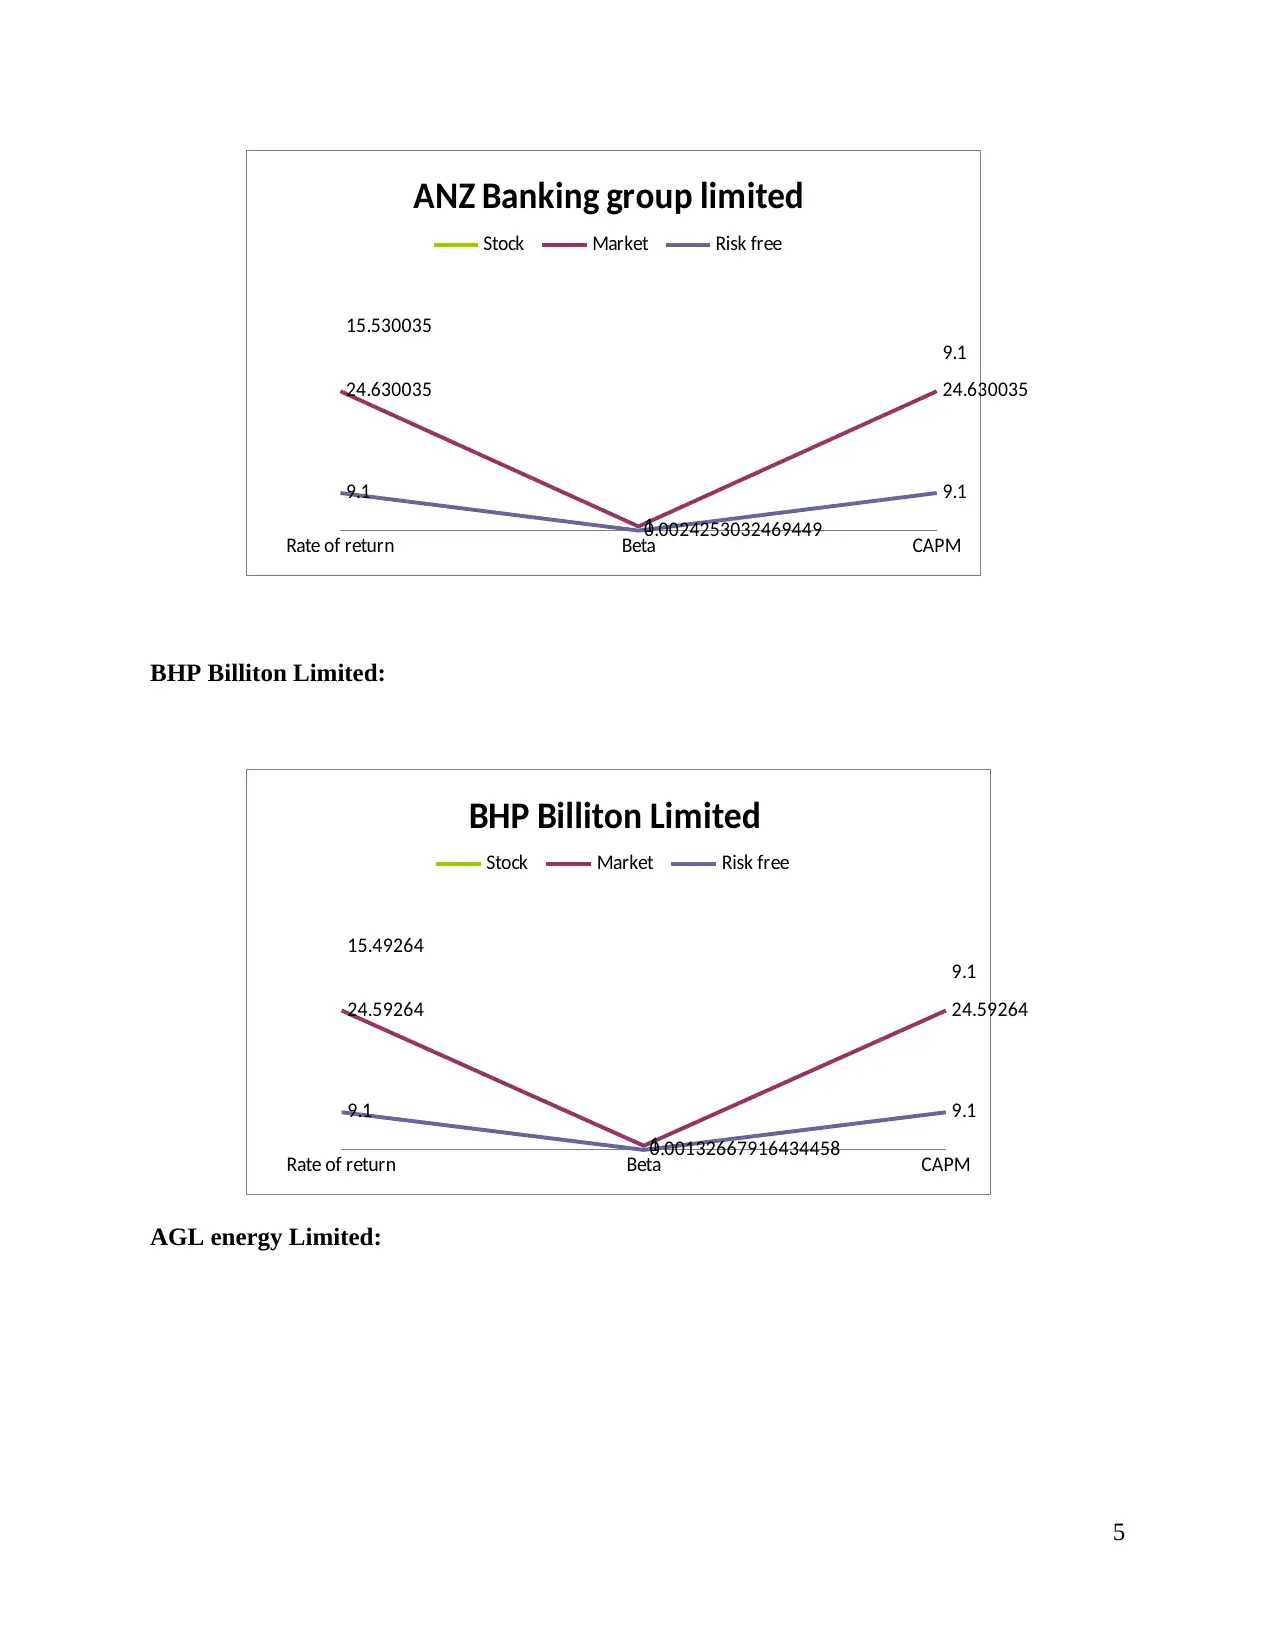
Rate of return Beta CAPM
9.1
0.0024253032469449
9.1
24.630035
1
24.630035
15.530035
9.1
ANZ Banking group limited
Stock Market Risk free
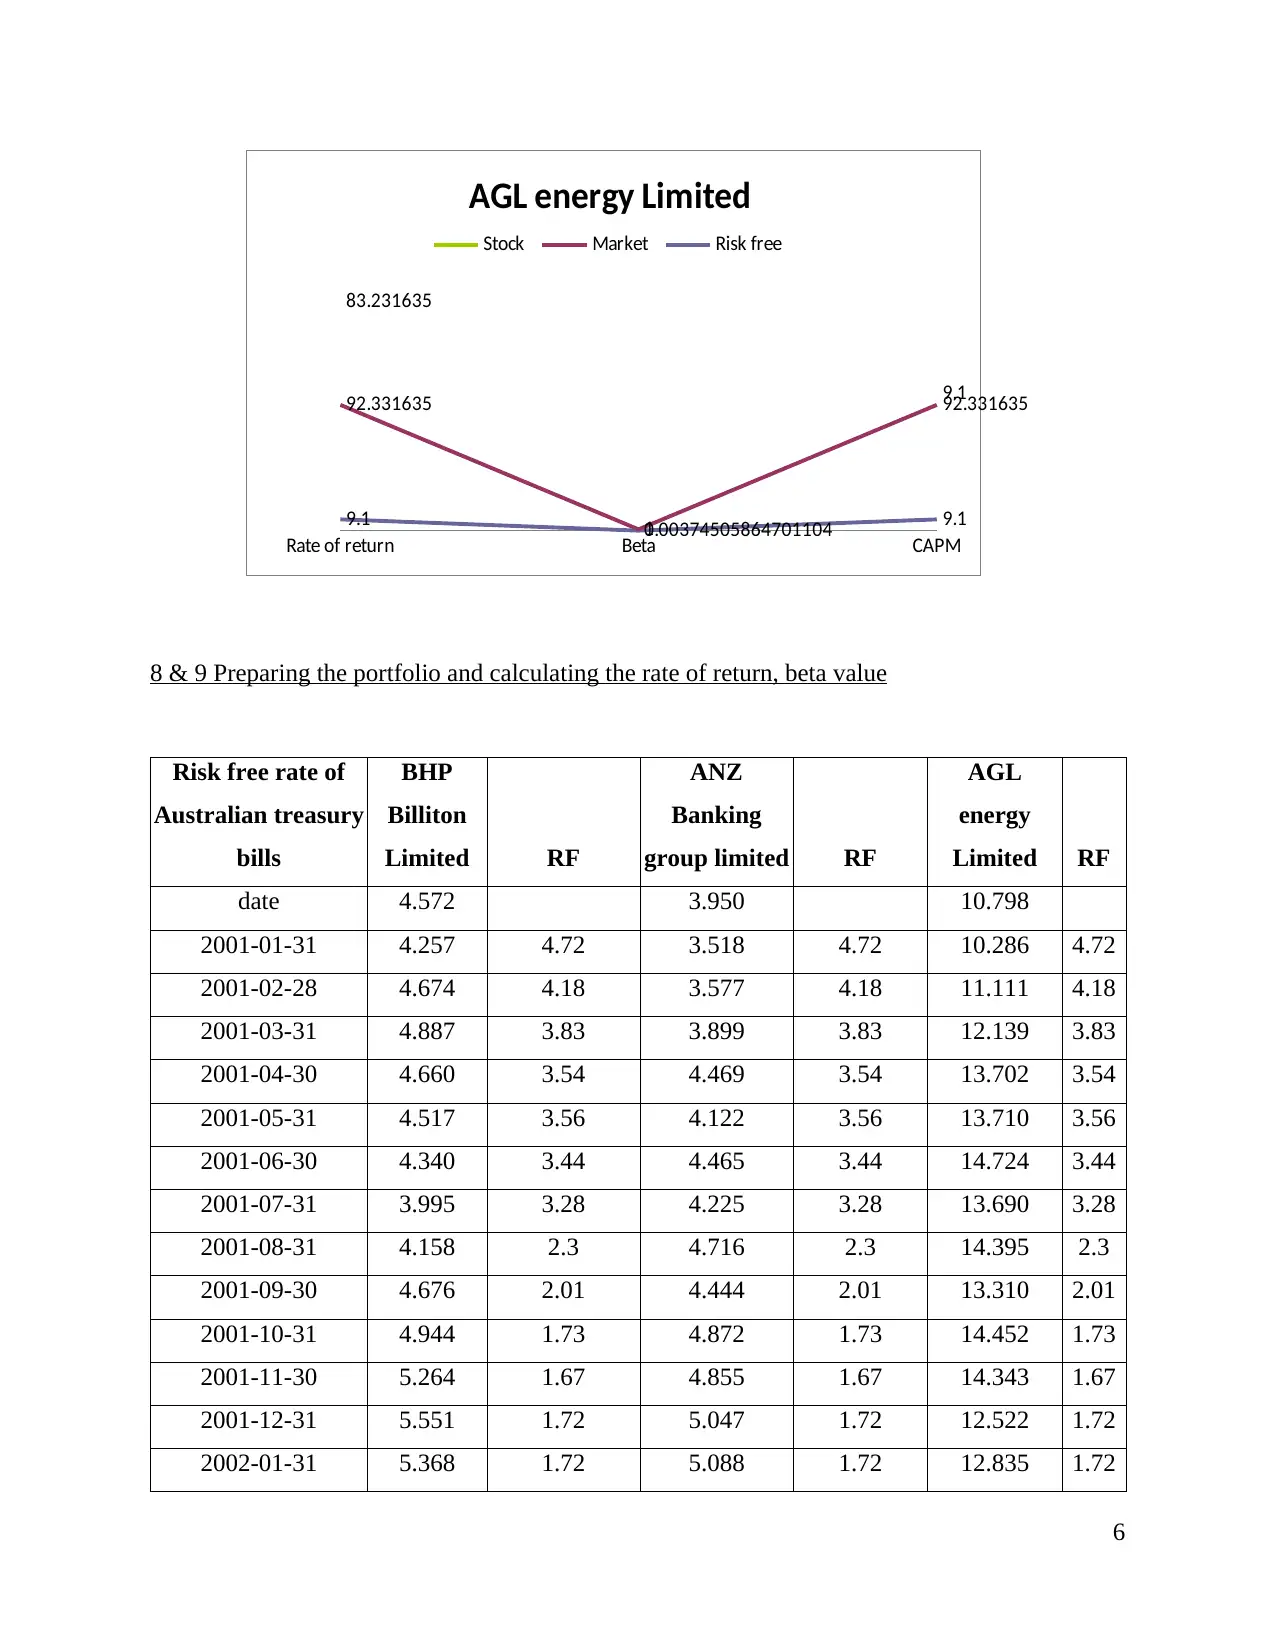
BHP Billiton Limited:
Rate of return Beta CAPM
9.1
0.00132667916434458
9.1
24.59264
1
24.59264
15.49264
9.1
BHP Billiton Limited
Stock Market Risk free
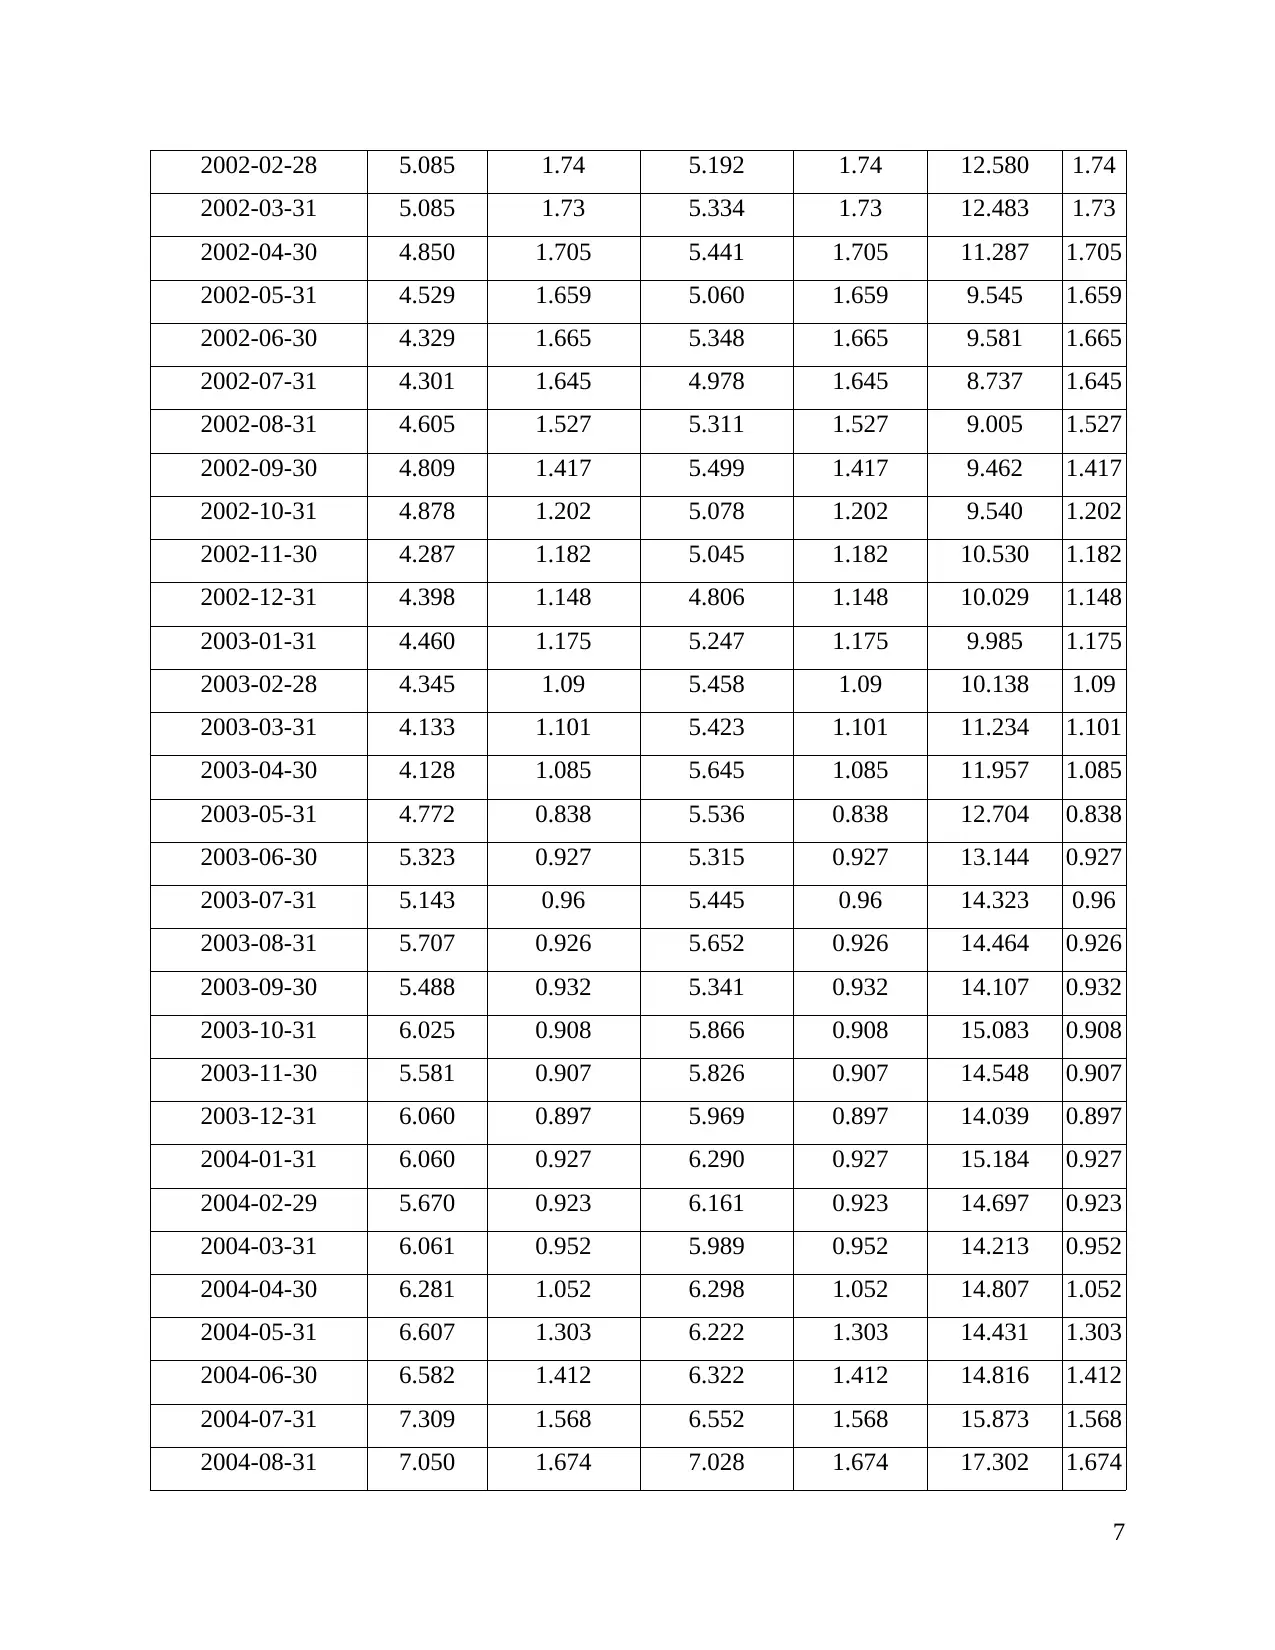
AGL energy Limited:
5
9.1
0.0024253032469449
9.1
24.630035
1
24.630035
15.530035
9.1
ANZ Banking group limited
Stock Market Risk free
BHP Billiton Limited:
Rate of return Beta CAPM
9.1
0.00132667916434458
9.1
24.59264
1
24.59264
15.49264
9.1
BHP Billiton Limited
Stock Market Risk free
AGL energy Limited:
5
Paraphrase This Document
Need a fresh take? Get an instant paraphrase of this document with our AI Paraphraser
Rate of return Beta CAPM
9.1 0.00374505864701104 9.1
92.331635
1
92.331635
83.231635
9.1
AGL energy Limited
Stock Market Risk free
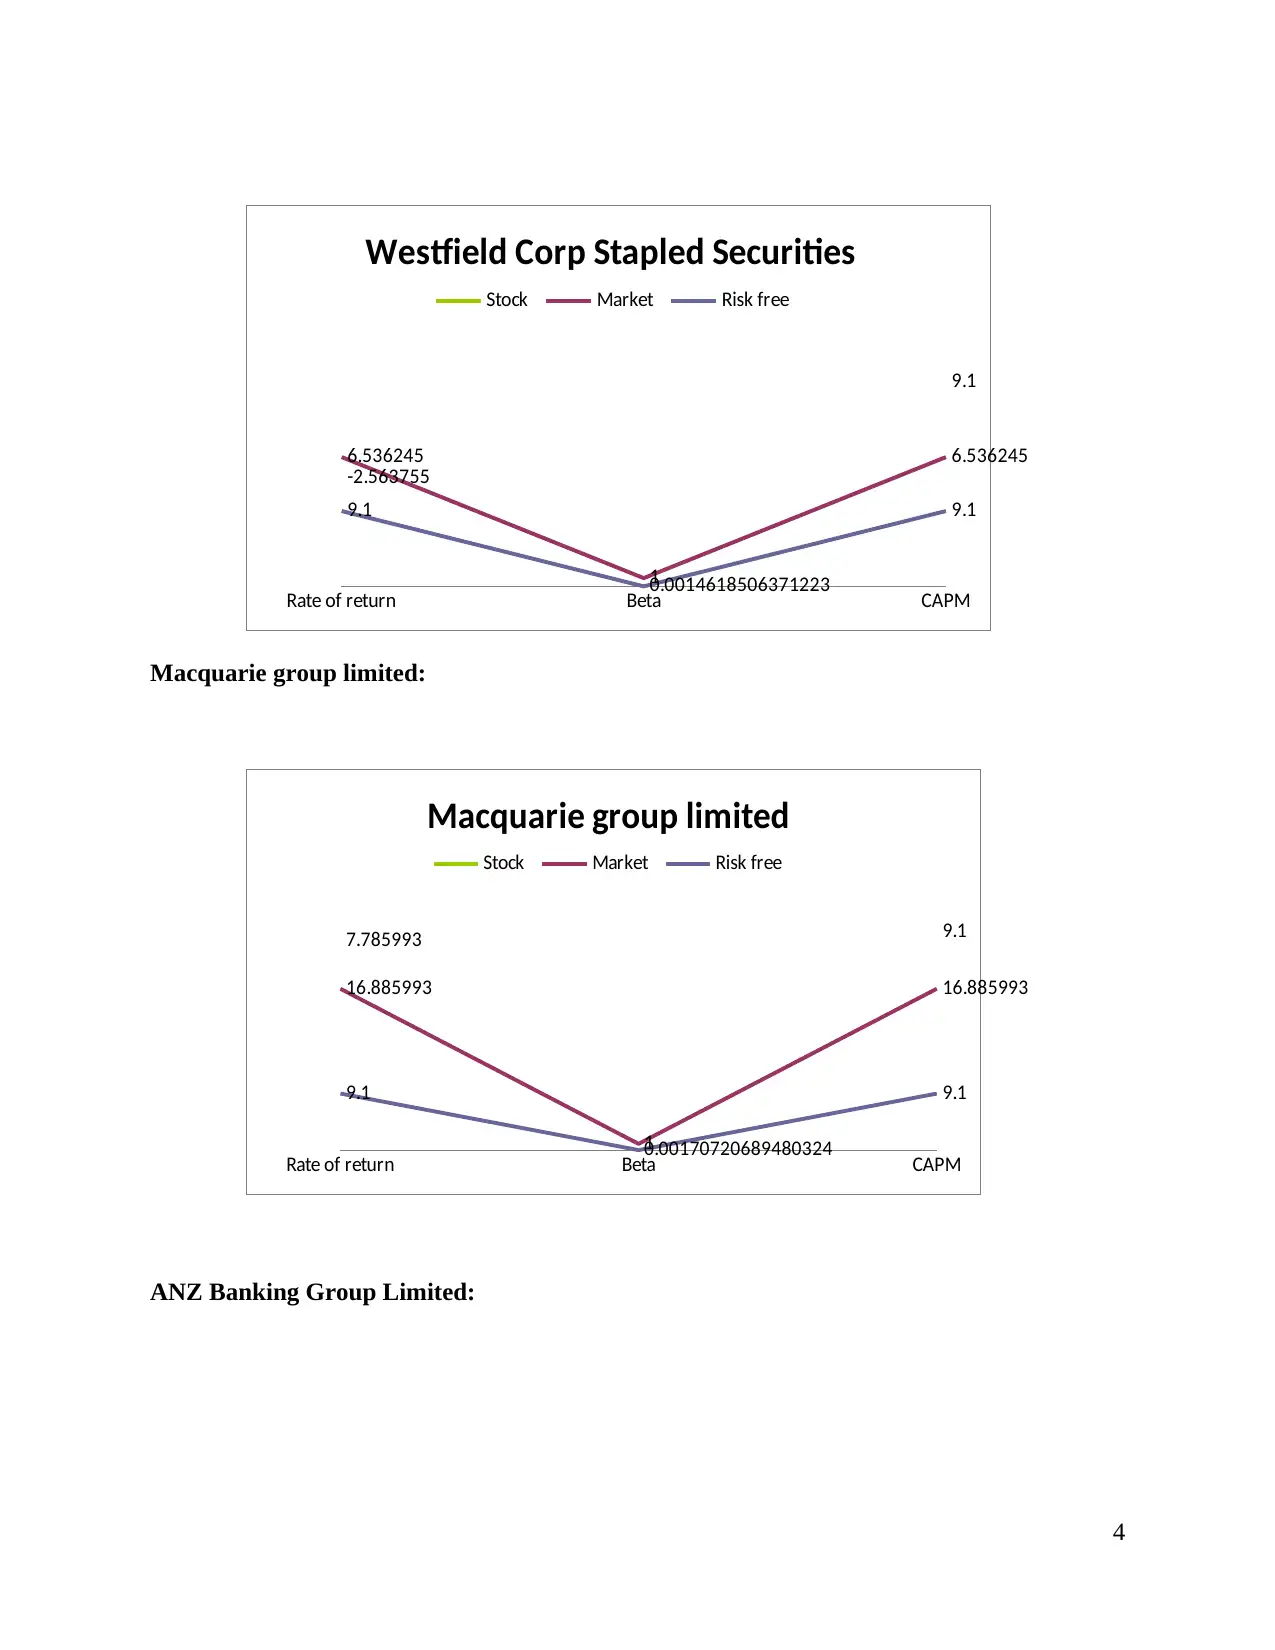
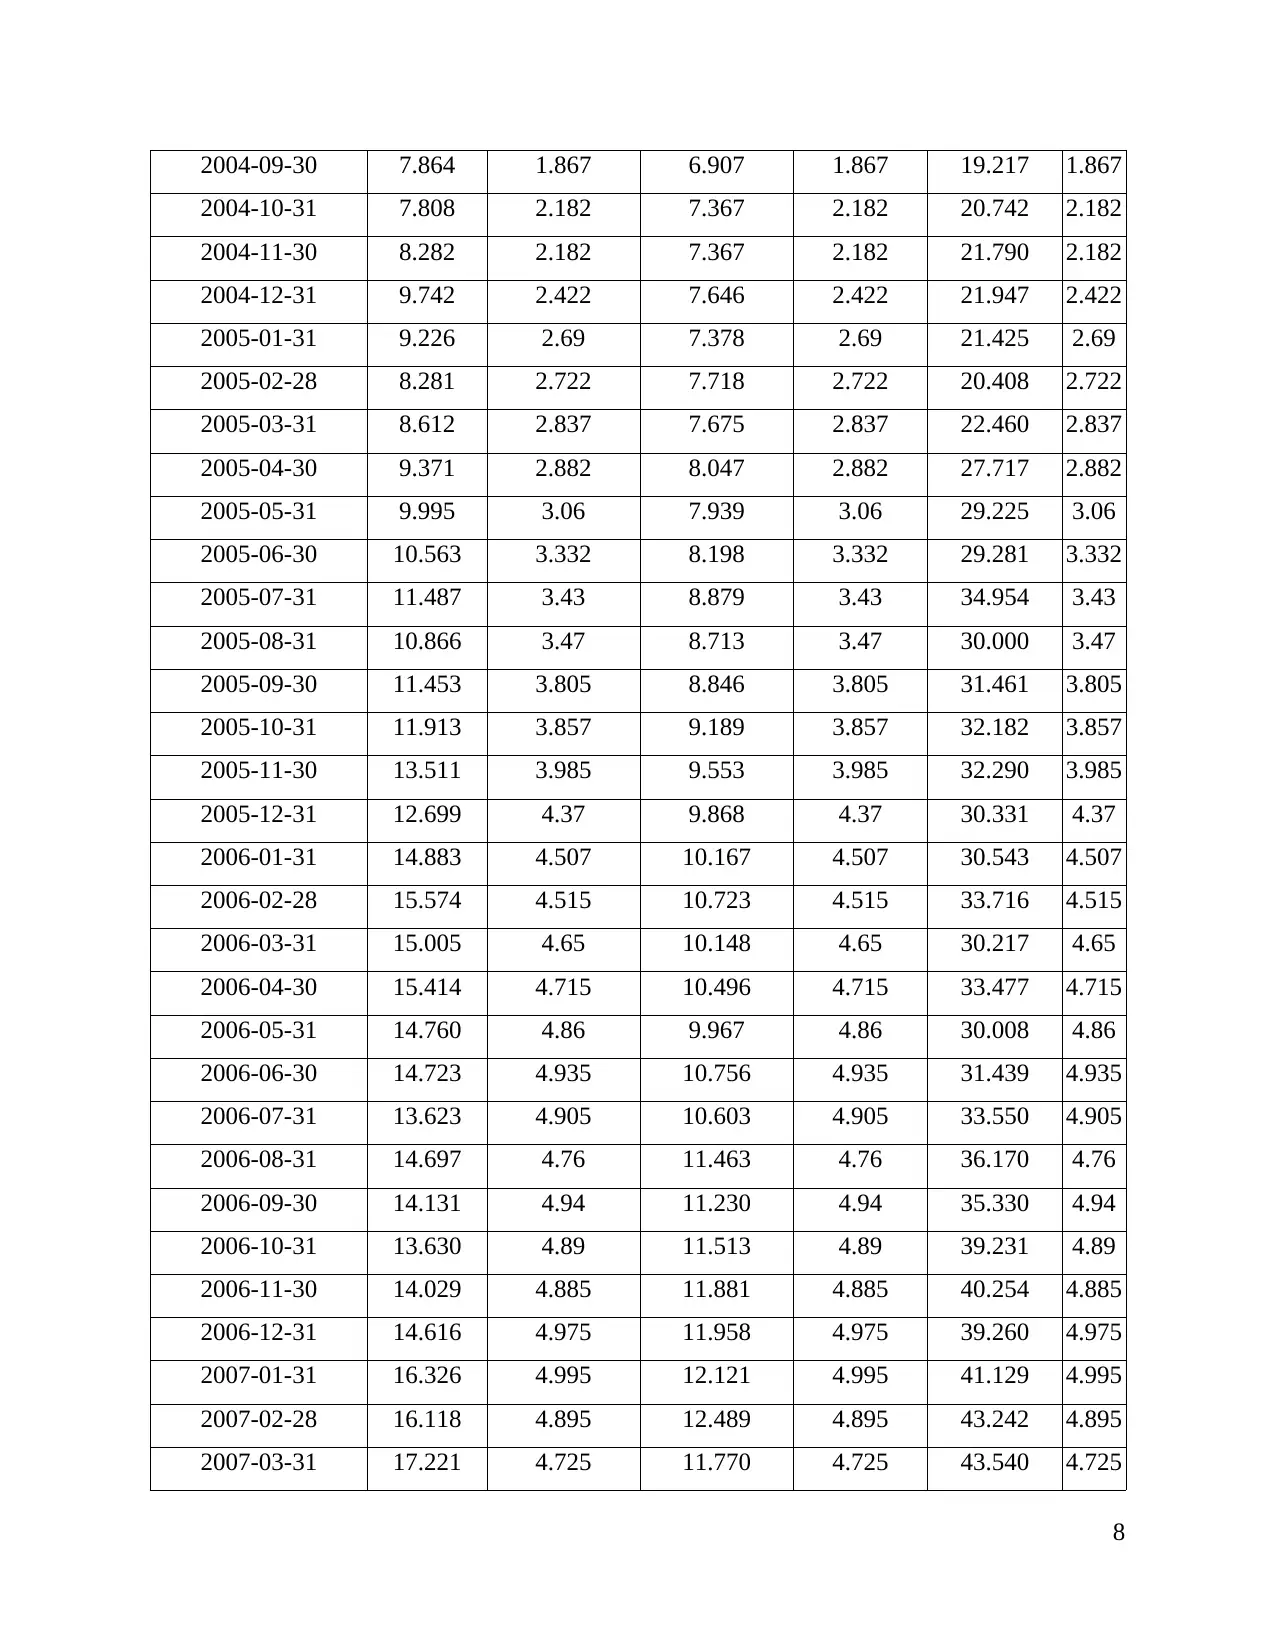
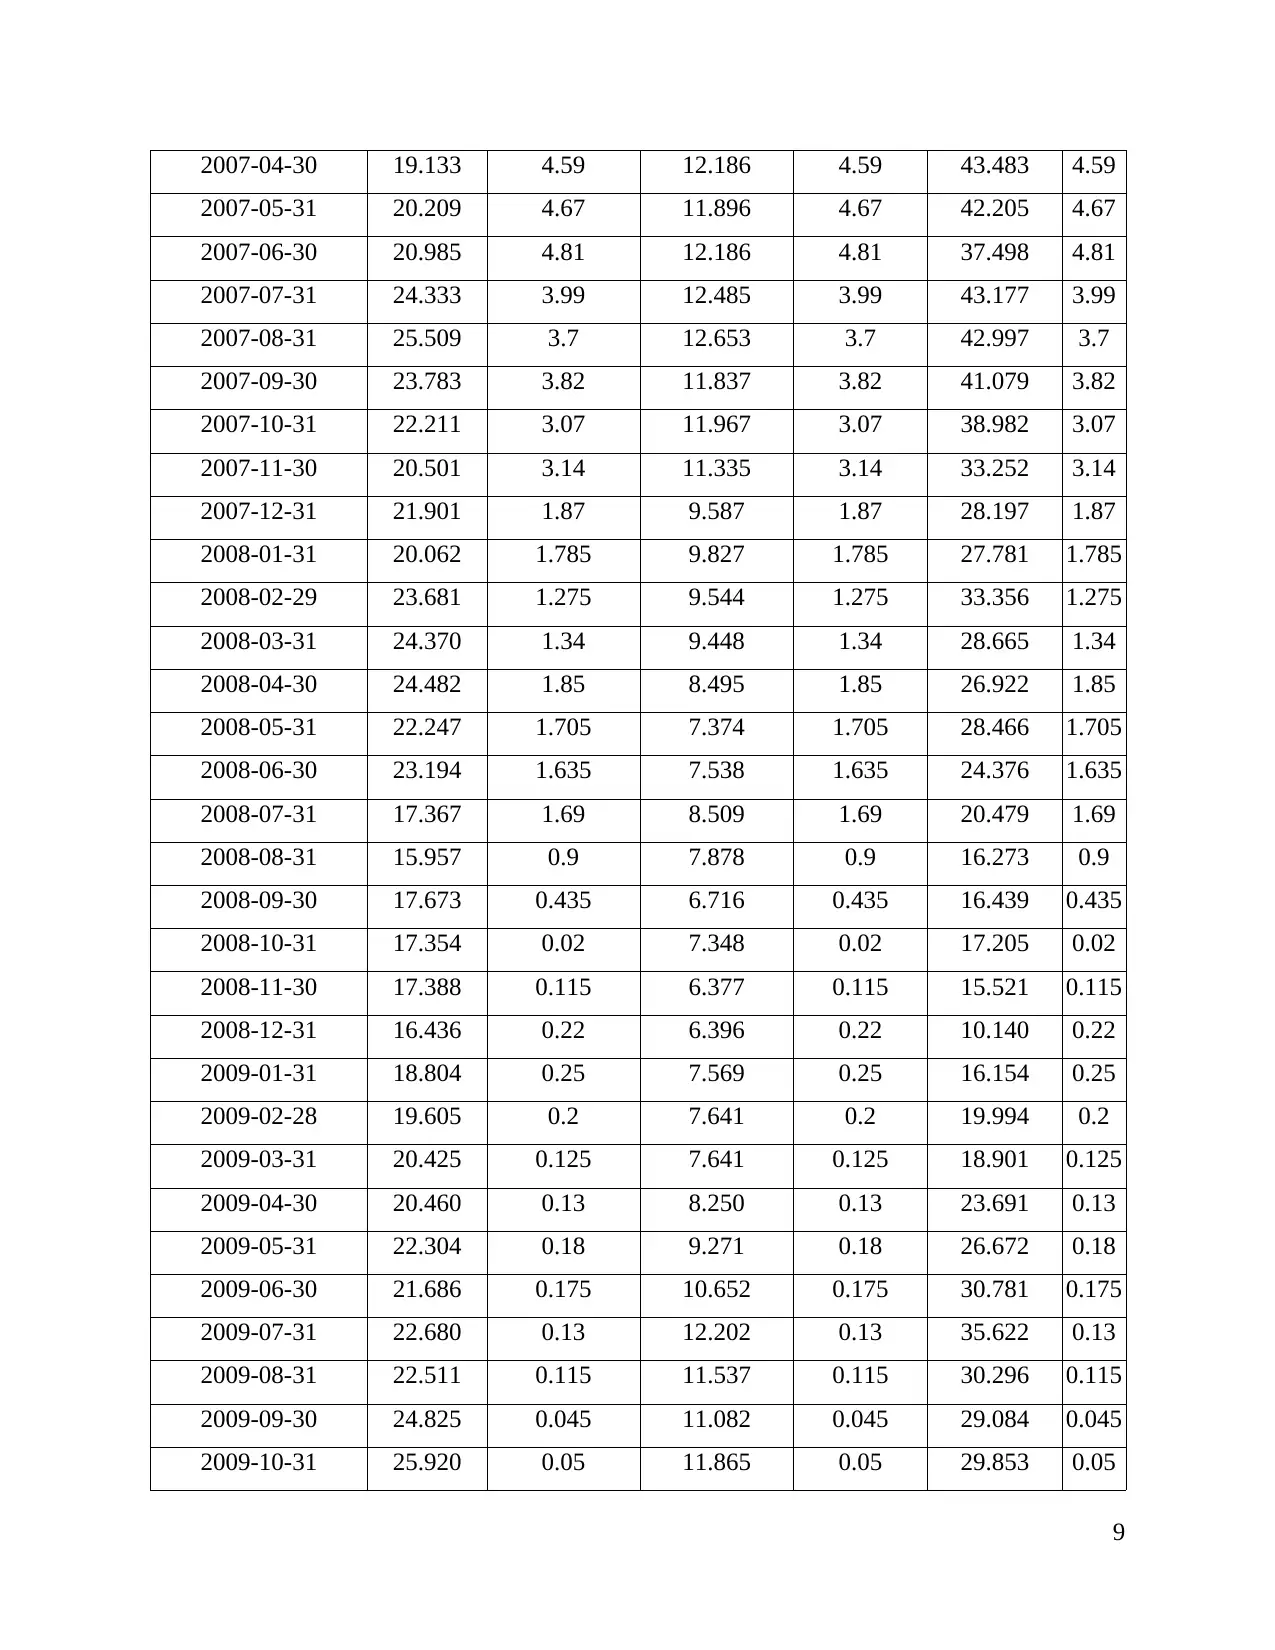
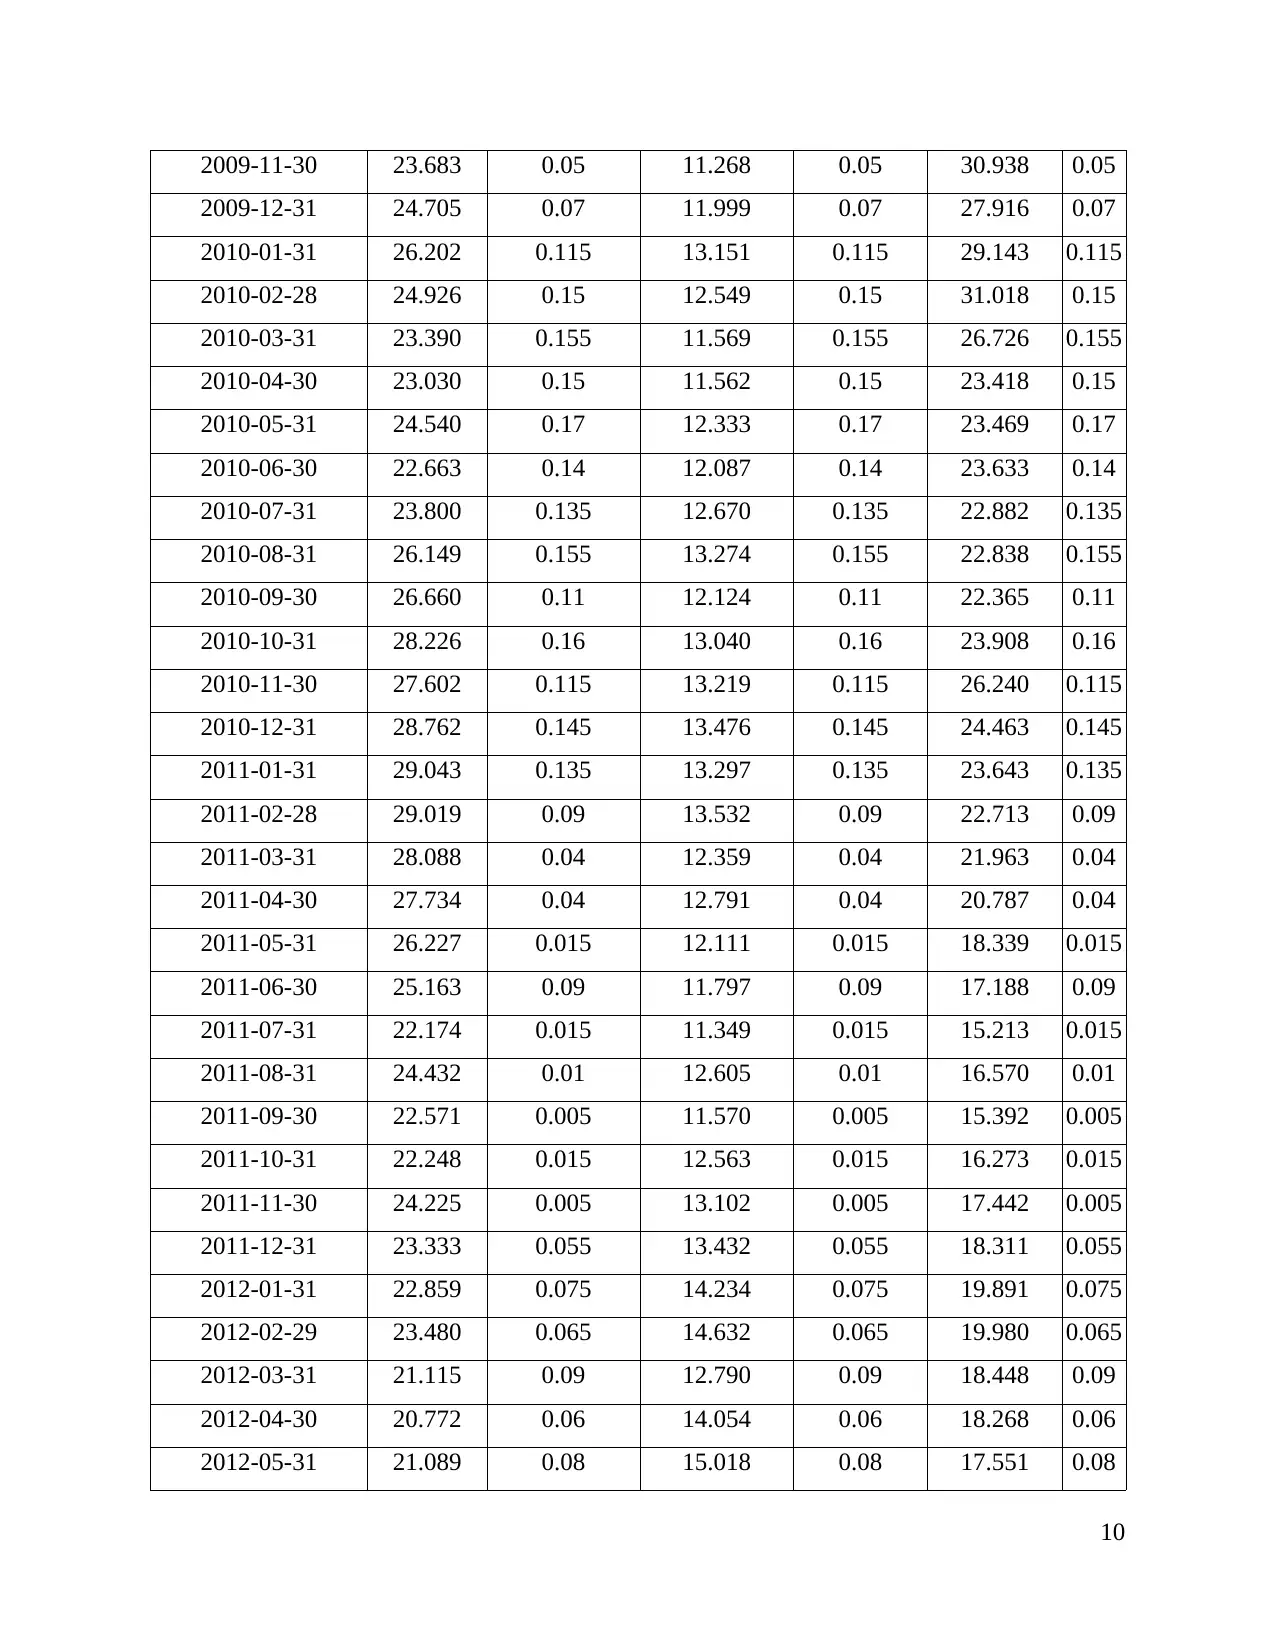
8 & 9 Preparing the portfolio and calculating the rate of return, beta value
Risk free rate of
Australian treasury
bills
BHP
Billiton
Limited RF
ANZ
Banking
group limited RF
AGL
energy
Limited RF
date 4.572 3.950 10.798
2001-01-31 4.257 4.72 3.518 4.72 10.286 4.72
2001-02-28 4.674 4.18 3.577 4.18 11.111 4.18
2001-03-31 4.887 3.83 3.899 3.83 12.139 3.83
2001-04-30 4.660 3.54 4.469 3.54 13.702 3.54
2001-05-31 4.517 3.56 4.122 3.56 13.710 3.56
2001-06-30 4.340 3.44 4.465 3.44 14.724 3.44
2001-07-31 3.995 3.28 4.225 3.28 13.690 3.28
2001-08-31 4.158 2.3 4.716 2.3 14.395 2.3
2001-09-30 4.676 2.01 4.444 2.01 13.310 2.01
2001-10-31 4.944 1.73 4.872 1.73 14.452 1.73
2001-11-30 5.264 1.67 4.855 1.67 14.343 1.67
2001-12-31 5.551 1.72 5.047 1.72 12.522 1.72
2002-01-31 5.368 1.72 5.088 1.72 12.835 1.72
6
9.1 0.00374505864701104 9.1
92.331635
1
92.331635
83.231635
9.1
AGL energy Limited
Stock Market Risk free
8 & 9 Preparing the portfolio and calculating the rate of return, beta value
Risk free rate of
Australian treasury
bills
BHP
Billiton
Limited RF
ANZ
Banking
group limited RF
AGL
energy
Limited RF
date 4.572 3.950 10.798
2001-01-31 4.257 4.72 3.518 4.72 10.286 4.72
2001-02-28 4.674 4.18 3.577 4.18 11.111 4.18
2001-03-31 4.887 3.83 3.899 3.83 12.139 3.83
2001-04-30 4.660 3.54 4.469 3.54 13.702 3.54
2001-05-31 4.517 3.56 4.122 3.56 13.710 3.56
2001-06-30 4.340 3.44 4.465 3.44 14.724 3.44
2001-07-31 3.995 3.28 4.225 3.28 13.690 3.28
2001-08-31 4.158 2.3 4.716 2.3 14.395 2.3
2001-09-30 4.676 2.01 4.444 2.01 13.310 2.01
2001-10-31 4.944 1.73 4.872 1.73 14.452 1.73
2001-11-30 5.264 1.67 4.855 1.67 14.343 1.67
2001-12-31 5.551 1.72 5.047 1.72 12.522 1.72
2002-01-31 5.368 1.72 5.088 1.72 12.835 1.72
6
2002-02-28 5.085 1.74 5.192 1.74 12.580 1.74
2002-03-31 5.085 1.73 5.334 1.73 12.483 1.73
2002-04-30 4.850 1.705 5.441 1.705 11.287 1.705
2002-05-31 4.529 1.659 5.060 1.659 9.545 1.659
2002-06-30 4.329 1.665 5.348 1.665 9.581 1.665
2002-07-31 4.301 1.645 4.978 1.645 8.737 1.645
2002-08-31 4.605 1.527 5.311 1.527 9.005 1.527
2002-09-30 4.809 1.417 5.499 1.417 9.462 1.417
2002-10-31 4.878 1.202 5.078 1.202 9.540 1.202
2002-11-30 4.287 1.182 5.045 1.182 10.530 1.182
2002-12-31 4.398 1.148 4.806 1.148 10.029 1.148
2003-01-31 4.460 1.175 5.247 1.175 9.985 1.175
2003-02-28 4.345 1.09 5.458 1.09 10.138 1.09
2003-03-31 4.133 1.101 5.423 1.101 11.234 1.101
2003-04-30 4.128 1.085 5.645 1.085 11.957 1.085
2003-05-31 4.772 0.838 5.536 0.838 12.704 0.838
2003-06-30 5.323 0.927 5.315 0.927 13.144 0.927
2003-07-31 5.143 0.96 5.445 0.96 14.323 0.96
2003-08-31 5.707 0.926 5.652 0.926 14.464 0.926
2003-09-30 5.488 0.932 5.341 0.932 14.107 0.932
2003-10-31 6.025 0.908 5.866 0.908 15.083 0.908
2003-11-30 5.581 0.907 5.826 0.907 14.548 0.907
2003-12-31 6.060 0.897 5.969 0.897 14.039 0.897
2004-01-31 6.060 0.927 6.290 0.927 15.184 0.927
2004-02-29 5.670 0.923 6.161 0.923 14.697 0.923
2004-03-31 6.061 0.952 5.989 0.952 14.213 0.952
2004-04-30 6.281 1.052 6.298 1.052 14.807 1.052
2004-05-31 6.607 1.303 6.222 1.303 14.431 1.303
2004-06-30 6.582 1.412 6.322 1.412 14.816 1.412
2004-07-31 7.309 1.568 6.552 1.568 15.873 1.568
2004-08-31 7.050 1.674 7.028 1.674 17.302 1.674
7
⊘ This is a preview!⊘
Do you want full access?
Subscribe today to unlock all pages.
Trusted by 1+ million students worldwide
2004-09-30 7.864 1.867 6.907 1.867 19.217 1.867
2004-10-31 7.808 2.182 7.367 2.182 20.742 2.182
2004-11-30 8.282 2.182 7.367 2.182 21.790 2.182
2004-12-31 9.742 2.422 7.646 2.422 21.947 2.422
2005-01-31 9.226 2.69 7.378 2.69 21.425 2.69
2005-02-28 8.281 2.722 7.718 2.722 20.408 2.722
2005-03-31 8.612 2.837 7.675 2.837 22.460 2.837
2005-04-30 9.371 2.882 8.047 2.882 27.717 2.882
2005-05-31 9.995 3.06 7.939 3.06 29.225 3.06
2005-06-30 10.563 3.332 8.198 3.332 29.281 3.332
2005-07-31 11.487 3.43 8.879 3.43 34.954 3.43
2005-08-31 10.866 3.47 8.713 3.47 30.000 3.47
2005-09-30 11.453 3.805 8.846 3.805 31.461 3.805
2005-10-31 11.913 3.857 9.189 3.857 32.182 3.857
2005-11-30 13.511 3.985 9.553 3.985 32.290 3.985
2005-12-31 12.699 4.37 9.868 4.37 30.331 4.37
2006-01-31 14.883 4.507 10.167 4.507 30.543 4.507
2006-02-28 15.574 4.515 10.723 4.515 33.716 4.515
2006-03-31 15.005 4.65 10.148 4.65 30.217 4.65
2006-04-30 15.414 4.715 10.496 4.715 33.477 4.715
2006-05-31 14.760 4.86 9.967 4.86 30.008 4.86
2006-06-30 14.723 4.935 10.756 4.935 31.439 4.935
2006-07-31 13.623 4.905 10.603 4.905 33.550 4.905
2006-08-31 14.697 4.76 11.463 4.76 36.170 4.76
2006-09-30 14.131 4.94 11.230 4.94 35.330 4.94
2006-10-31 13.630 4.89 11.513 4.89 39.231 4.89
2006-11-30 14.029 4.885 11.881 4.885 40.254 4.885
2006-12-31 14.616 4.975 11.958 4.975 39.260 4.975
2007-01-31 16.326 4.995 12.121 4.995 41.129 4.995
2007-02-28 16.118 4.895 12.489 4.895 43.242 4.895
2007-03-31 17.221 4.725 11.770 4.725 43.540 4.725
8
Paraphrase This Document
Need a fresh take? Get an instant paraphrase of this document with our AI Paraphraser
2007-04-30 19.133 4.59 12.186 4.59 43.483 4.59
2007-05-31 20.209 4.67 11.896 4.67 42.205 4.67
2007-06-30 20.985 4.81 12.186 4.81 37.498 4.81
2007-07-31 24.333 3.99 12.485 3.99 43.177 3.99
2007-08-31 25.509 3.7 12.653 3.7 42.997 3.7
2007-09-30 23.783 3.82 11.837 3.82 41.079 3.82
2007-10-31 22.211 3.07 11.967 3.07 38.982 3.07
2007-11-30 20.501 3.14 11.335 3.14 33.252 3.14
2007-12-31 21.901 1.87 9.587 1.87 28.197 1.87
2008-01-31 20.062 1.785 9.827 1.785 27.781 1.785
2008-02-29 23.681 1.275 9.544 1.275 33.356 1.275
2008-03-31 24.370 1.34 9.448 1.34 28.665 1.34
2008-04-30 24.482 1.85 8.495 1.85 26.922 1.85
2008-05-31 22.247 1.705 7.374 1.705 28.466 1.705
2008-06-30 23.194 1.635 7.538 1.635 24.376 1.635
2008-07-31 17.367 1.69 8.509 1.69 20.479 1.69
2008-08-31 15.957 0.9 7.878 0.9 16.273 0.9
2008-09-30 17.673 0.435 6.716 0.435 16.439 0.435
2008-10-31 17.354 0.02 7.348 0.02 17.205 0.02
2008-11-30 17.388 0.115 6.377 0.115 15.521 0.115
2008-12-31 16.436 0.22 6.396 0.22 10.140 0.22
2009-01-31 18.804 0.25 7.569 0.25 16.154 0.25
2009-02-28 19.605 0.2 7.641 0.2 19.994 0.2
2009-03-31 20.425 0.125 7.641 0.125 18.901 0.125
2009-04-30 20.460 0.13 8.250 0.13 23.691 0.13
2009-05-31 22.304 0.18 9.271 0.18 26.672 0.18
2009-06-30 21.686 0.175 10.652 0.175 30.781 0.175
2009-07-31 22.680 0.13 12.202 0.13 35.622 0.13
2009-08-31 22.511 0.115 11.537 0.115 30.296 0.115
2009-09-30 24.825 0.045 11.082 0.045 29.084 0.045
2009-10-31 25.920 0.05 11.865 0.05 29.853 0.05
9
2009-11-30 23.683 0.05 11.268 0.05 30.938 0.05
2009-12-31 24.705 0.07 11.999 0.07 27.916 0.07
2010-01-31 26.202 0.115 13.151 0.115 29.143 0.115
2010-02-28 24.926 0.15 12.549 0.15 31.018 0.15
2010-03-31 23.390 0.155 11.569 0.155 26.726 0.155
2010-04-30 23.030 0.15 11.562 0.15 23.418 0.15
2010-05-31 24.540 0.17 12.333 0.17 23.469 0.17
2010-06-30 22.663 0.14 12.087 0.14 23.633 0.14
2010-07-31 23.800 0.135 12.670 0.135 22.882 0.135
2010-08-31 26.149 0.155 13.274 0.155 22.838 0.155
2010-09-30 26.660 0.11 12.124 0.11 22.365 0.11
2010-10-31 28.226 0.16 13.040 0.16 23.908 0.16
2010-11-30 27.602 0.115 13.219 0.115 26.240 0.115
2010-12-31 28.762 0.145 13.476 0.145 24.463 0.145
2011-01-31 29.043 0.135 13.297 0.135 23.643 0.135
2011-02-28 29.019 0.09 13.532 0.09 22.713 0.09
2011-03-31 28.088 0.04 12.359 0.04 21.963 0.04
2011-04-30 27.734 0.04 12.791 0.04 20.787 0.04
2011-05-31 26.227 0.015 12.111 0.015 18.339 0.015
2011-06-30 25.163 0.09 11.797 0.09 17.188 0.09
2011-07-31 22.174 0.015 11.349 0.015 15.213 0.015
2011-08-31 24.432 0.01 12.605 0.01 16.570 0.01
2011-09-30 22.571 0.005 11.570 0.005 15.392 0.005
2011-10-31 22.248 0.015 12.563 0.015 16.273 0.015
2011-11-30 24.225 0.005 13.102 0.005 17.442 0.005
2011-12-31 23.333 0.055 13.432 0.055 18.311 0.055
2012-01-31 22.859 0.075 14.234 0.075 19.891 0.075
2012-02-29 23.480 0.065 14.632 0.065 19.980 0.065
2012-03-31 21.115 0.09 12.790 0.09 18.448 0.09
2012-04-30 20.772 0.06 14.054 0.06 18.268 0.06
2012-05-31 21.089 0.08 15.018 0.08 17.551 0.08
10
⊘ This is a preview!⊘
Do you want full access?
Subscribe today to unlock all pages.
Trusted by 1+ million students worldwide
1 out of 19
Related Documents


Your All-in-One AI-Powered Toolkit for Academic Success.
+13062052269
info@desklib.com
Available 24*7 on WhatsApp / Email
![[object Object]](/_next/static/media/star-bottom.7253800d.svg)
Unlock your academic potential
Copyright © 2020–2026 A2Z Services. All Rights Reserved. Developed and managed by ZUCOL.