Report on Australian Employment Statistics for Full-Time Students

Verified

Added on  2022/08/26

|8
|1470
|13
Report
AI Summary
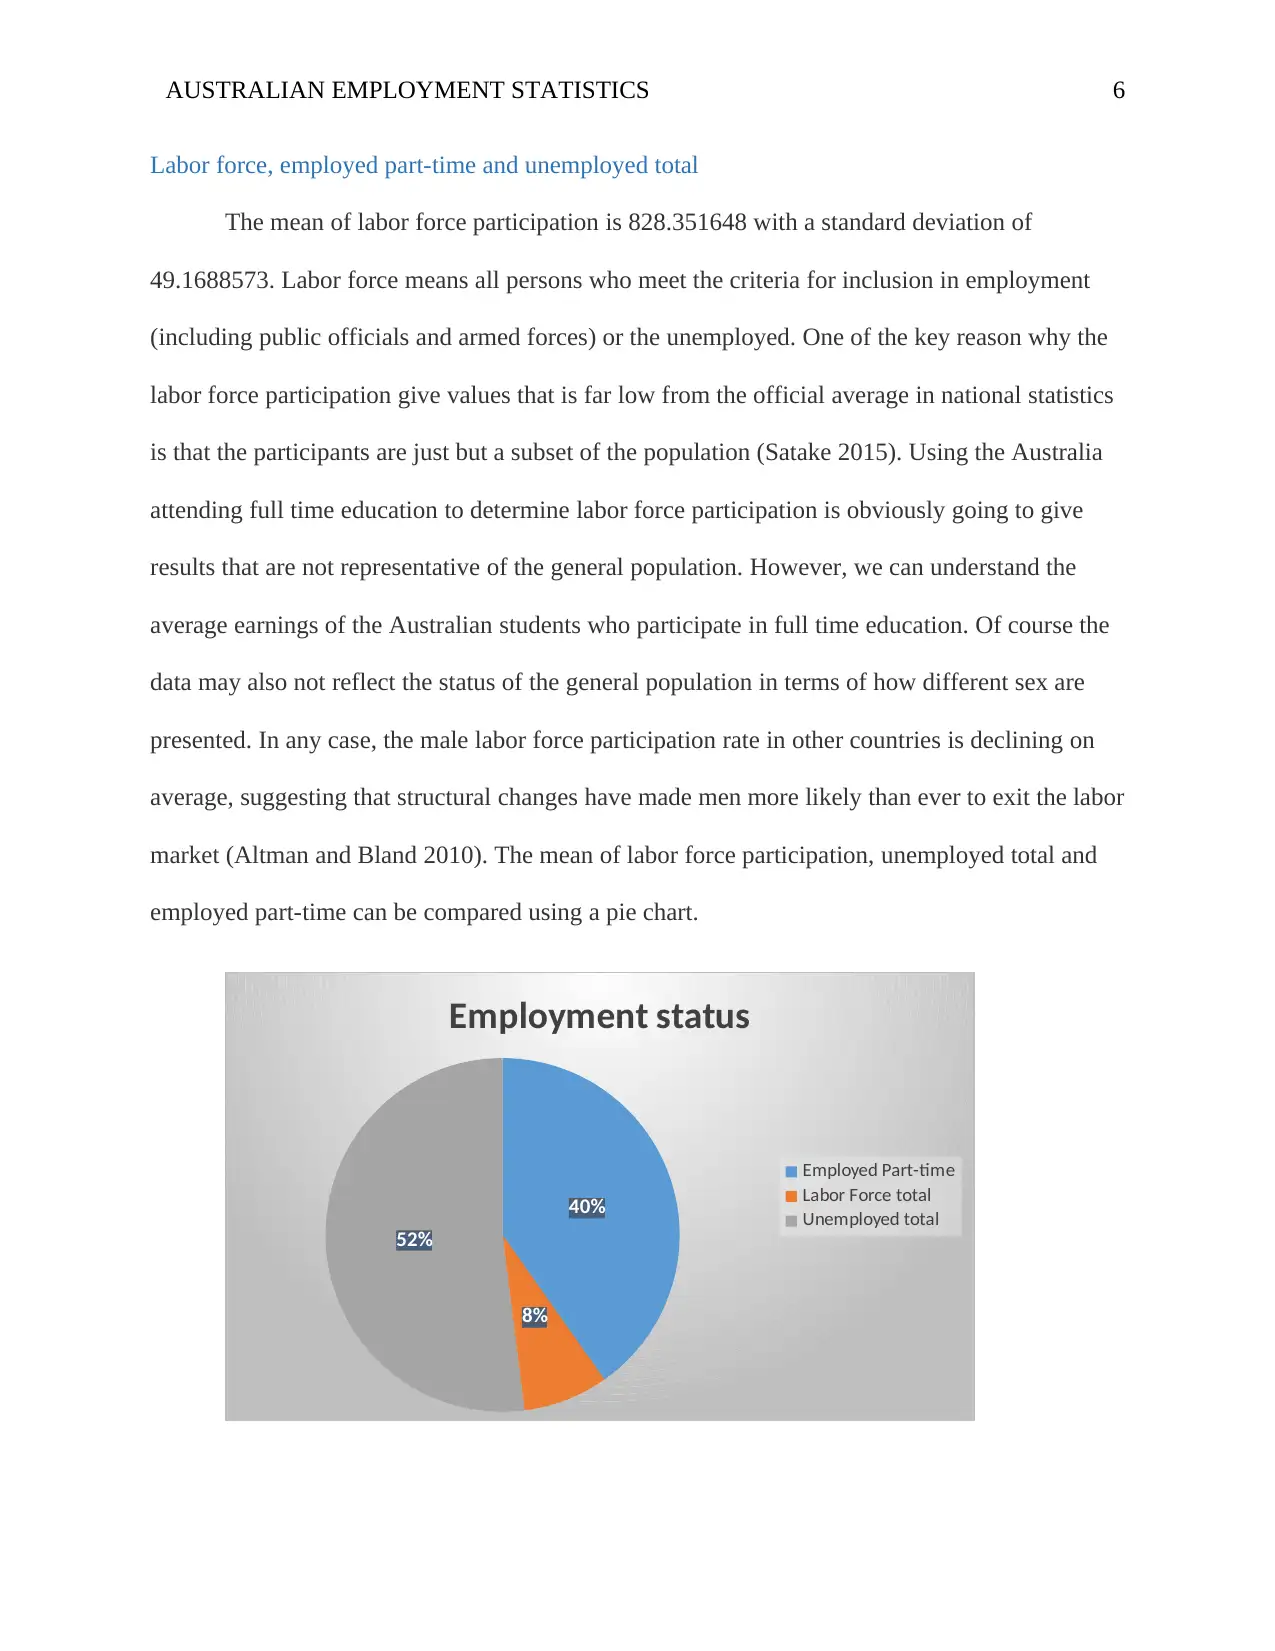
This report provides an analysis of Australian employment statistics, focusing on students enrolled in full-time education. The executive summary highlights the importance of understanding the relationship between student employment and the economy. The introduction discusses the significance of employment data, participation rates, and unemployment rates in the context of economic growth and labor market dynamics. The report analyzes statistical findings from an employment survey conducted on Australian students, examining unemployment and participation rates, labor force participation, and the impact of education on these metrics. The report also discusses the limitations of the data, such as the sample size and potential biases. It concludes by emphasizing the importance of considering the specific demographic of full-time students when analyzing employment data and the need for further research to provide a comprehensive understanding of the topic.
Document Page
Running head: AUSTRALIAN EMPLOYMENT STATISTICS
Australian Employment Statistics
Student’s Name
Institution
Date
tabler-icon-diamond-filled.svg

Paraphrase This Document

Need a fresh take? Get an instant paraphrase of this document with our AI Paraphraser
Document Page
AUSTRALIAN EMPLOYMENT STATISTICS 2
Executive summary
Understanding how Australian students manages their studies and employment could be
one way of coming up with new policies related to education and economy. Fortunately, with
statistical data it is possible to analyze employment status of Australian students who pursue full
time education and at the same time hustle for employment. The paper will analyze the statistical
findings that was obtained after an employment survey was conducted on the Australian students
studying full time programs.
Document Page
AUSTRALIAN EMPLOYMENT STATISTICS 3
Table of Contents
Executive summary.....................................................................................................................................2
Introduction.................................................................................................................................................2
Australian unemployment rate.....................................................................................................................2
Australian participation rate........................................................................................................................4
Labor force, employed part-time and unemployed total..............................................................................4
Conclusion...................................................................................................................................................5
Introduction
In most cases, when a person migrates to another country, one of the most important
reasons for doing so is to improve their economic and professional situation. For this, it is normal
to travel to a country with a healthy economy, low unemployment and continuous economic
growth. Participation rate refers to the percentage of the total working population (16 years and
over) who is employed or actively seeking employment, and the total population of the
corresponding age group. This indicator is often analysed in conjunction with the unemployment
rate , as people classified as unemployed may not be active labour market participants. On the
other hand, the unemployed may have income and participate in the economic process. This
category may include retirees who have spent savings, or students who want to gain experience
in order to enter the labor market in the future. Using the data from the Australia, the paper will
Document Page
AUSTRALIAN EMPLOYMENT STATISTICS 4
analyze the results from statistical analysis done to analyze the status of employment among the
Australian attending full time education.
Australian unemployment rate
As we all know, macroeconomic policies consist of four major goals: economic growth,
full employment, price stability and balance of payments. Therefore, the unemployment rate,
together with economic growth (GDP), price index (CPI, PPI) and balance of payments
indicators, is called the four major macro indicators. The unemployment rate is a core indicator
of the degree of utilization of labor resources in a country or region. Normally, governments of
all countries have traditionally taken the unemployment rate as an important basis for judging the
status of macroeconomic operations and the prosperity of the labor market, and then
promulgating or adjusting related macroeconomic policies and employment policies (Pike, Kuh
and Massa-McKinley, 2008). However, we ought to be cautious because the participants selected
for the study represents only one of the subsets of Australian population. The Australian
unemployment rate is at 14.6782609 +/-1.76131842. This shows that the unemployment rate lies
at 12.92% and 16.44%. This seems higher than expected given that in Australia there has been
an average uninterrupted GDP growth of 3% in the last 25 years. According to official statistics,
Australia unemployment rate has been less than 6%. However, the high unemployment rate of
14.7% could be explained by the manner in which the data was collected. In other words, we
need to consider the quality of data collected, the size of the sample and other geographic and
demographic factors associated with Australia. First, we must note that there is high likelihood
that the data is not representative because the sample is too small. Australia has a population
25,499,884 as per the recent data (Worldometer 2020). This means that using a sample of 115
participants may not give a clear picture of the Australian unemployment rate. Another factor
tabler-icon-diamond-filled.svg

Paraphrase This Document

Need a fresh take? Get an instant paraphrase of this document with our AI Paraphraser
Document Page
AUSTRALIAN EMPLOYMENT STATISTICS 5
that should be considered is that Australia is divided into eastern ( Sydney , Melbourne ,
Brisbane , etc.) and western area ( Perth ). Eastern region has more service industries while the
western region has more of industrial jobs. Perhaps the data was collected from the regions
where the unemployment rate is high. Another good explanation is that the sample used could be
biased. Only 115 people could not give a good representation of Australian population
(Manikandan 2011).
Australian participation rate
From the findings, the participation rate is 50.1322314 +/-2.32730942. This means that
at 95% confidence level, the lowest participation are is (50.1322314 - 2.32730942= 47.80%) and
that at 95% confidence level, the highest level of those who are actively seeking employment is
52.4%. On average, 50.1% of the adult population (15 years of age and over) is inserted into
economic activity, either working or looking for work. In general, socioeconomic indicators
respond to conventional parameters of work in market-oriented societies and are not necessarily
relevant to understanding the economy and well-being of indigenous peoples (Lashley, 2005).
These peoples have traditionally developed collective and family economies, based on
reciprocity and oriented mainly to subsistence, but not to capital accumulation; likewise, all
members of the family group contribute to the production of goods. One of the factors that will
reduce the labor participation rate of the school-age population is education. Since not everyone
will enter the labor market at the age of 16, when more people choose to go to high school,
university or even a master's degree, these people will naturally not be counted as employed
(Das, Mitra and Mandal 2016).
Document Page
AUSTRALIAN EMPLOYMENT STATISTICS 6
Labor force, employed part-time and unemployed total
The mean of labor force participation is 828.351648 with a standard deviation of
49.1688573. Labor force means all persons who meet the criteria for inclusion in employment
(including public officials and armed forces) or the unemployed. One of the key reason why the
labor force participation give values that is far low from the official average in national statistics
is that the participants are just but a subset of the population (Satake 2015). Using the Australia
attending full time education to determine labor force participation is obviously going to give
results that are not representative of the general population. However, we can understand the
average earnings of the Australian students who participate in full time education. Of course the
data may also not reflect the status of the general population in terms of how different sex are
presented. In any case, the male labor force participation rate in other countries is declining on
average, suggesting that structural changes have made men more likely than ever to exit the labor
market (Altman and Bland 2010). The mean of labor force participation, unemployed total and
employed part-time can be compared using a pie chart.
40%
8%
52%
Employment status
Employed Part-time
Labor Force total
Unemployed total
Document Page
AUSTRALIAN EMPLOYMENT STATISTICS 7
Conclusion
Despite the fact that most of the employment data are not appealing, it is important to
note that Australia is not an outlier in terms of economic activity. It should also be noted that the
participants are from specific segment- the Australia attending full time education. During the
financial crisis, without a significant decline in the labor force participation rate, other countries
experienced more severe economic slowdowns, and the share of manufacturing in employment
also declined more significantly
tabler-icon-diamond-filled.svg

Paraphrase This Document

Need a fresh take? Get an instant paraphrase of this document with our AI Paraphraser
Document Page
AUSTRALIAN EMPLOYMENT STATISTICS 8
List of reference
Das S., Mitra K. and Mandal M. (2016). Sample size calculation: Basic principles. Indian J
Anaesth 60:652-6.
Manikandan S. (2011). Measures of central tendency: Median and mode. J Pharmacol
Pharmacother. 2:214-5
Manikandan S. Measures of central tendency: Median and mode. J Pharmacol Pharmacother
2:214-5
Satake E. B. (2015). Statistical Methods and Reasoning for the Clinical Sciences Evidence-
Based Practice. Ist ed. San Diego: Plural Publishing, Inc.; 2015. p. 1-19
Worldometer (2020). Australia Population (LIVE). Available from
https://www.worldometers.info/world-population/australia-population/
Pike, G.R., Kuh, G.D., and Massa-McKinley, R.C. (2008). First-Year Students’ Employment,
Engagement, and Academic Achievement: Untangling the Relationship Between Work and
Grades. Journal of Student Affairs Research and Practice, 45(4): 560–582.
Lashley, C. (2005). Student employment patterns in Nottingham’s tourism sector; a research
report for East Midlands tourism, Centre for Leisure Retaining, Nottingham Trent University.
chevron_up_icon
1 out of 8
circle_padding
hide_on_mobile
zoom_out_icon
[object Object]