Analyzing Housing Preferences of International Students in Australia
VerifiedAdded on  2020/04/21
|12
|1613
|61
AI Summary
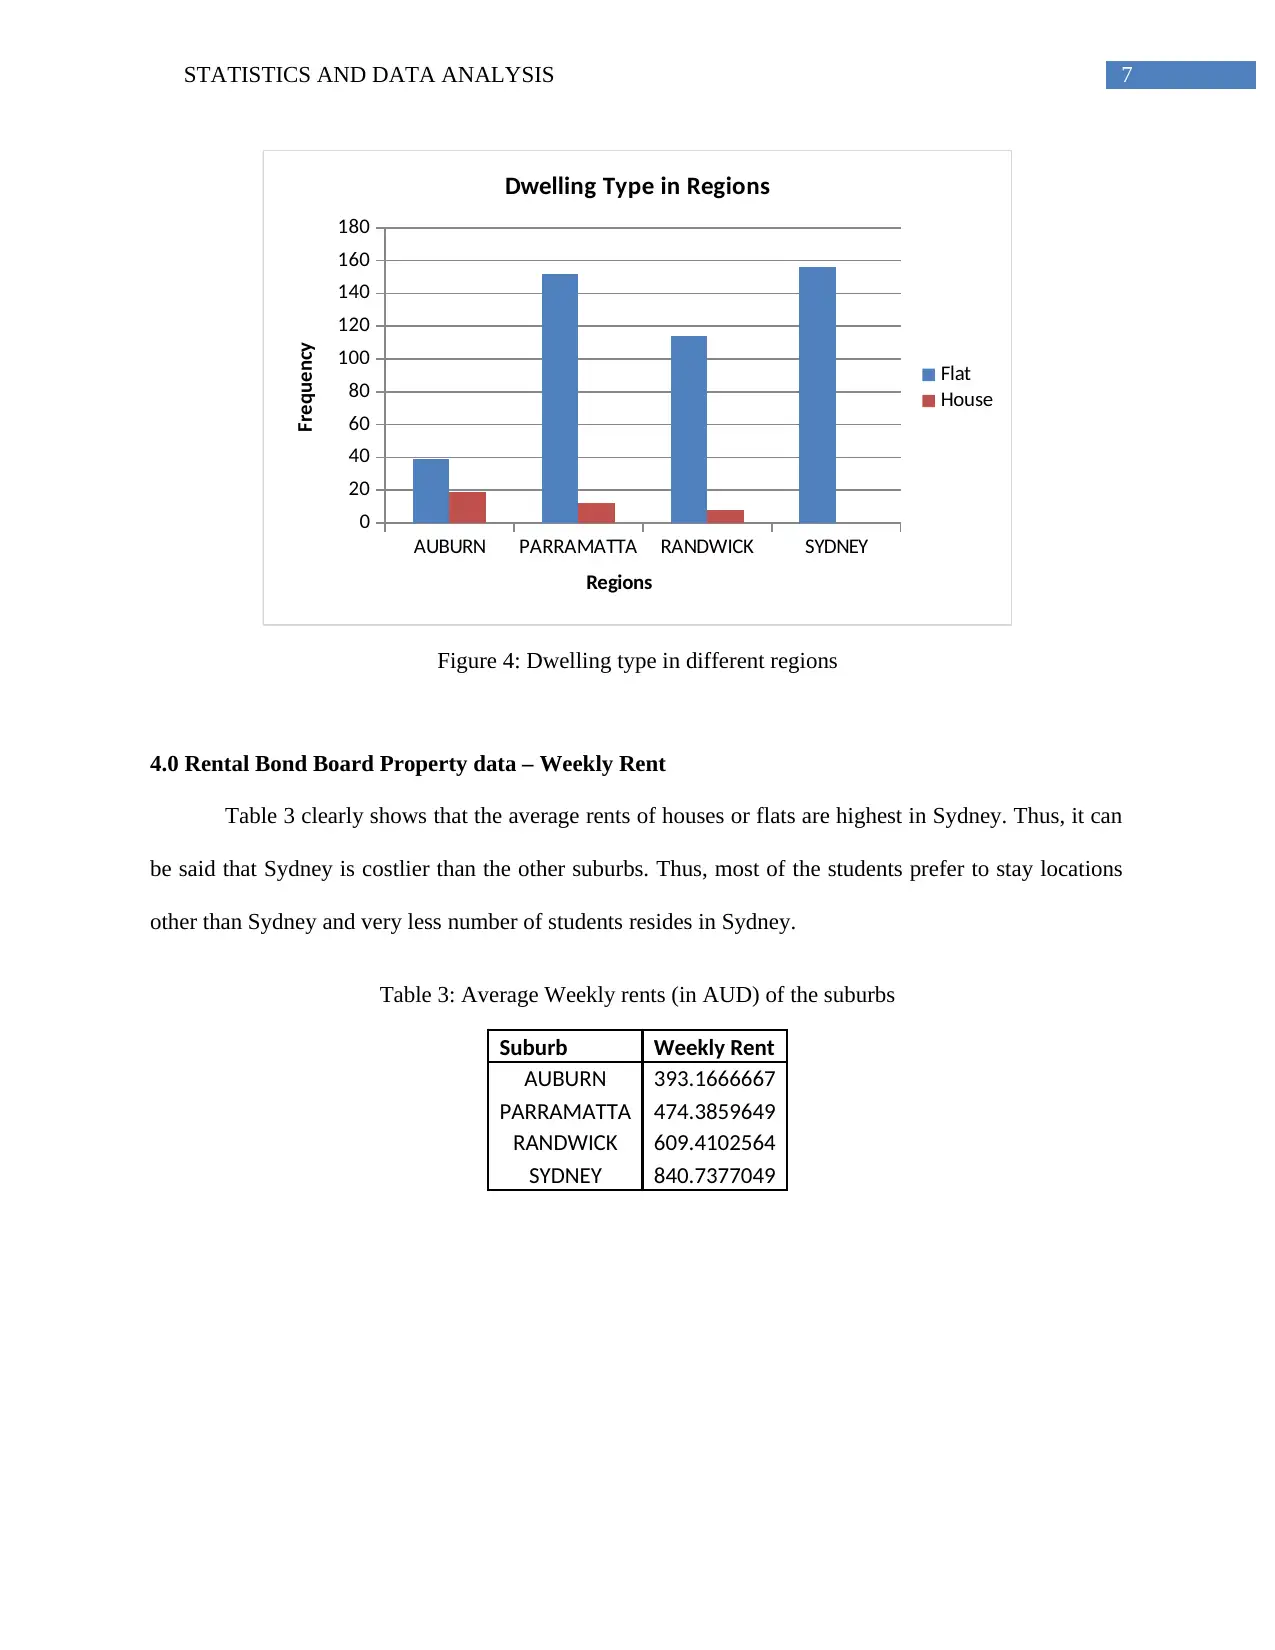
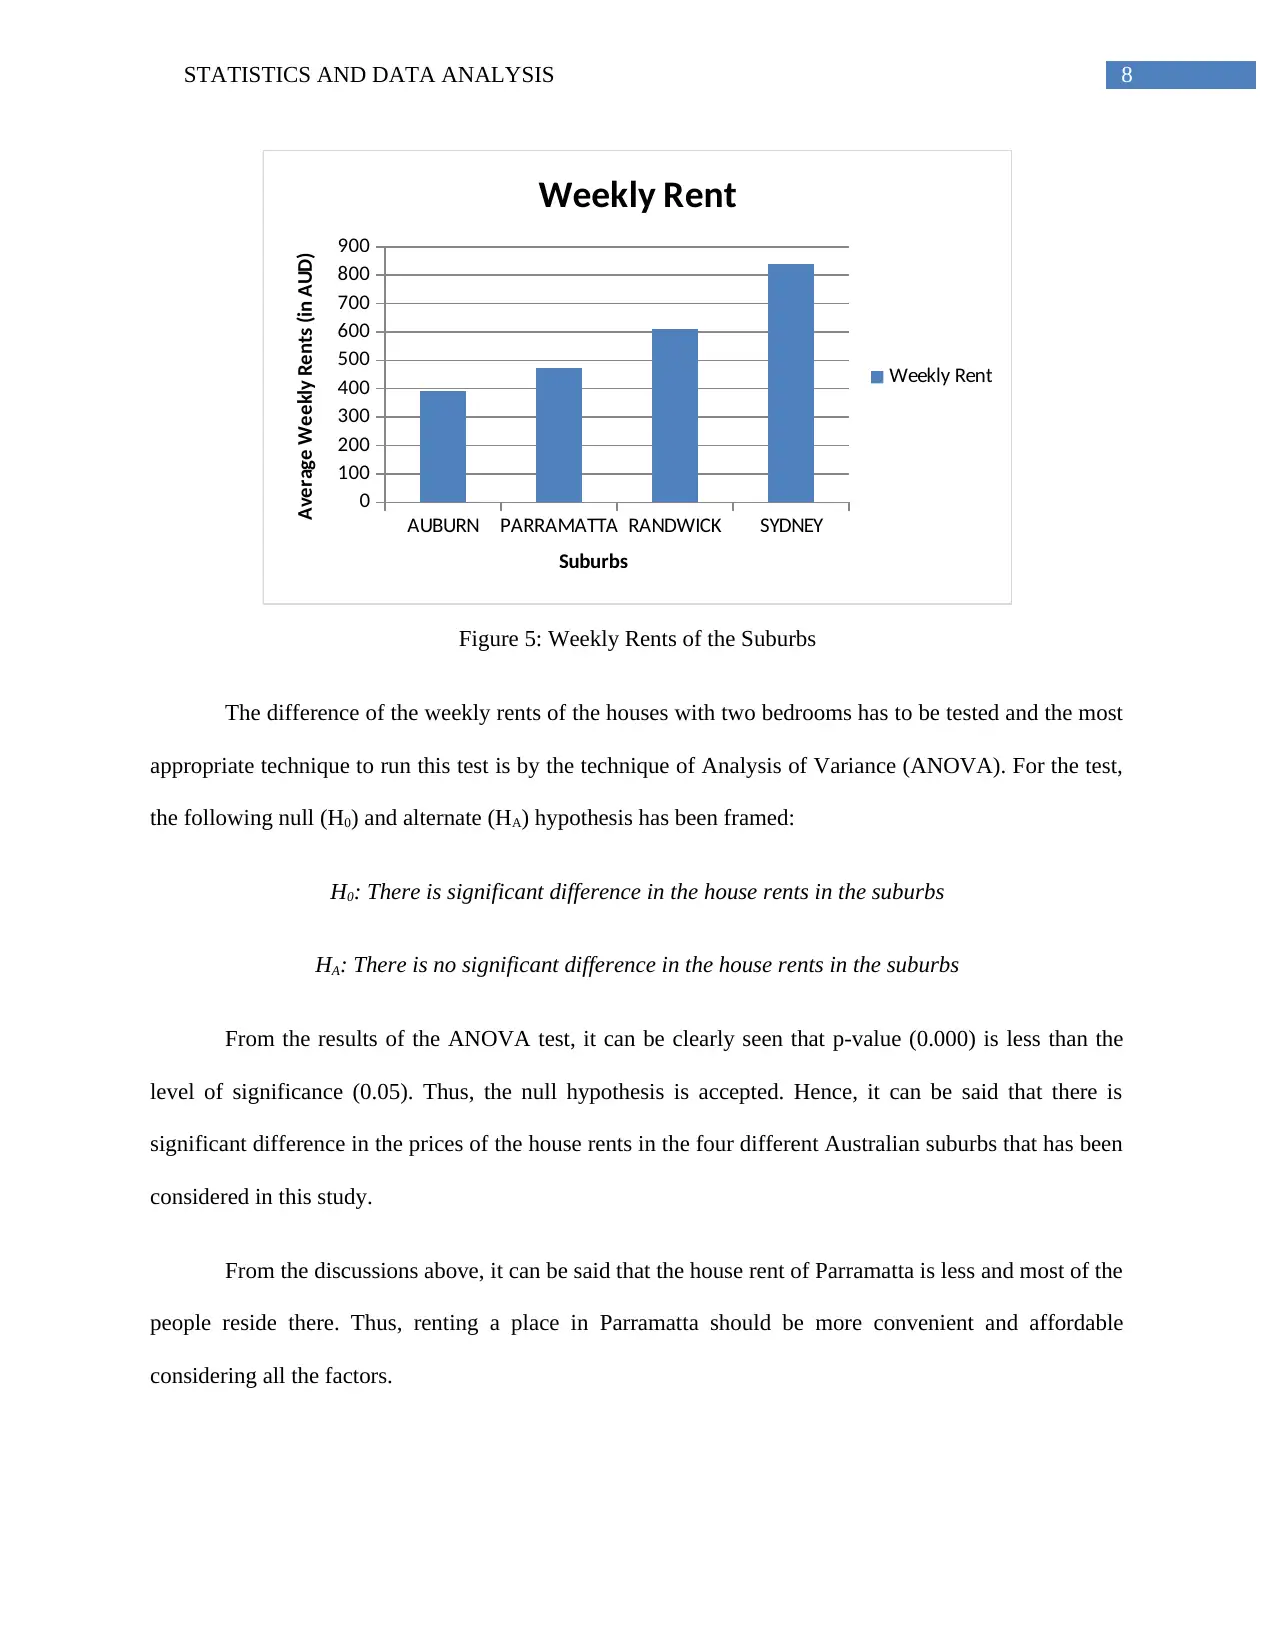
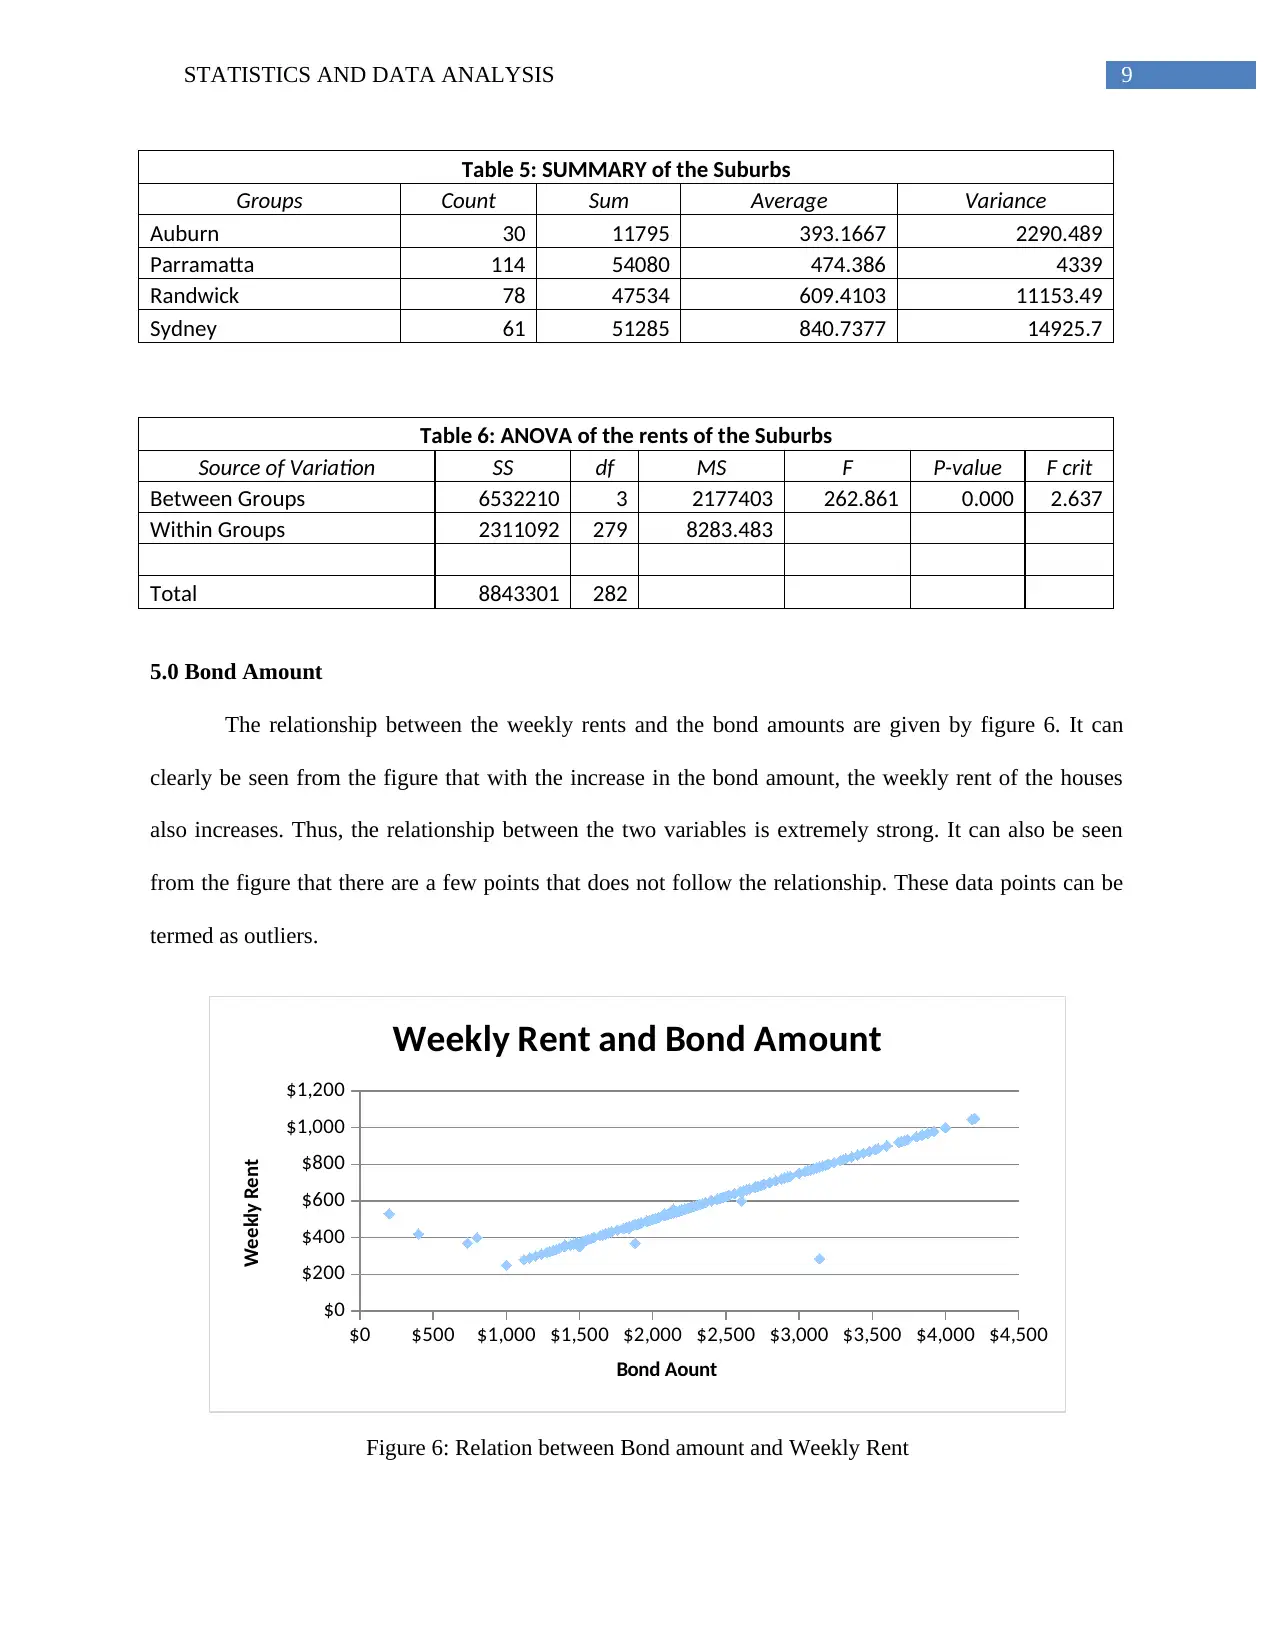
The study investigates how international students select residences in Australian suburbs like Sydney and Parramatta, analyzing rental costs without evident preference patterns. It was found that housing rents are highest in Sydney compared to other areas and that Parramatta is more affordable, leading many students to prefer it due to economic factors. The analysis also examines the relationship between bond amounts and weekly rents, highlighting a strong correlation. Further research suggestions include studying how age and origin might affect student preferences for dwelling areas and suburbs, considering diverse economic backgrounds.

Running Head: STATISTICS AND DATA ANALYSIS
Statistics and Data Analysis
Name of the Student
Name of the University
Author Note
Statistics and Data Analysis
Name of the Student
Name of the University
Author Note
Paraphrase This Document
Need a fresh take? Get an instant paraphrase of this document with our AI Paraphraser

1STATISTICS AND DATA ANALYSIS
Table of Contents
1.0 Introduction..............................................................................................................................................2
1.1 Background and Overview..................................................................................................................2

2STATISTICS AND DATA ANALYSIS
1.0 Introduction
1.1 Background and Overview
There are a lot of people around the world who are interested to relocate to Australia on a
temporary or permanent basis and this Australian company is a service and facility provider to those
clients. They help the clients in choosing the most reasonable and budget friendly. The major clients of
the company are the international students. Sydney, Randwick, Parramatta and Auburn are the four major
suburbs of the Sydney metro and most of the students aim for these locations. Thus, the rents of the
households or apartments of these suburbs are analyzed. This will help the clients in having an idea about
the rents and thus, offering them rates by the company will become easier. Negotiation with the property
owners can also be done with the help of these.
1.2 International Students Dataset
The weekly rents paid by 40 international students residing in the Australian suburbs of Auburn,
Parramatta, Randwick and Sydney have been recorded for the purpose of the analysis. The students were
selected randomly and information has been collected from the students directly. The random sampling
technique implies unbiasedness of the data and the data so collected is primary. Weekly rent is also a
continuous variable.
1.3 Rental Bond Dataset
The second dataset containing information about the rental bond has been collected from the
NSW Rental Bonds data that was published by the department of Finance, Services and Innovation. This
is a secondary data as it collected from the website. The variables involved in this dataset are Bond
Amount (quantitative and continuous variable), Weekly Rent (quantitative and continuous variable),
Dwelling Type (qualitative variable, nominal), number of bedrooms (quantitative and discrete variable),
⊘ This is a preview!⊘
Do you want full access?
Subscribe today to unlock all pages.

Trusted by 1+ million students worldwide

3STATISTICS AND DATA ANALYSIS
postcode (ordinal data) and suburb (qualitative and nominal). Table 1 shows the first five samples of the
dataset that has been considered.
Table 1: First five samples of the Rental Bonds data
2.0 International Students’ Weekly Rent
Graphically a boxplot as shown in figure 1 represents the five-point summary of the data on
weekly rents of the international students. The summary of the data on weekly rent is given in table 2.
Table 2 shows that the standard deviation is quite high and thus it can be said the rents are not
close to $256.43. In fact, the rents are scattered between $91 and $448 a week. The boxplot shows that the
rents are equally distributed all over. There is no preference of the students for a higher priced or lower
Paraphrase This Document
Need a fresh take? Get an instant paraphrase of this document with our AI Paraphraser

4STATISTICS AND DATA ANALYSIS
priced location from the data collected. The data will be said to have an outlier if any data point lies
outside the following range of values:
((Q1 – 1.5 * (Q3 – Q1)), (Q3+ 1.5 * (Q3 – Q1)) = (-43.9, 555.1).
From the dataset, it has been observed that there are 18 outliers to the dataset.
0
50
100
150
200
250
300
350
Boxplot of Amount
Weekly Rent
Amount (in AUD)
Figure 2: Five point summary o weekly rent
3.0 Rental Bond Board Property Data – Dwelling Type
The percentage of students residing in a flat or a house is shown clearly from figure 3. Only 8%
of the students only reside in houses whereas, the remaining 82% prefer flats. Thus, flats can be said to be
more convenient and affordable for the students.

5STATISTICS AND DATA ANALYSIS
92%
8%
Dwelling Type
Flat
House
Figure 3: Pie chart showing the dwelling type of students
In order to test the proportion of students residing in houses is less than 10%, the most
appropriate test that can be used is the one-sample z-test. The results of the test are given below and it
clearly states that the proportion is more than 10%.
⊘ This is a preview!⊘
Do you want full access?
Subscribe today to unlock all pages.

Trusted by 1+ million students worldwide

6STATISTICS AND DATA ANALYSIS
It can be seen clearly from figure 4 that most of the students prefer to stay in flats than houses.
Thus, it can be said that flats are more convenient than the houses since most of them prefer apartments.
It can be seen clearly from figure 4 that most of the students prefer to stay in flats than houses.
Thus, it can be said that flats are more convenient than the houses since most of them prefer apartments.
Paraphrase This Document
Need a fresh take? Get an instant paraphrase of this document with our AI Paraphraser

7STATISTICS AND DATA ANALYSIS
AUBURN PARRAMATTA RANDWICK SYDNEY
0
20
40
60
80
100
120
140
160
180
Dwelling Type in Regions
Flat
House
Regions
Frequency
Figure 4: Dwelling type in different regions
4.0 Rental Bond Board Property data – Weekly Rent
Table 3 clearly shows that the average rents of houses or flats are highest in Sydney. Thus, it can
be said that Sydney is costlier than the other suburbs. Thus, most of the students prefer to stay locations
other than Sydney and very less number of students resides in Sydney.
Table 3: Average Weekly rents (in AUD) of the suburbs
Suburb Weekly Rent
AUBURN 393.1666667
PARRAMATTA 474.3859649
RANDWICK 609.4102564
SYDNEY 840.7377049

8STATISTICS AND DATA ANALYSIS
AUBURN PARRAMATTA RANDWICK SYDNEY
0
100
200
300
400
500
600
700
800
900
Weekly Rent
Weekly Rent
Suburbs
Average Weekly Rents (in AUD)
Figure 5: Weekly Rents of the Suburbs
The difference of the weekly rents of the houses with two bedrooms has to be tested and the most
appropriate technique to run this test is by the technique of Analysis of Variance (ANOVA). For the test,
the following null (H0) and alternate (HA) hypothesis has been framed:
H0: There is significant difference in the house rents in the suburbs
HA: There is no significant difference in the house rents in the suburbs
From the results of the ANOVA test, it can be clearly seen that p-value (0.000) is less than the
level of significance (0.05). Thus, the null hypothesis is accepted. Hence, it can be said that there is
significant difference in the prices of the house rents in the four different Australian suburbs that has been
considered in this study.
From the discussions above, it can be said that the house rent of Parramatta is less and most of the
people reside there. Thus, renting a place in Parramatta should be more convenient and affordable
considering all the factors.
⊘ This is a preview!⊘
Do you want full access?
Subscribe today to unlock all pages.

Trusted by 1+ million students worldwide

9STATISTICS AND DATA ANALYSIS
Table 5: SUMMARY of the Suburbs
Groups Count Sum Average Variance
Auburn 30 11795 393.1667 2290.489
Parramatta 114 54080 474.386 4339
Randwick 78 47534 609.4103 11153.49
Sydney 61 51285 840.7377 14925.7
Table 6: ANOVA of the rents of the Suburbs
Source of Variation SS df MS F P-value F crit
Between Groups 6532210 3 2177403 262.861 0.000 2.637
Within Groups 2311092 279 8283.483
Total 8843301 282
5.0 Bond Amount
The relationship between the weekly rents and the bond amounts are given by figure 6. It can
clearly be seen from the figure that with the increase in the bond amount, the weekly rent of the houses
also increases. Thus, the relationship between the two variables is extremely strong. It can also be seen
from the figure that there are a few points that does not follow the relationship. These data points can be
termed as outliers.
$0 $500 $1,000 $1,500 $2,000 $2,500 $3,000 $3,500 $4,000 $4,500
$0
$200
$400
$600
$800
$1,000
$1,200
Weekly Rent and Bond Amount
Bond Aount
Weekly Rent
Figure 6: Relation between Bond amount and Weekly Rent
Paraphrase This Document
Need a fresh take? Get an instant paraphrase of this document with our AI Paraphraser

10STATISTICS AND DATA ANALYSIS
6.0 Conclusion
It can be concluded that the preference of the clients towards selecting residences does not
depend on any factors. The weekly distribution of the rent has given a clear idea about this issue. The
rents of the apartments are highest in Sydney than the other three. It can also be said that the clients would
prefer residing in Parramatta as the suburb is cheaper compared to the others and most of the people tend
to stay in that place.
The preference of the dwelling areas and suburbs according to the age group of the clients can be
studied. Another aspect that can be important in this study is the origin of the students. The students from
all the parts of the world do not belong to the same economic condition. Thus, depending on the
economic condition of the clients, the preference of stay of the students may differ. Thus, further this
study can be extended by considering these subdivisions in the dataset.

11STATISTICS AND DATA ANALYSIS
Bibliography
Best, J.W. and Kahn, J.V., 2016. Research in education. Pearson Education India.
Chandrakantha, L., 2014. Visualizing and Understanding Confidence Intervals and Hypothesis Testing
Using Excel Simulation. Electronic Journal of Mathematics & Technology, 8(3).
DeMaris, A. and Selman, S.H., 2013. Testing a Hypothesis. In Converting Data into Evidence (pp. 23-
37). Springer New York.
Konasani, V.R. and Kadre, S., 2015. Testing of hypothesis. In Practical business analytics using SAS (pp.
261-293). Apress.
Landwehr, J.R., 2017. Analysis of Variance. Handbook of Market Research, pp.1-33.
Mulholland, H. and Jones, C.R., 2013. Fundamentals of statistics. Springer.
Pett, M.A., 2015. Nonparametric statistics for health care research: Statistics for small samples and
unusual distributions. Sage Publications.
Rossi, P.H., Wright, J.D. and Anderson, A.B. eds., 2013. Handbook of survey research. Academic Press.
Saisana, M., 2014. Analysis of Variance. Encyclopedia of Quality of Life and Well-Being Research,
pp.162-165.
Triola, M.F., 2013. Elementary statistics using Excel. Pearson.
⊘ This is a preview!⊘
Do you want full access?
Subscribe today to unlock all pages.

Trusted by 1+ million students worldwide
1 out of 12
Related Documents
Your All-in-One AI-Powered Toolkit for Academic Success.
 +13062052269
info@desklib.com
Available 24*7 on WhatsApp / Email
Unlock your academic potential
Copyright © 2020–2025 A2Z Services. All Rights Reserved. Developed and managed by ZUCOL.


