PHE1AHR Assignment 2: Alcohol Use and Trends in Australian Schools
VerifiedAdded on 2023/06/04
|9
|1997
|342
Report
AI Summary
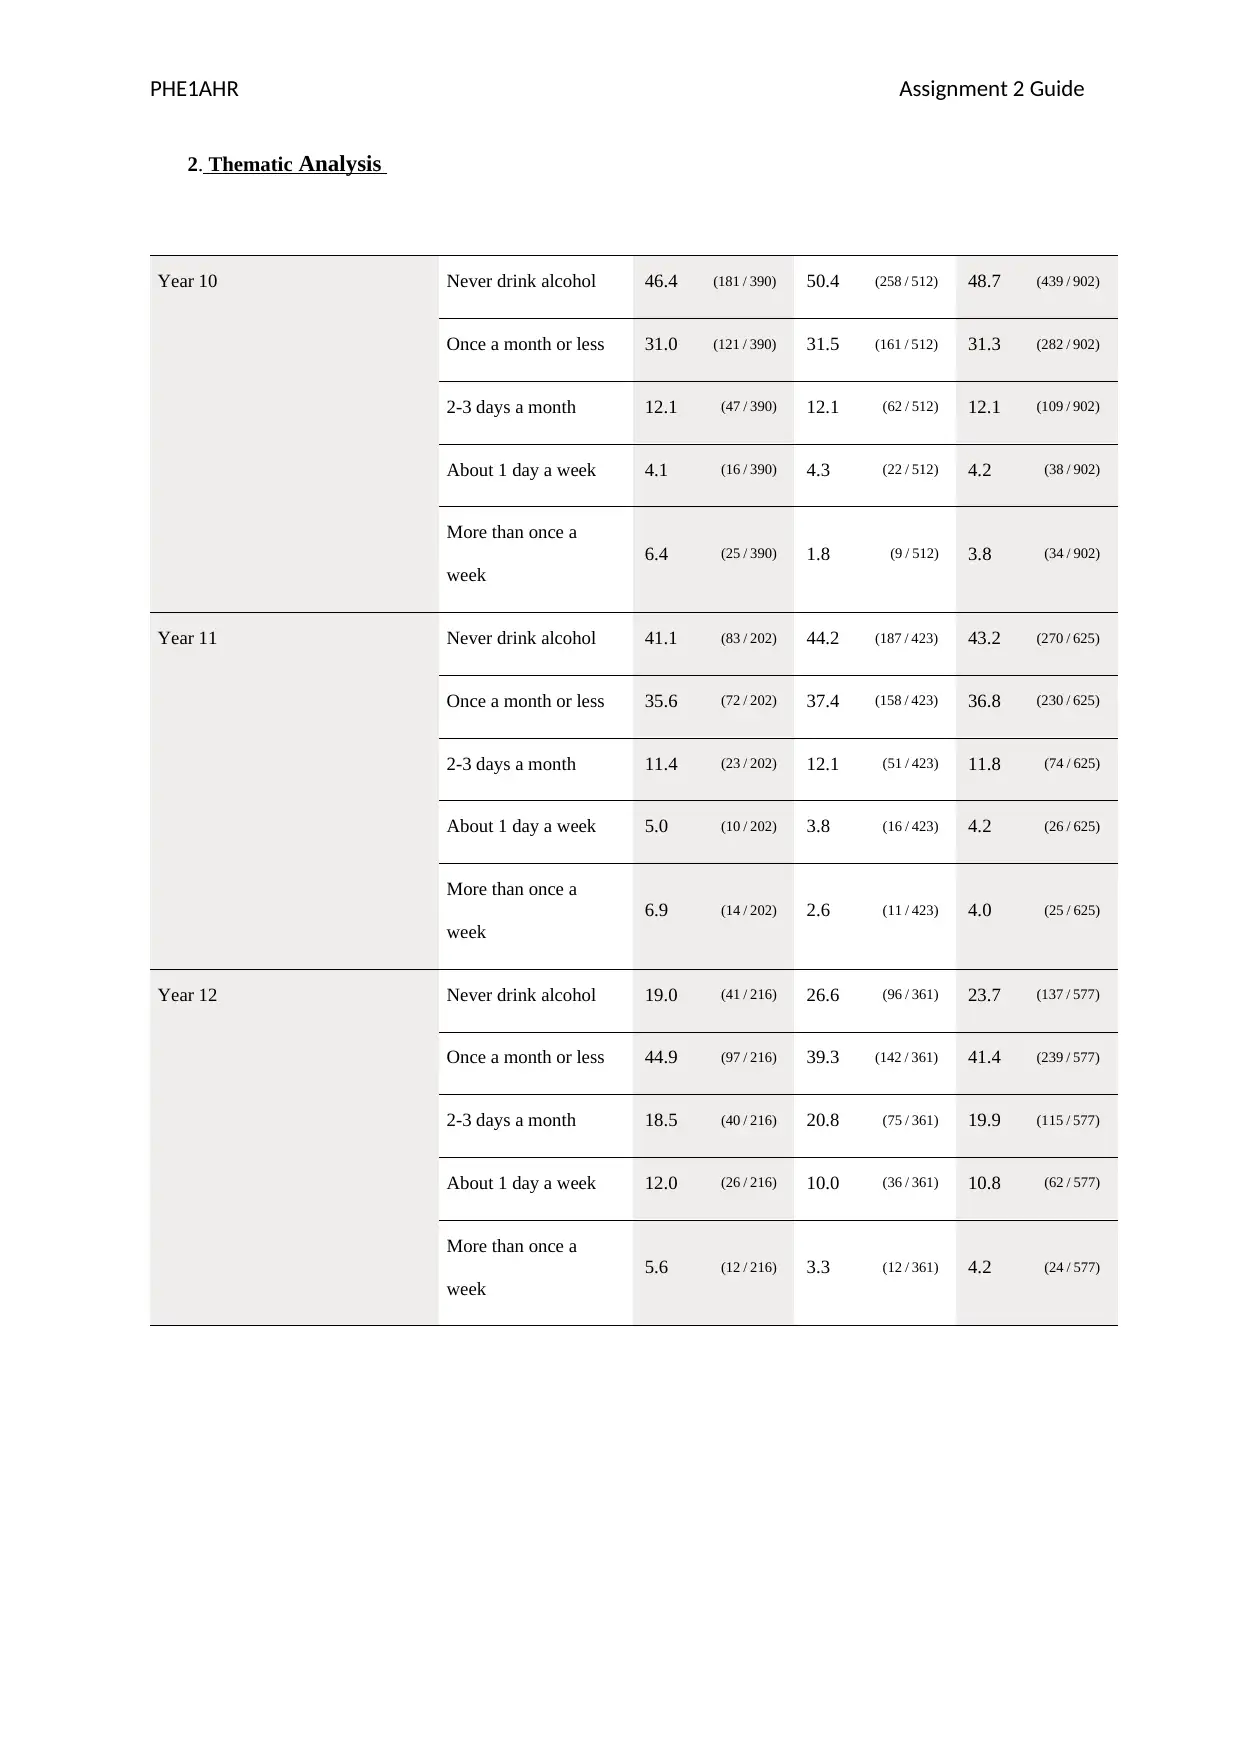
This report examines alcohol consumption and its impact on secondary school students in Australia, focusing on students in years 10, 11, and 12. It analyzes data from the National Survey of Australian Secondary Students and Sexual Health 2013 (NSASSH) to assess the prevalence, frequency, and patterns of alcohol use. The study involved both school-based and online surveys, gathering data on student demographics and drinking habits. The results indicate that a significant percentage of students consume large quantities of alcohol when they drink, with notable differences between male and female students. The report also discusses study limitations, such as sample size and recruitment methods, and suggests future research directions. It concludes by emphasizing the need for teachers and parents to provide guidance and counseling to students regarding alcohol use.

PHE1AHR Assignment 2 Guide
TITLE
Author: written by Cherine Saraya
Student ID: 19327287
Affiliation: Department of Public Health, La Trobe University
TITLE
Author: written by Cherine Saraya
Student ID: 19327287
Affiliation: Department of Public Health, La Trobe University
Paraphrase This Document
Need a fresh take? Get an instant paraphrase of this document with our AI Paraphraser

PHE1AHR Assignment 2 Guide
Abstract
Alcohol consumption and abuse among secondary students in Australia are major concerns not only to
the education administration but also to the parents in overall. This paper prevails to estimate the
prevalence of alcohol usage and the influence on the performance among secondary school students.
The paper also evaluates the existence of any significance relationship of alcohol usage on
psychological well-being and the induced behavioral problems the students among schools that
admitted both males and females based on the year 10, 11 and 12. The pattern of alcohol consumption
was also analysed on different approaches for inferences (Cross et al. 2009). The participants of the
year 10, 11 and 12 were allowed to take part in the survey and filled out a self-reporting substance use
tool which measures the prevalence, frequency, and the general patterns of the alcohol consumption by
the students. Based on the results, it was observed that when students drank they commonly consumed
large quantities of alcohol. Thirty-seven per cent of the sample reported consuming ‘3 or more
drinks’ on a day when they have an alcoholic drink (62% of those students who drank alcohol).
Twenty-one per cent of young men (33% of male students who drank alcohol) and 11% of young
women (19% of female students who drank alcohol) reported consuming ‘seven or more drinks’ on a
day when they drank.
Therefore based on these findings both teachers and parents have an added burden of playing an
active role in guidance and counselling the secondary students who are using consuming alcohol
which is a pandemic affecting most of the secondary schools not only in Australia but also globally.
Key Words
Alcohol consumption, High School students, Australia, drinking.
Contents
Abstract.................................................................................................................................................1

PHE1AHR Assignment 2 Guide
Key Words.............................................................................................................................................1
Introduction...........................................................................................................................................2
Methods.................................................................................................................................................2
Results...................................................................................................................................................3
Discussion.............................................................................................................................................3
Appendices............................................................................................................................................3
Reference...............................................................................................................................................5
⊘ This is a preview!⊘
Do you want full access?
Subscribe today to unlock all pages.

Trusted by 1+ million students worldwide

PHE1AHR Assignment 2 Guide
Introduction
There has been a recent report in the media that was conducted by researchers at LTU regarding
sexual health. Alcohol and drug use among secondary students has become a very attentive
subject and has triggered fears within parents on the basis of this topic. The use of alcohol
consumption is very common within teenagers, though it is concerning to acknowledge the
frequency of alcohol use that these underage teens experience. This report is to address relevant
data with additional analysis based on year 10, 11 and 12 students and will hence overlook the
concerning topic in regards to including research questions such as “How do drinking patterns,
in terms of frequency of alcoholic drinks vary for all students in years 10, 11 and 12 and for
male and female students in Years 10, 11 and 12?” “Are any observed differences statistically
significant?” “Considering the qualitative data available, what are possible explanations for
drinking behaviours in Year 12 students?” These research questions will allow for greater
analysis to be performed on this topic. The data provided of the research was sourced from a
random sample of students in years 10, 11 and 12 across all states in Australia and also based
on a focus group with just Year 12 students (Mitchell et al. 2014).
The aim and objectives of this research report is to create an evidence-based report that contains
analysis of data to further inform teachers and parents of the frequency of alcohol use of their
students.
Methods
The participants recruited in this research consisted of male and female students in the year levels 10,
11 and 12 of various schools around the states of Australia. Although this experiment was particularly
targeted at high school level students, this research was exclusive to those students who did not
provide a valid response when asked for their gender. A total of 2,136 students within the states of
Paraphrase This Document
Need a fresh take? Get an instant paraphrase of this document with our AI Paraphraser

PHE1AHR Assignment 2 Guide
Australia participated in this study. 63.7% (n=1,361) of students completed the school-based survey
and 36.3% (n=775) of the final sample participated in the recruited online survey. The National
Survey of Australian Secondary Students and Sexual Health 2013 (NSASSH) used various techniques
to recruit the students used for this study. One of the methods used was sending out an “expression of
interest” letter to participate in the study to those schools that have been previously sampled from the
2008 study. During the 2008 study, schools were randomly selected to participate. 62 principals of the
686 letters sent out replied back with their interest in the study. Another method used to recruit
students was via online such as Facebook Advertising. As a result, a total of 26 schools across all
school types (Government, Independent and Catholic) were recruited for the school-based surveys and
a total of 415 schools across all school types were recruited for recruited online survey (ROS). These
were two surveys that were conducted in different settings; school-based and online and were asked a
set of questions consisting of 8 different sections relating to sex, drugs and alcohol and therefore used
as a rationale to claim how frequently alcohol is consumed amongst the youth. Dichotomous data
The variables used for the recruitment method was dichotomous and ordinal variables. Dichotomous
being in relation to the gender (female/male) asked as well as how the recruited method was
conducted (recruited online/recruited through school) and ordinal variable being what year levels the
student was in (Year 10, 11 or 12). The data released from the survey conducted by the students was
also ordinal data as there were questions asked relating to the frequency of alcohol use of any kind
and the number of drinks on a day that a student had an alcoholic drink. . Consequently, for this work
we have analysed the data obtained as one sample, irrespective of recruitment method or method of
data collection.

PHE1AHR Assignment 2 Guide
Results
Discussion
Study Limitations and future directions
It was difficult to obtain a better sample size of the schools willing to participate in the survey despite
the methodology adopted for the study. This resulted into low rates of participation since some
affected schools were not surveyed.
There was a drawback associated with the online recruitment of the participants that were of years 10,
11 and 12 who were enrolled at various Australian Secondary Schools. This is evident from the fact
that not all completions were done by people concerned and also, there was lack of control conditions
in which the students completed the survey since the methodology adopted was unrestricted.
Moreover, the generalization of the results may have been affected by the application of recruitment
rather than sampling technique.
Appendices
1. Chi-Square
2.
⊘ This is a preview!⊘
Do you want full access?
Subscribe today to unlock all pages.

Trusted by 1+ million students worldwide

PHE1AHR Assignment 2 Guide
2. Thematic Analysis
Year 10 Never drink alcohol 46.4 (181 / 390) 50.4 (258 / 512) 48.7 (439 / 902)
Once a month or less 31.0 (121 / 390) 31.5 (161 / 512) 31.3 (282 / 902)
2-3 days a month 12.1 (47 / 390) 12.1 (62 / 512) 12.1 (109 / 902)
About 1 day a week 4.1 (16 / 390) 4.3 (22 / 512) 4.2 (38 / 902)
More than once a
week
6.4 (25 / 390) 1.8 (9 / 512) 3.8 (34 / 902)
Year 11 Never drink alcohol 41.1 (83 / 202) 44.2 (187 / 423) 43.2 (270 / 625)
Once a month or less 35.6 (72 / 202) 37.4 (158 / 423) 36.8 (230 / 625)
2-3 days a month 11.4 (23 / 202) 12.1 (51 / 423) 11.8 (74 / 625)
About 1 day a week 5.0 (10 / 202) 3.8 (16 / 423) 4.2 (26 / 625)
More than once a
week
6.9 (14 / 202) 2.6 (11 / 423) 4.0 (25 / 625)
Year 12 Never drink alcohol 19.0 (41 / 216) 26.6 (96 / 361) 23.7 (137 / 577)
Once a month or less 44.9 (97 / 216) 39.3 (142 / 361) 41.4 (239 / 577)
2-3 days a month 18.5 (40 / 216) 20.8 (75 / 361) 19.9 (115 / 577)
About 1 day a week 12.0 (26 / 216) 10.0 (36 / 361) 10.8 (62 / 577)
More than once a
week
5.6 (12 / 216) 3.3 (12 / 361) 4.2 (24 / 577)
Paraphrase This Document
Need a fresh take? Get an instant paraphrase of this document with our AI Paraphraser

PHE1AHR Assignment 2 Guide
Reference
Cross, D., Shaw, T., Hearn, L., Epstein, M., Monks, H., Lester, L., & Thomas, L. (2009). Australian
Covert Bullying Prevalence Study (ACBPS). Child Health Promotion Research Centre, Edith Cowan
University, Perth.
Drouin, M., and Landgraff, C. (2012). Texting, sexting, and attachment in college students’ romantic
relationships. Computers in Human Behavior. 28, 444-449.
Herold, E. S., & Goodwin, M. S. (1981). Adamant virgins, potential no virgins and no virgins.
Journal of Sex Research, 17(2), 97-113.
Hillier, L., Jones, T., Monagle, M., Overton, N., Gahan, L., Blackman, J. & Mitchell, A. (2010)
Writing Themselves In 3: The third national study on the sexual health and wellbeing of same sex
attracted and gender questioning young people. Australian Research Centre in Sex, Health & Society
Monograph Series No. 78. Melbourne.
Lenhart, A. (2009). Teens and Sexting: Pew Research Centre.
http://www.pewinternet. Org / ~ / media / / Files / Reports / 2009 /
PIP_Teens_and_Sexting.pdf
Mitchell, A., Patrick, K., Heywood, W., Blackman, P., & Pitts, M. (2014). National survey of
Australian secondary students and sexual health 2013. Melbourne: Australian Research
Centre in Sex Health and Society & La Trobe University.
Miller, B. C., Norton, M. C., Fan, X., & Christopher son, C. R. (2008). Pubertal development,
parental communication, and sexual values in relation to adolescent sexual behaviors. The Journal of
Early Adolescence, 18(1), 27-52.
Social Media, Social Life: How Teens View Their Digital Lives (2012). Common Sense Media.
http://www.commonsensemedia.org / research / social-media-social-life

PHE1AHR Assignment 2 Guide
Sprecher, S., & Regan, P. C. (2006). College virgins: How men and women perceive their sexual
status. Journal of Sex Research, 33(1), 3-15.
Sprecher, S., & Regan, P. C. (2006). College virgins: How men and women perceive their sexual
status. Journal of Sex Research, 33(1), 3-15.
⊘ This is a preview!⊘
Do you want full access?
Subscribe today to unlock all pages.

Trusted by 1+ million students worldwide
1 out of 9
Related Documents

Your All-in-One AI-Powered Toolkit for Academic Success.
+13062052269
info@desklib.com
Available 24*7 on WhatsApp / Email
Unlock your academic potential
Copyright © 2020–2025 A2Z Services. All Rights Reserved. Developed and managed by ZUCOL.