Report on Statistical Analysis of Australian Taxation Data
VerifiedAdded on 2020/05/16
|16
|2432
|58
Report
AI Summary
This report analyzes Australian taxation data, focusing on taxpayer lodgement methods. The study examines the proportions of taxpayers using tax agents versus self-preparing, including a comparison of international students. Statistical methods, including confidence intervals and hypothesis testing, are used to compare these proportions. The report investigates the relationship between lodgement methods and age groups using a chi-square test. Furthermore, a descriptive analysis of income and deductions based on lodgement methods is presented, including regression analysis to predict deductions from income. The findings reveal significant differences in lodgement preferences between Australian taxpayers and international students, as well as associations between age, income, and the choice of lodgement method.
Running head: STATISTICS AND DATA ANALYSIS
Statistics and data analysis
Name of the student
Name of the university
Author’s note
Statistics and data analysis
Name of the student
Name of the university
Author’s note
Paraphrase This Document
Need a fresh take? Get an instant paraphrase of this document with our AI Paraphraser
1STATISTICS AND DATA ANALYSIS
Table of Contents
Section 1..........................................................................................................................................2
Section 2..........................................................................................................................................2
Section 3..........................................................................................................................................3
Section 4..........................................................................................................................................6
Section 5..........................................................................................................................................8
Section 6........................................................................................................................................11
Section 7: Conclusion....................................................................................................................13
References......................................................................................................................................15
2STATISTICS AND DATA ANALYSIS
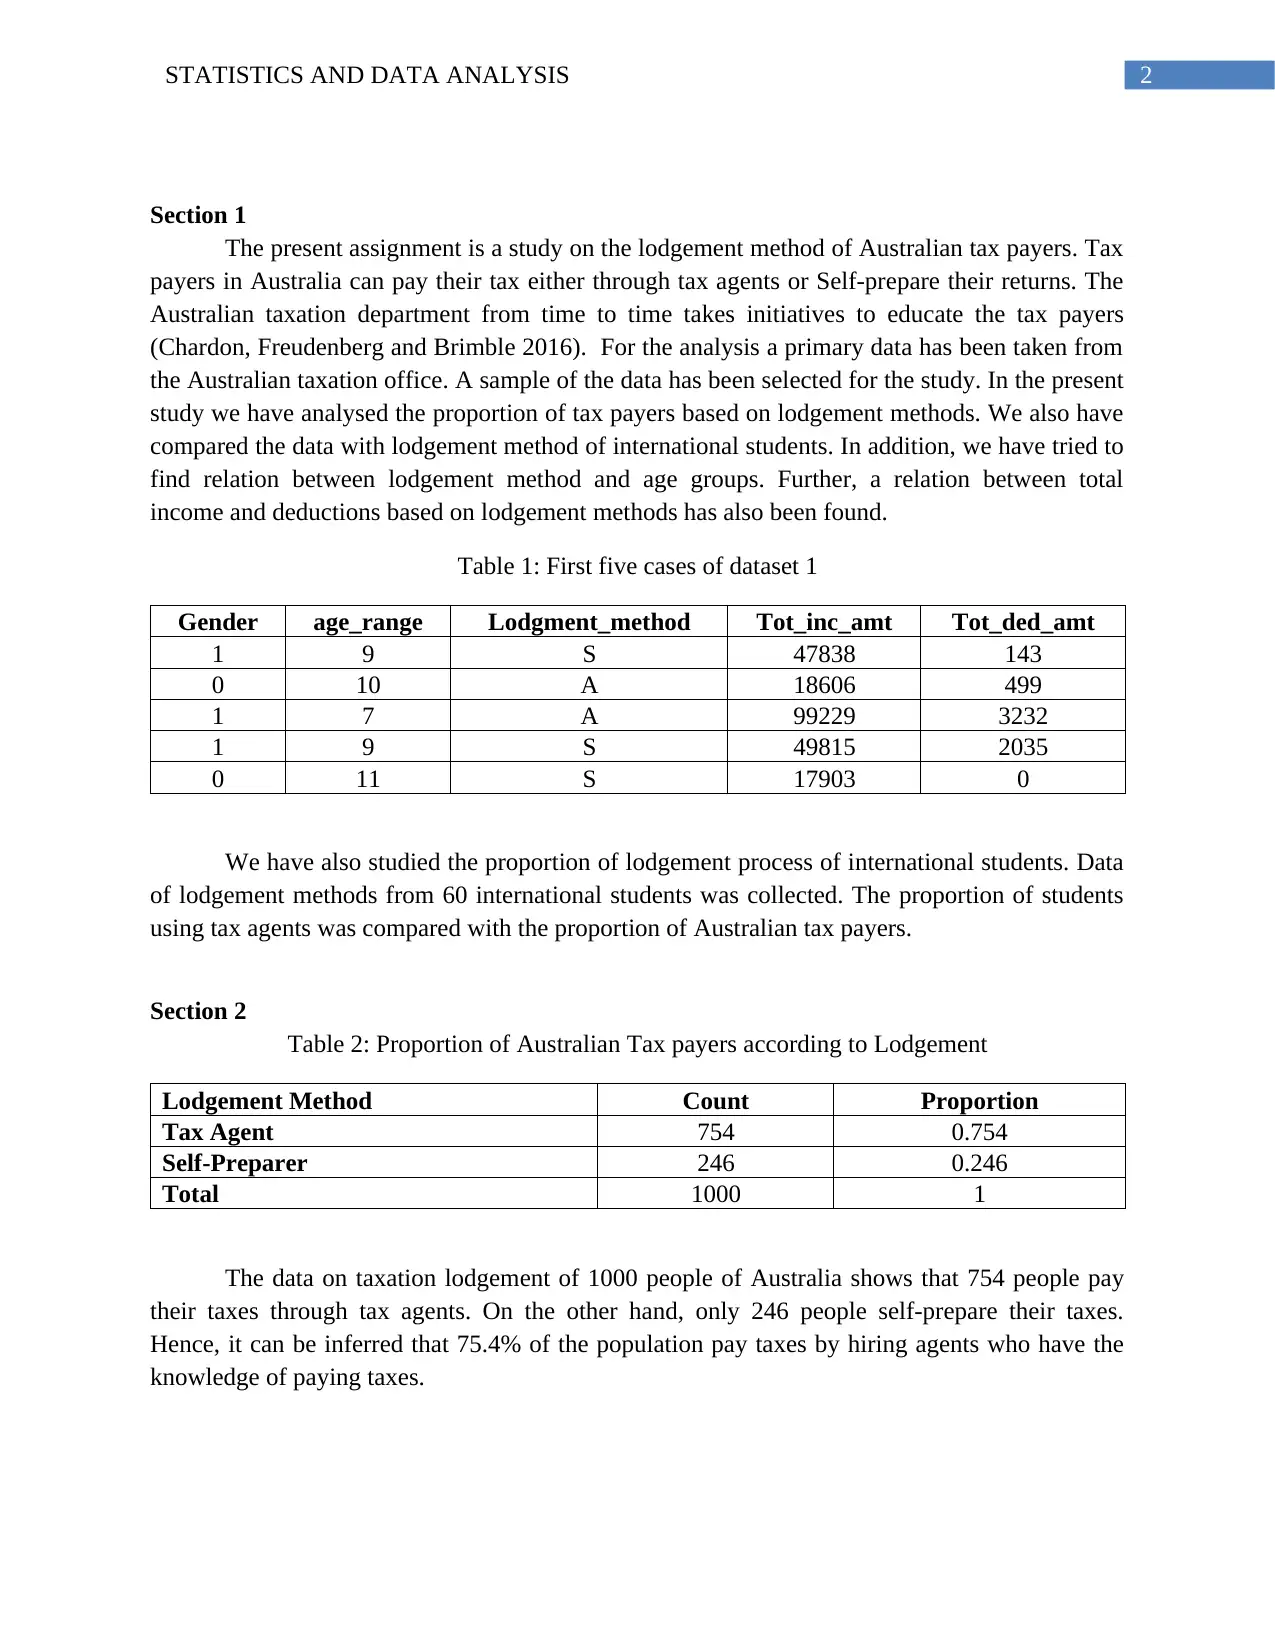
Section 1
The present assignment is a study on the lodgement method of Australian tax payers. Tax
payers in Australia can pay their tax either through tax agents or Self-prepare their returns. The
Australian taxation department from time to time takes initiatives to educate the tax payers
(Chardon, Freudenberg and Brimble 2016). For the analysis a primary data has been taken from
the Australian taxation office. A sample of the data has been selected for the study. In the present
study we have analysed the proportion of tax payers based on lodgement methods. We also have
compared the data with lodgement method of international students. In addition, we have tried to
find relation between lodgement method and age groups. Further, a relation between total
income and deductions based on lodgement methods has also been found.
Table 1: First five cases of dataset 1
Gender age_range Lodgment_method Tot_inc_amt Tot_ded_amt
1 9 S 47838 143
0 10 A 18606 499
1 7 A 99229 3232
1 9 S 49815 2035
0 11 S 17903 0
We have also studied the proportion of lodgement process of international students. Data
of lodgement methods from 60 international students was collected. The proportion of students
using tax agents was compared with the proportion of Australian tax payers.
Section 2
Table 2: Proportion of Australian Tax payers according to Lodgement
Lodgement Method Count Proportion
Tax Agent 754 0.754
Self-Preparer 246 0.246
Total 1000 1
The data on taxation lodgement of 1000 people of Australia shows that 754 people pay
their taxes through tax agents. On the other hand, only 246 people self-prepare their taxes.
Hence, it can be inferred that 75.4% of the population pay taxes by hiring agents who have the
knowledge of paying taxes.
⊘ This is a preview!⊘
Do you want full access?
Subscribe today to unlock all pages.
Trusted by 1+ million students worldwide
3STATISTICS AND DATA ANALYSIS
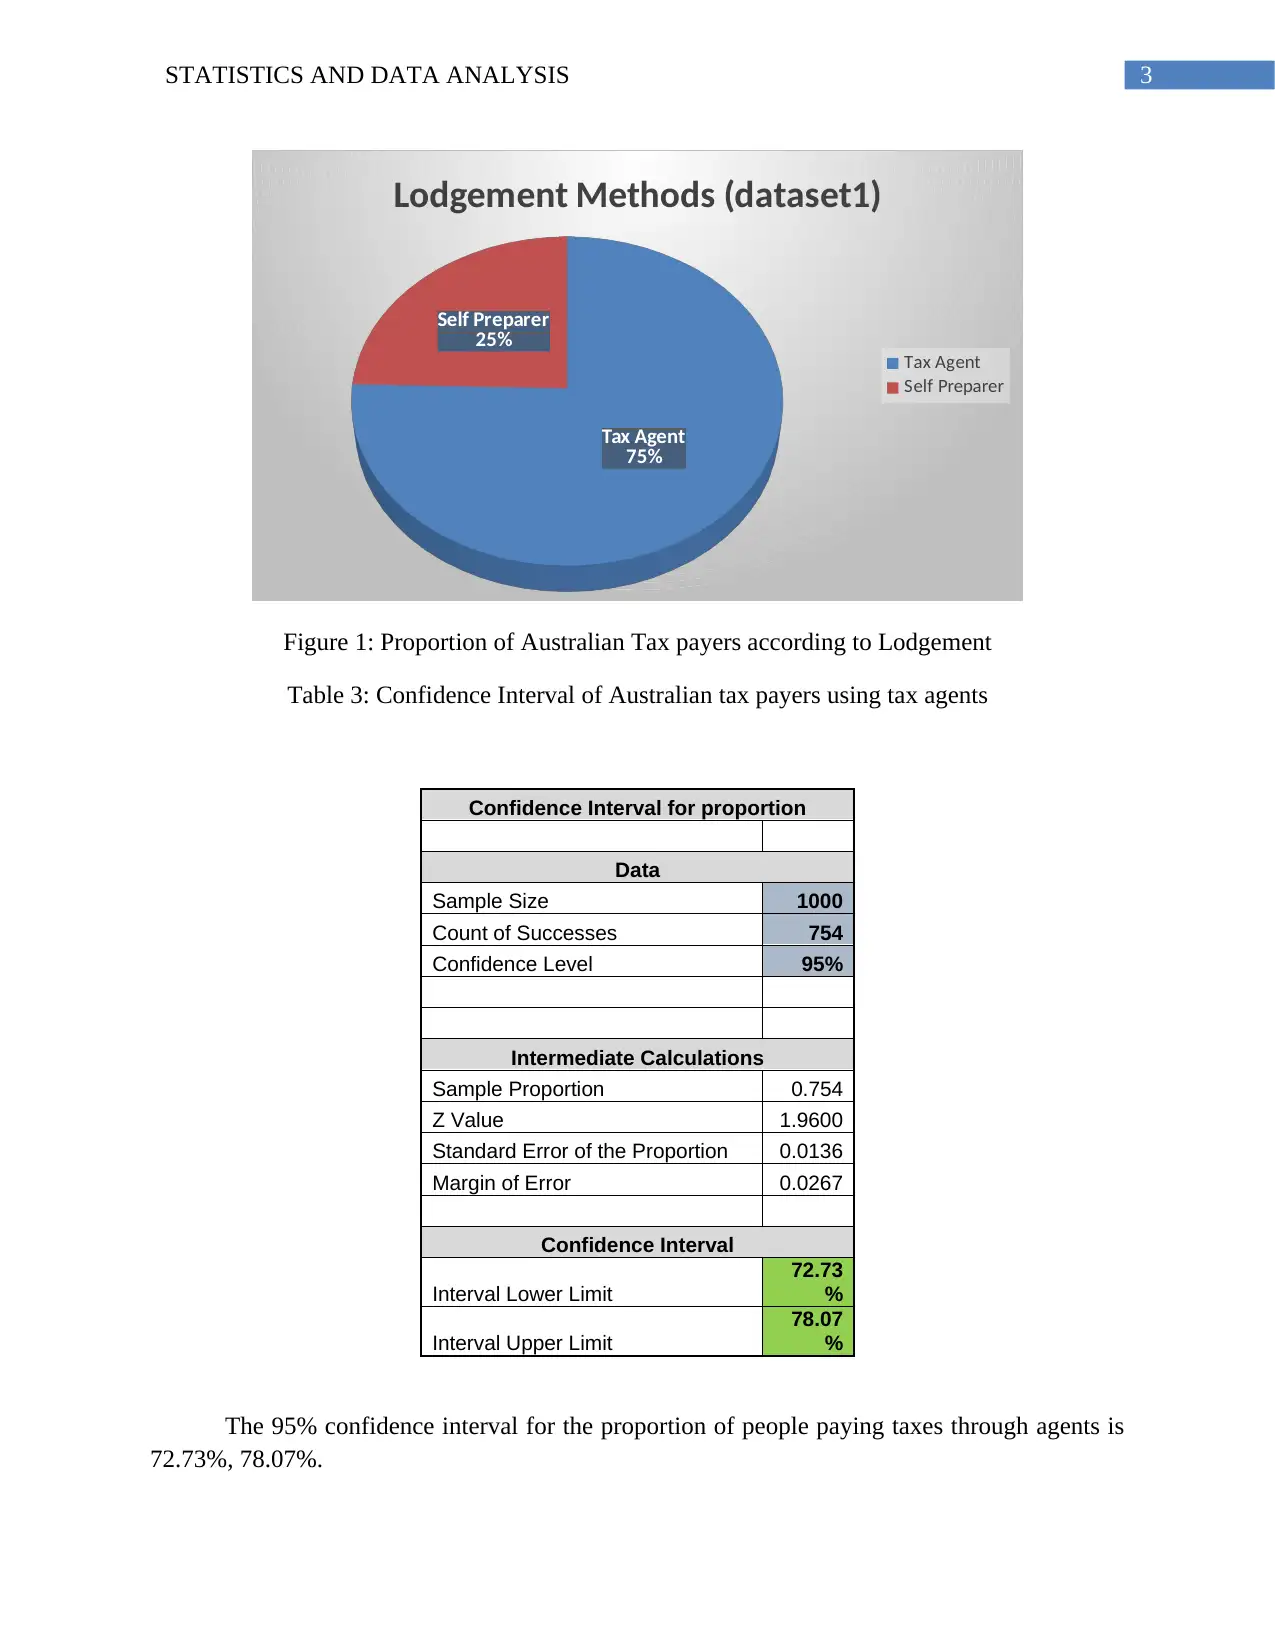
Tax Agent
75%
Self Preparer
25%
Lodgement Methods (dataset1)
Tax Agent
Self Preparer
Figure 1: Proportion of Australian Tax payers according to Lodgement
Table 3: Confidence Interval of Australian tax payers using tax agents
Confidence Interval for proportion
Data
Sample Size 1000
Count of Successes 754
Confidence Level 95%
Intermediate Calculations
Sample Proportion 0.754
Z Value 1.9600
Standard Error of the Proportion 0.0136
Margin of Error 0.0267
Confidence Interval
Interval Lower Limit
72.73
%
Interval Upper Limit
78.07
%
The 95% confidence interval for the proportion of people paying taxes through agents is
72.73%, 78.07%.
Tax Agent
75%
Self Preparer
25%
Lodgement Methods (dataset1)
Tax Agent
Self Preparer
Figure 1: Proportion of Australian Tax payers according to Lodgement
Table 3: Confidence Interval of Australian tax payers using tax agents
Confidence Interval for proportion
Data
Sample Size 1000
Count of Successes 754
Confidence Level 95%
Intermediate Calculations
Sample Proportion 0.754
Z Value 1.9600
Standard Error of the Proportion 0.0136
Margin of Error 0.0267
Confidence Interval
Interval Lower Limit
72.73
%
Interval Upper Limit
78.07
%
The 95% confidence interval for the proportion of people paying taxes through agents is
72.73%, 78.07%.
Paraphrase This Document
Need a fresh take? Get an instant paraphrase of this document with our AI Paraphraser
4STATISTICS AND DATA ANALYSIS
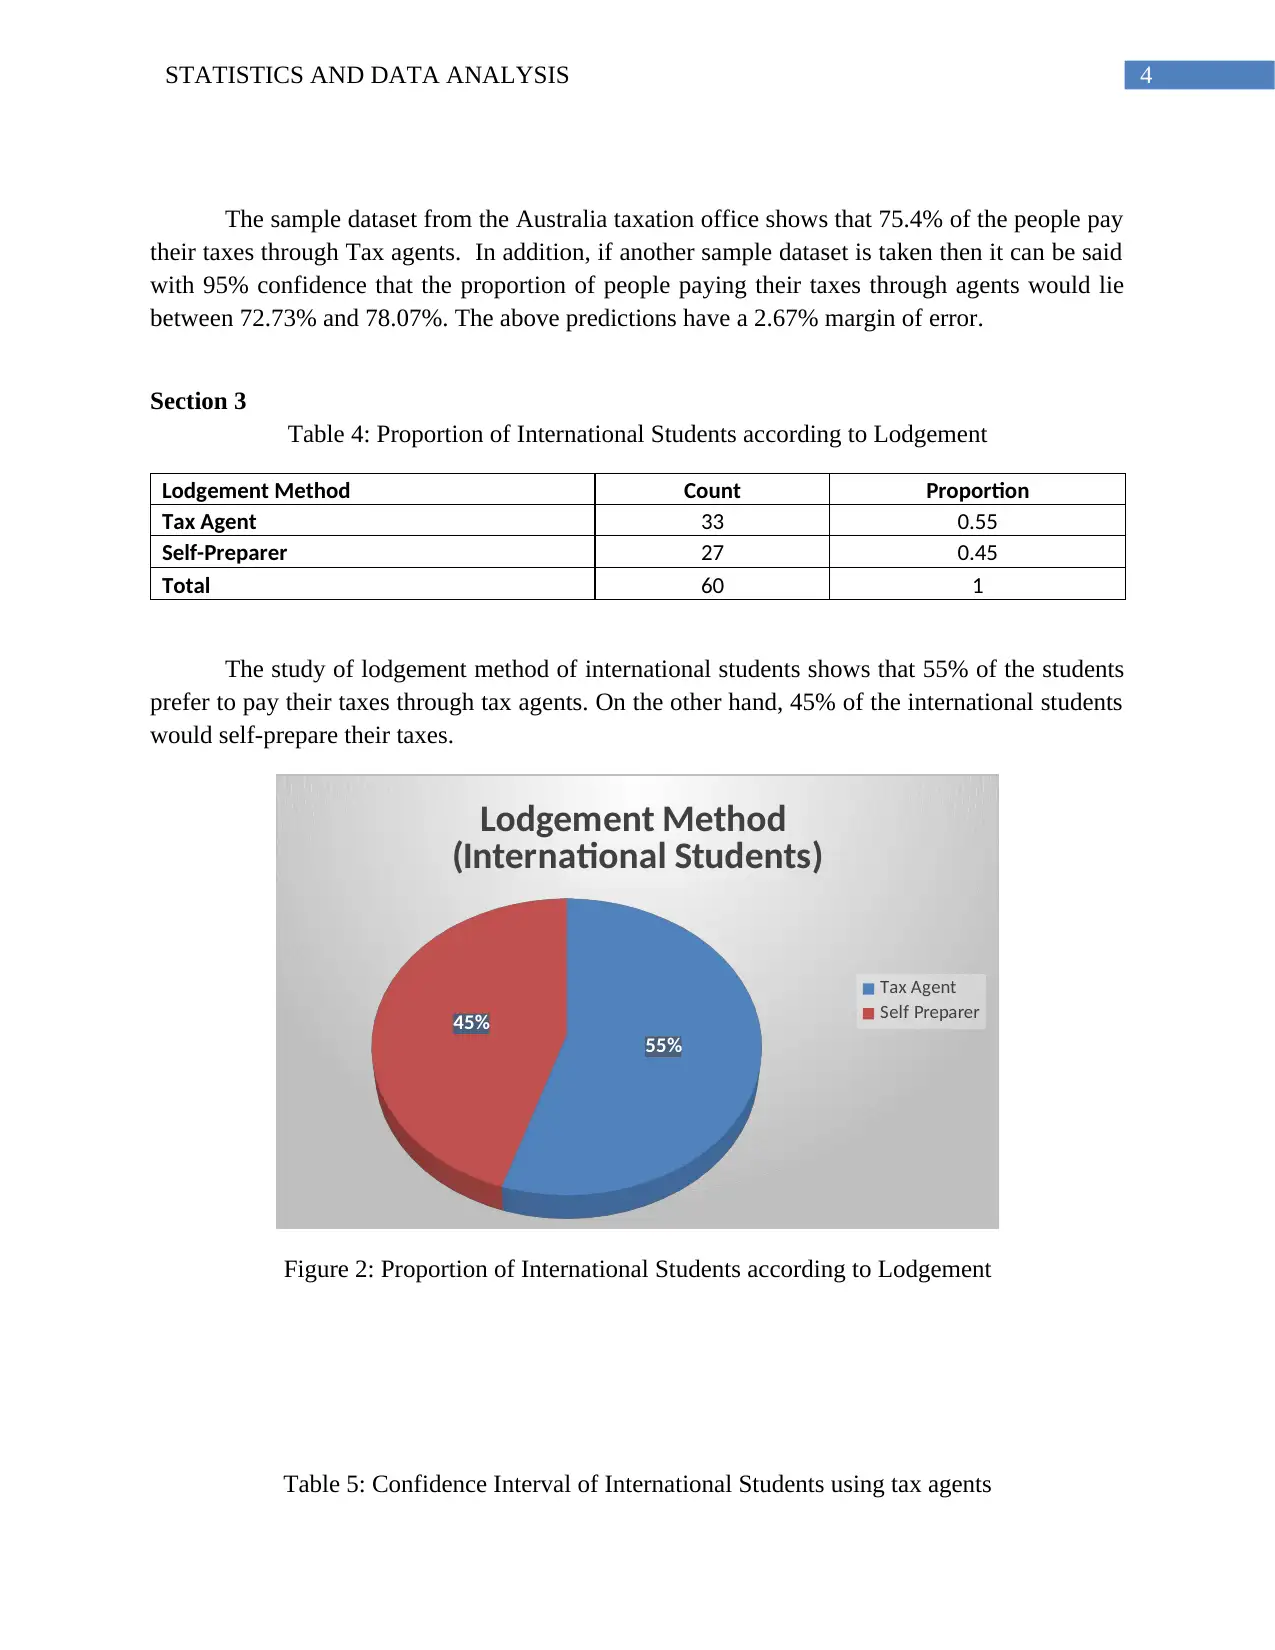
The sample dataset from the Australia taxation office shows that 75.4% of the people pay
their taxes through Tax agents. In addition, if another sample dataset is taken then it can be said
with 95% confidence that the proportion of people paying their taxes through agents would lie
between 72.73% and 78.07%. The above predictions have a 2.67% margin of error.
Section 3
Table 4: Proportion of International Students according to Lodgement
Lodgement Method Count Proportion
Tax Agent 33 0.55
Self-Preparer 27 0.45
Total 60 1
The study of lodgement method of international students shows that 55% of the students
prefer to pay their taxes through tax agents. On the other hand, 45% of the international students
would self-prepare their taxes.
55%
45%
Lodgement Method
(International Students)
Tax Agent
Self Preparer
Figure 2: Proportion of International Students according to Lodgement
Table 5: Confidence Interval of International Students using tax agents
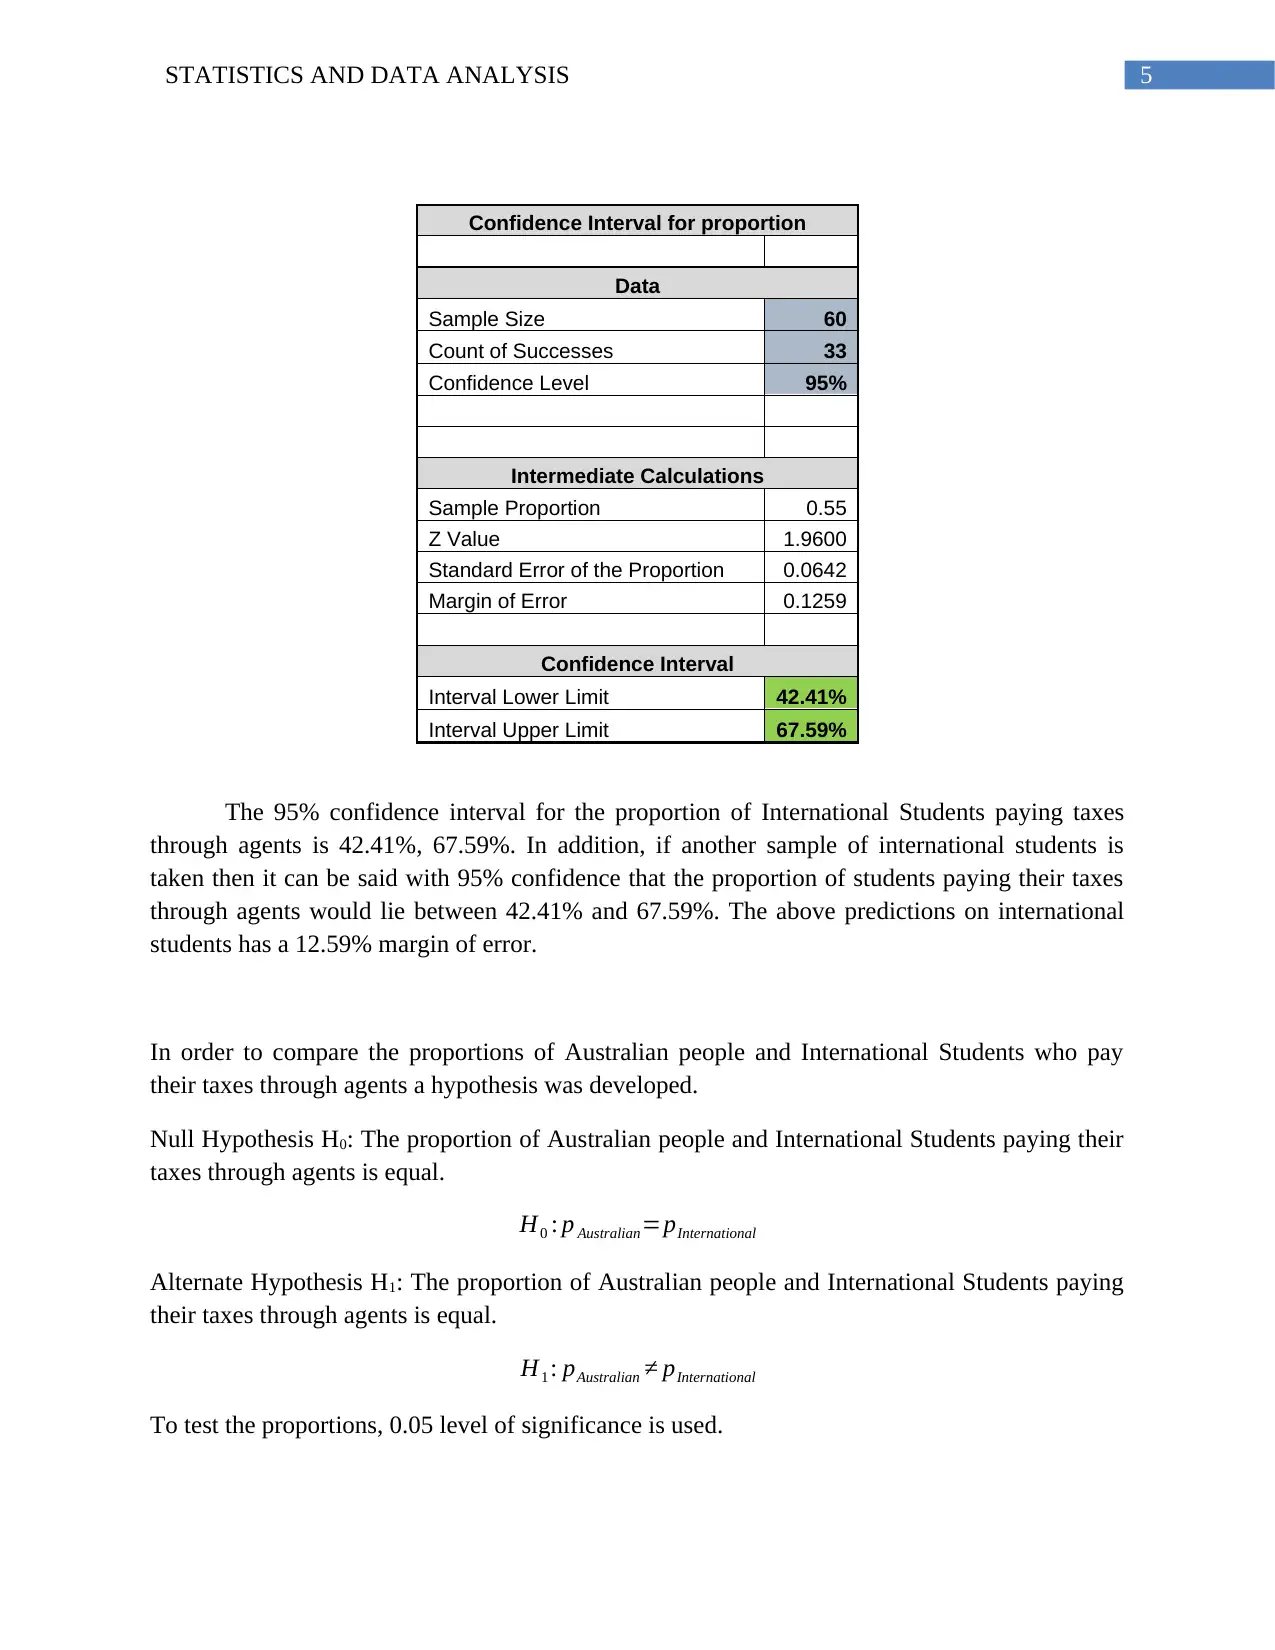
5STATISTICS AND DATA ANALYSIS
Confidence Interval for proportion
Data
Sample Size 60
Count of Successes 33
Confidence Level 95%
Intermediate Calculations
Sample Proportion 0.55
Z Value 1.9600
Standard Error of the Proportion 0.0642
Margin of Error 0.1259
Confidence Interval
Interval Lower Limit 42.41%
Interval Upper Limit 67.59%
The 95% confidence interval for the proportion of International Students paying taxes
through agents is 42.41%, 67.59%. In addition, if another sample of international students is
taken then it can be said with 95% confidence that the proportion of students paying their taxes
through agents would lie between 42.41% and 67.59%. The above predictions on international
students has a 12.59% margin of error.
In order to compare the proportions of Australian people and International Students who pay
their taxes through agents a hypothesis was developed.
Null Hypothesis H0: The proportion of Australian people and International Students paying their
taxes through agents is equal.
H0 : p Australian=pInternational
Alternate Hypothesis H1: The proportion of Australian people and International Students paying
their taxes through agents is equal.
H1 : pAustralian ≠ pInternational
To test the proportions, 0.05 level of significance is used.
⊘ This is a preview!⊘
Do you want full access?
Subscribe today to unlock all pages.
Trusted by 1+ million students worldwide
6STATISTICS AND DATA ANALYSIS
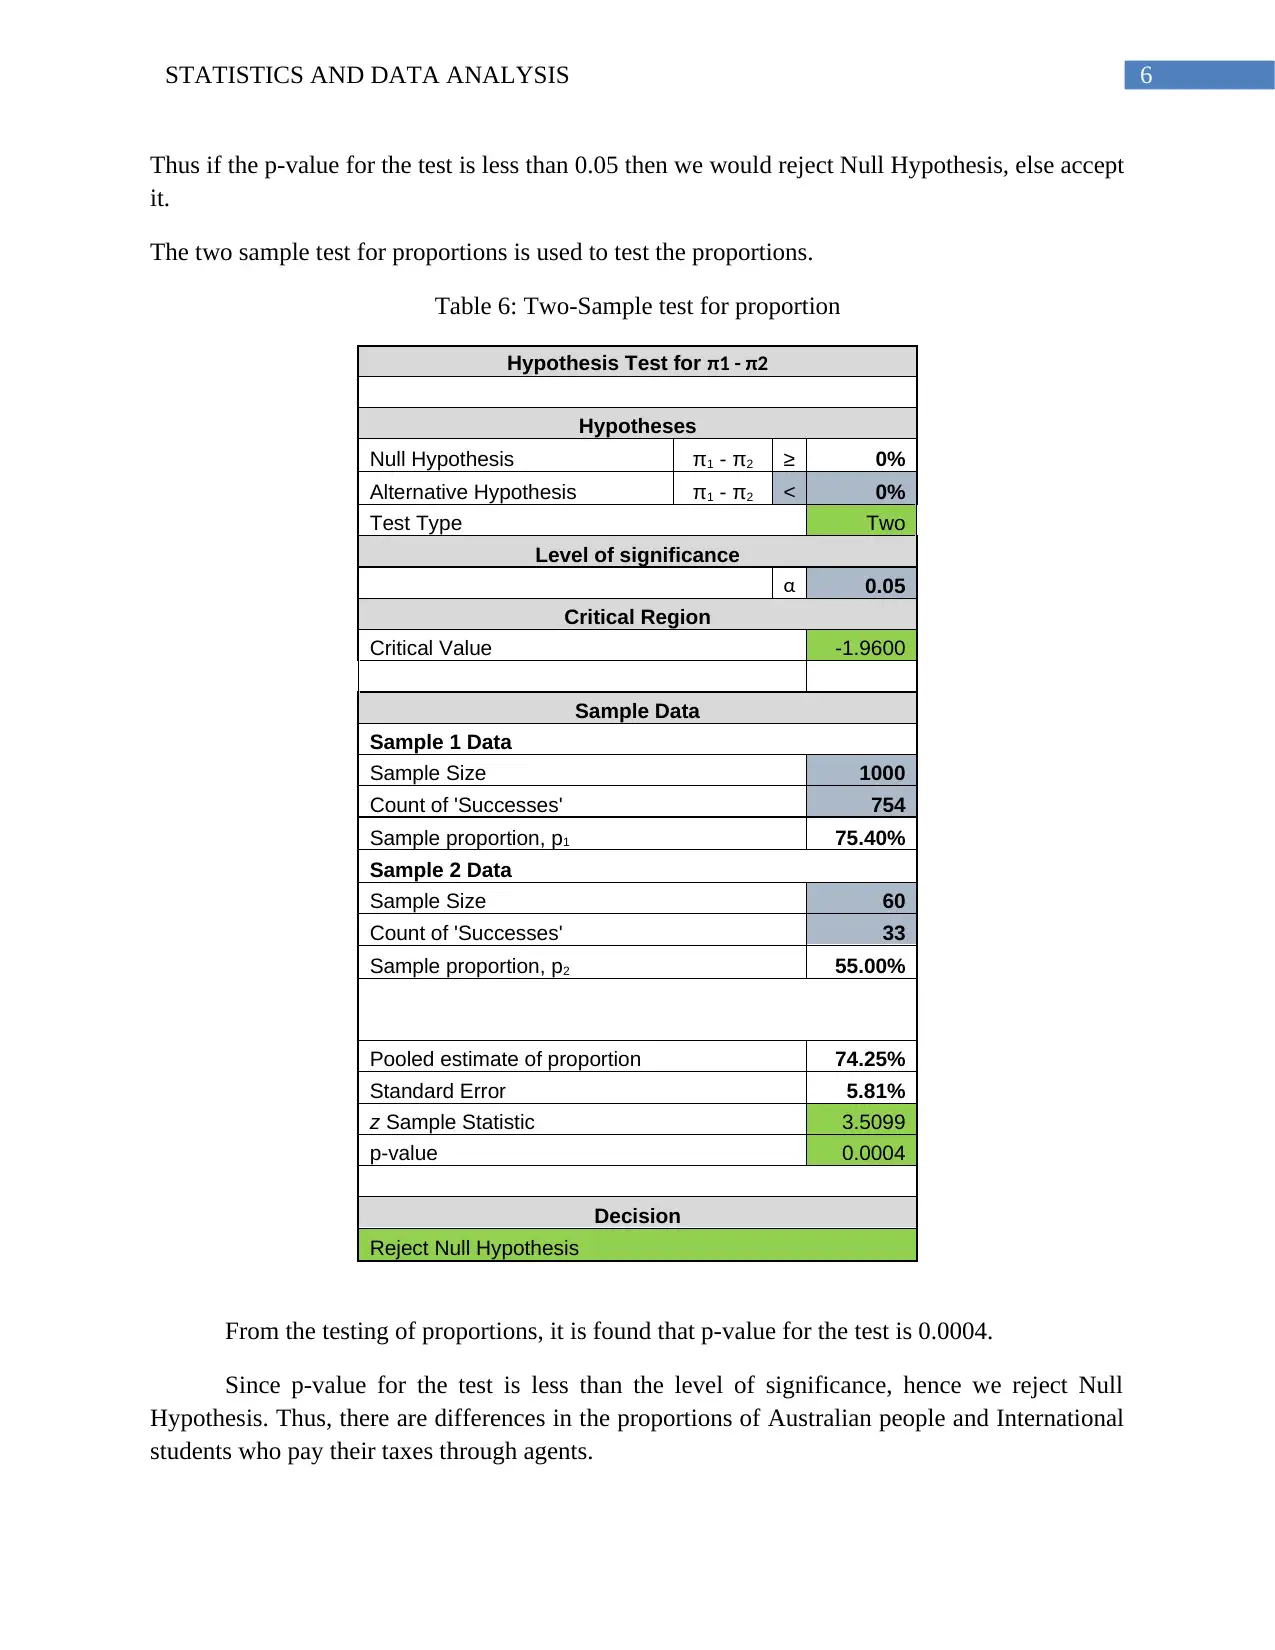
Thus if the p-value for the test is less than 0.05 then we would reject Null Hypothesis, else accept
it.
The two sample test for proportions is used to test the proportions.
Table 6: Two-Sample test for proportion
Hypothesis Test for π1 - π2
Hypotheses
Null Hypothesis π1 - π2 ≥ 0%
Alternative Hypothesis π1 - π2 < 0%
Test Type Two
Level of significance
α 0.05
Critical Region
Critical Value -1.9600
Sample Data
Sample 1 Data
Sample Size 1000
Count of 'Successes' 754
Sample proportion, p1 75.40%
Sample 2 Data
Sample Size 60
Count of 'Successes' 33
Sample proportion, p2 55.00%
Pooled estimate of proportion 74.25%
Standard Error 5.81%
z Sample Statistic 3.5099
p-value 0.0004
Decision
Reject Null Hypothesis
From the testing of proportions, it is found that p-value for the test is 0.0004.
Since p-value for the test is less than the level of significance, hence we reject Null
Hypothesis. Thus, there are differences in the proportions of Australian people and International
students who pay their taxes through agents.
Paraphrase This Document
Need a fresh take? Get an instant paraphrase of this document with our AI Paraphraser
7STATISTICS AND DATA ANALYSIS
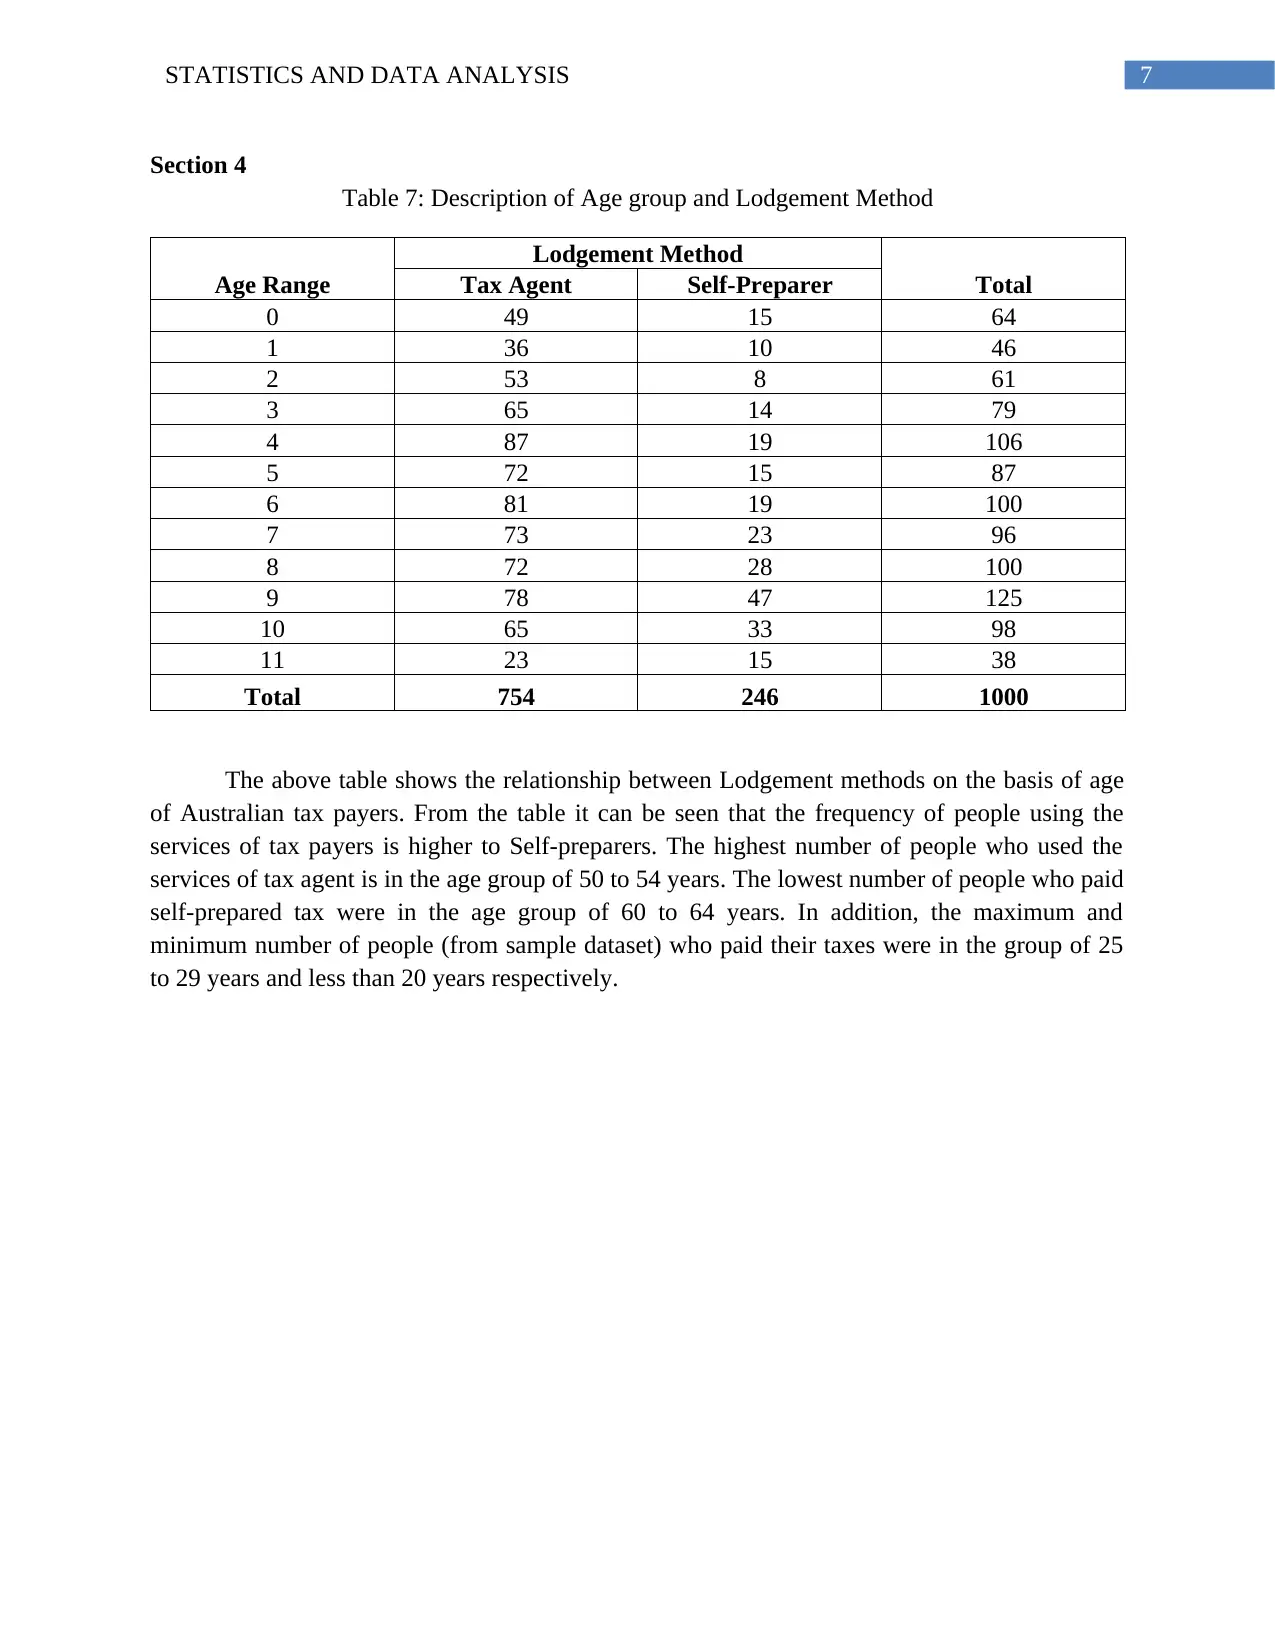
Section 4
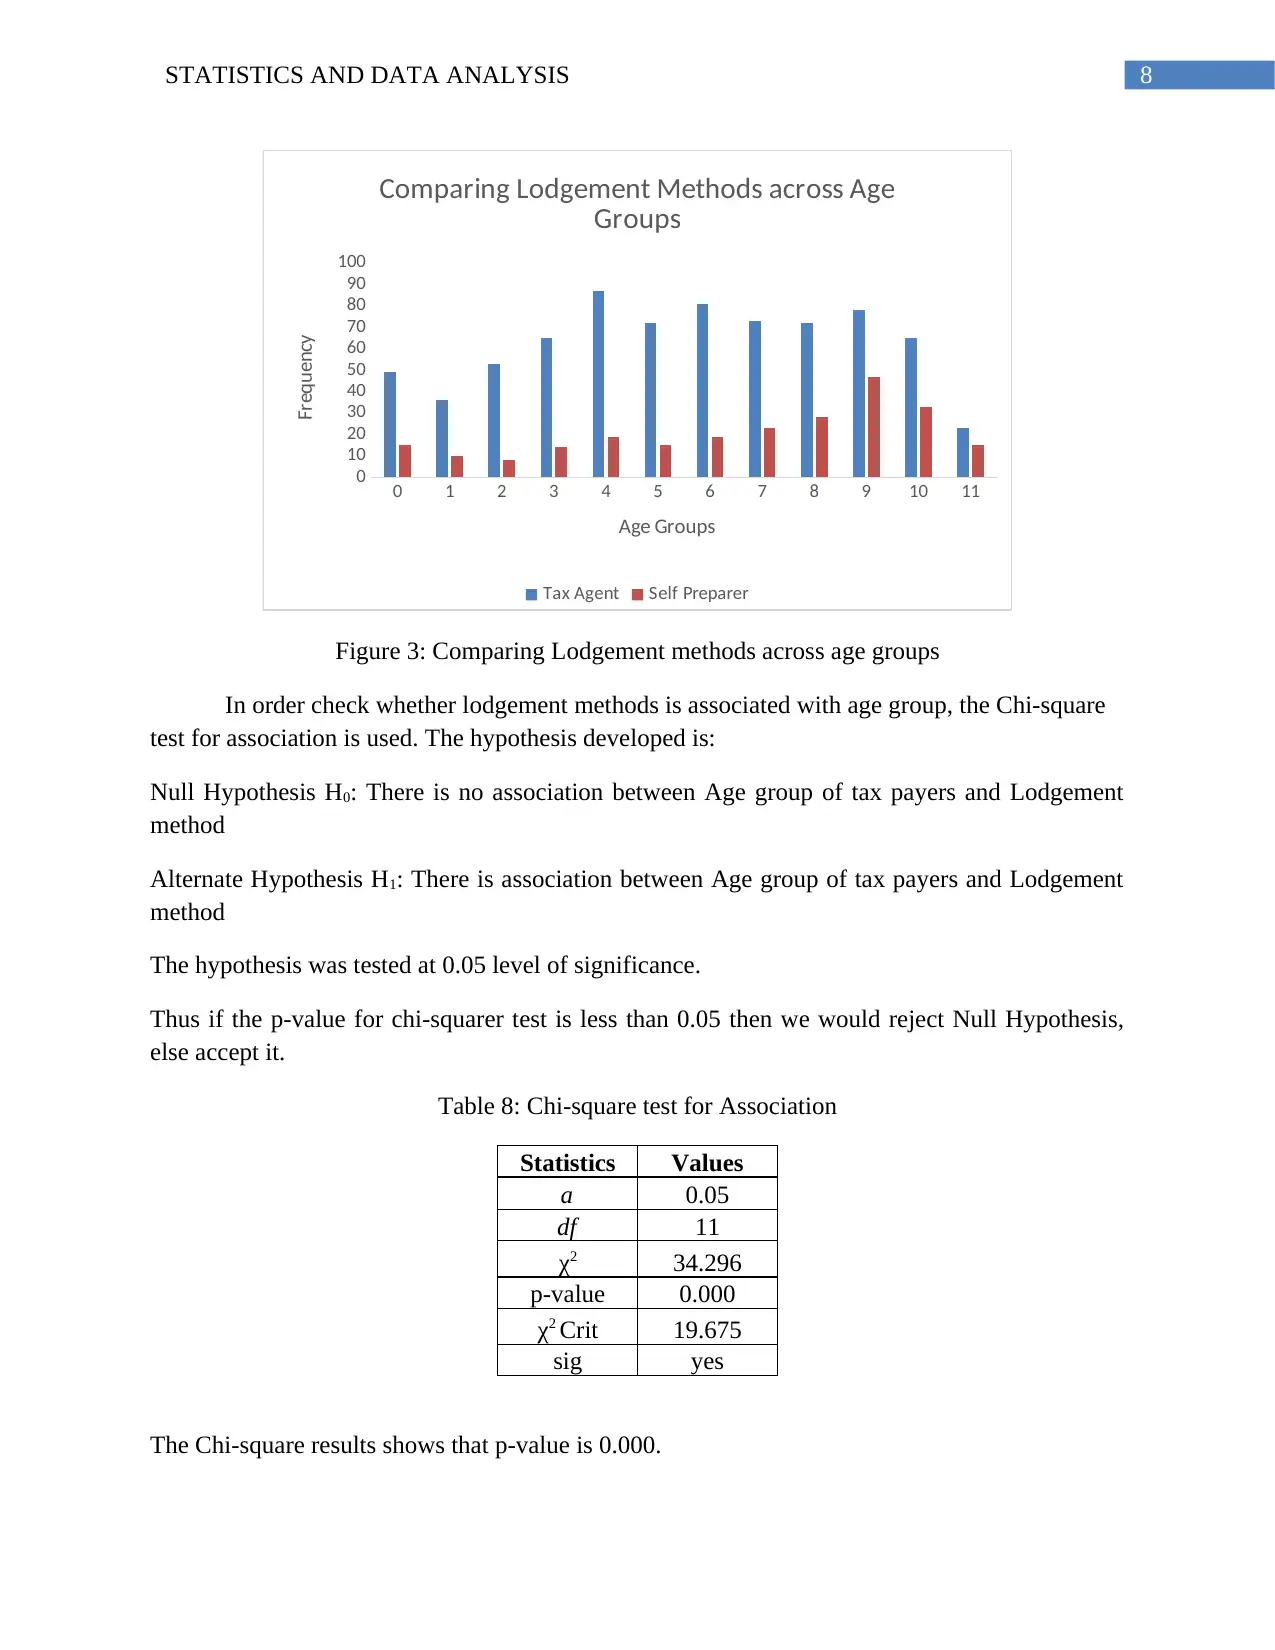
Table 7: Description of Age group and Lodgement Method
Age Range
Lodgement Method
TotalTax Agent Self-Preparer
0 49 15 64
1 36 10 46
2 53 8 61
3 65 14 79
4 87 19 106
5 72 15 87
6 81 19 100
7 73 23 96
8 72 28 100
9 78 47 125
10 65 33 98
11 23 15 38
Total 754 246 1000
The above table shows the relationship between Lodgement methods on the basis of age
of Australian tax payers. From the table it can be seen that the frequency of people using the
services of tax payers is higher to Self-preparers. The highest number of people who used the
services of tax agent is in the age group of 50 to 54 years. The lowest number of people who paid
self-prepared tax were in the age group of 60 to 64 years. In addition, the maximum and
minimum number of people (from sample dataset) who paid their taxes were in the group of 25
to 29 years and less than 20 years respectively.
Section 4
Table 7: Description of Age group and Lodgement Method
Age Range
Lodgement Method
TotalTax Agent Self-Preparer
0 49 15 64
1 36 10 46
2 53 8 61
3 65 14 79
4 87 19 106
5 72 15 87
6 81 19 100
7 73 23 96
8 72 28 100
9 78 47 125
10 65 33 98
11 23 15 38
Total 754 246 1000
The above table shows the relationship between Lodgement methods on the basis of age
of Australian tax payers. From the table it can be seen that the frequency of people using the
services of tax payers is higher to Self-preparers. The highest number of people who used the
services of tax agent is in the age group of 50 to 54 years. The lowest number of people who paid
self-prepared tax were in the age group of 60 to 64 years. In addition, the maximum and
minimum number of people (from sample dataset) who paid their taxes were in the group of 25
to 29 years and less than 20 years respectively.
8STATISTICS AND DATA ANALYSIS
0 1 2 3 4 5 6 7 8 9 10 11
0
10
20
30
40
50
60
70
80
90
100
Comparing Lodgement Methods across Age
Groups
Tax Agent Self Preparer
Age Groups
Frequency
Figure 3: Comparing Lodgement methods across age groups
In order check whether lodgement methods is associated with age group, the Chi-square
test for association is used. The hypothesis developed is:
Null Hypothesis H0: There is no association between Age group of tax payers and Lodgement
method
Alternate Hypothesis H1: There is association between Age group of tax payers and Lodgement
method
The hypothesis was tested at 0.05 level of significance.
Thus if the p-value for chi-squarer test is less than 0.05 then we would reject Null Hypothesis,
else accept it.
Table 8: Chi-square test for Association
Statistics Values
a 0.05
df 11
χ2 34.296
p-value 0.000
χ2 Crit 19.675
sig yes
The Chi-square results shows that p-value is 0.000.
⊘ This is a preview!⊘
Do you want full access?
Subscribe today to unlock all pages.
Trusted by 1+ million students worldwide
9STATISTICS AND DATA ANALYSIS
Since p-value <
-value, hence we reject Null Hypothesis.
Thus, there is an association between Age group of tax payers and Lodgement method.
Section 5
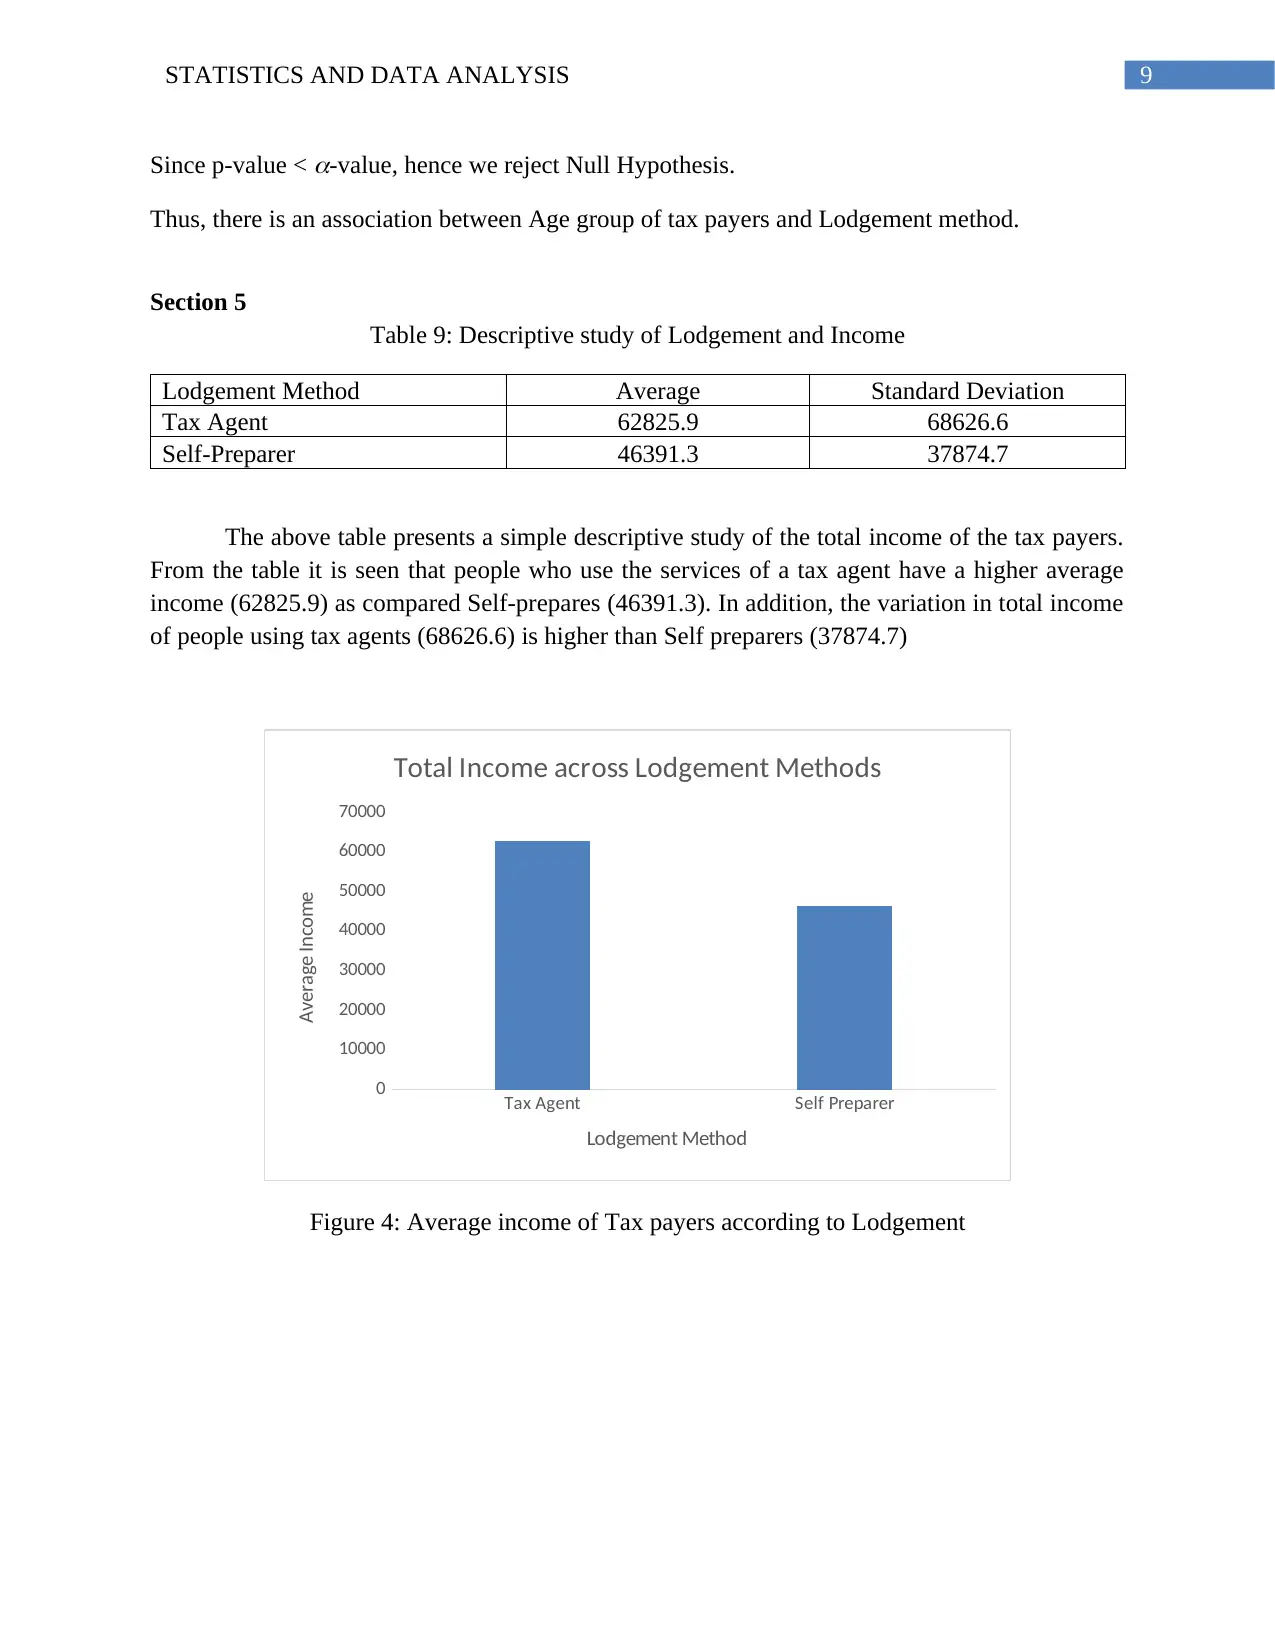
Table 9: Descriptive study of Lodgement and Income
Lodgement Method Average Standard Deviation
Tax Agent 62825.9 68626.6
Self-Preparer 46391.3 37874.7
The above table presents a simple descriptive study of the total income of the tax payers.
From the table it is seen that people who use the services of a tax agent have a higher average
income (62825.9) as compared Self-prepares (46391.3). In addition, the variation in total income
of people using tax agents (68626.6) is higher than Self preparers (37874.7)
Tax Agent Self Preparer
0
10000
20000
30000
40000
50000
60000
70000
Total Income across Lodgement Methods
Lodgement Method
Average Income
Figure 4: Average income of Tax payers according to Lodgement
Since p-value <
-value, hence we reject Null Hypothesis.
Thus, there is an association between Age group of tax payers and Lodgement method.
Section 5
Table 9: Descriptive study of Lodgement and Income
Lodgement Method Average Standard Deviation
Tax Agent 62825.9 68626.6
Self-Preparer 46391.3 37874.7
The above table presents a simple descriptive study of the total income of the tax payers.
From the table it is seen that people who use the services of a tax agent have a higher average
income (62825.9) as compared Self-prepares (46391.3). In addition, the variation in total income
of people using tax agents (68626.6) is higher than Self preparers (37874.7)
Tax Agent Self Preparer
0
10000
20000
30000
40000
50000
60000
70000
Total Income across Lodgement Methods
Lodgement Method
Average Income
Figure 4: Average income of Tax payers according to Lodgement
Paraphrase This Document
Need a fresh take? Get an instant paraphrase of this document with our AI Paraphraser
10STATISTICS AND DATA ANALYSIS
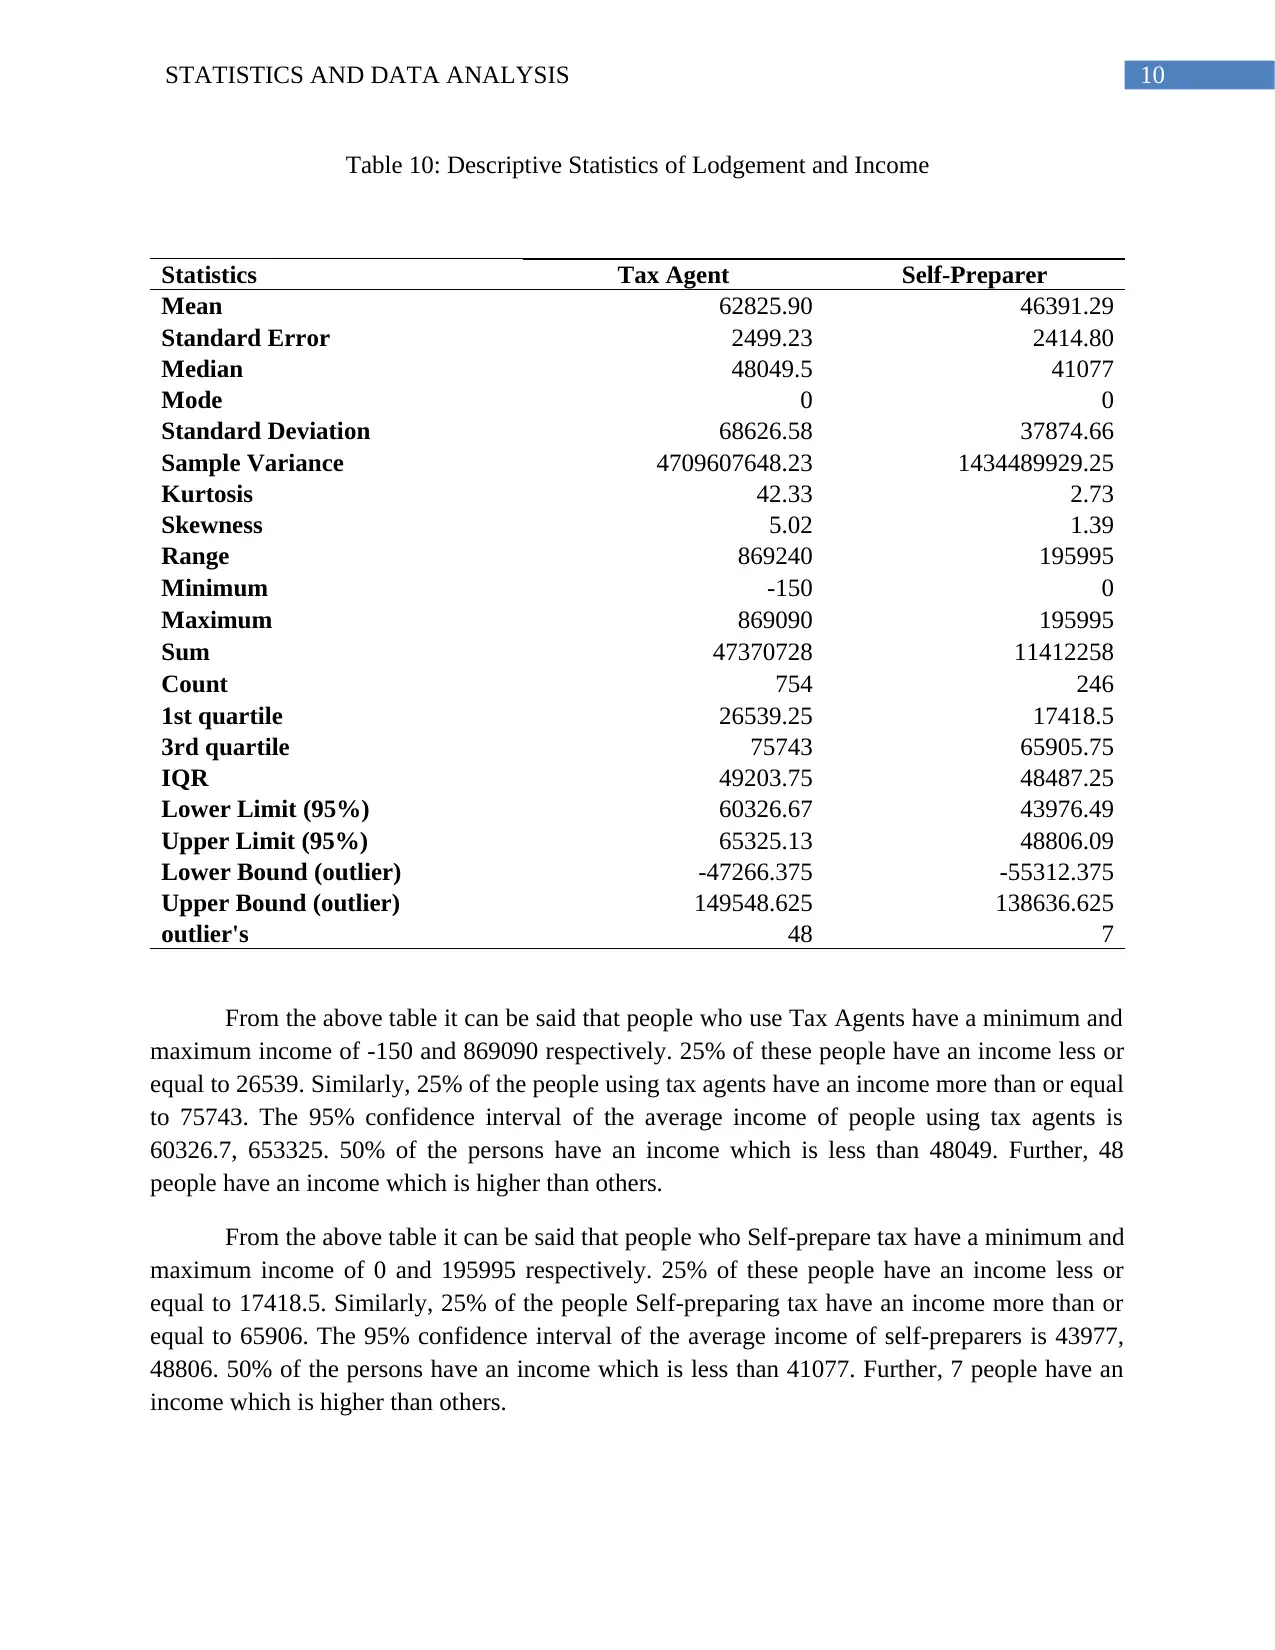
Table 10: Descriptive Statistics of Lodgement and Income
Statistics Tax Agent Self-Preparer
Mean 62825.90 46391.29
Standard Error 2499.23 2414.80
Median 48049.5 41077
Mode 0 0
Standard Deviation 68626.58 37874.66
Sample Variance 4709607648.23 1434489929.25
Kurtosis 42.33 2.73
Skewness 5.02 1.39
Range 869240 195995
Minimum -150 0
Maximum 869090 195995
Sum 47370728 11412258
Count 754 246
1st quartile 26539.25 17418.5
3rd quartile 75743 65905.75
IQR 49203.75 48487.25
Lower Limit (95%) 60326.67 43976.49
Upper Limit (95%) 65325.13 48806.09
Lower Bound (outlier) -47266.375 -55312.375
Upper Bound (outlier) 149548.625 138636.625
outlier's 48 7
From the above table it can be said that people who use Tax Agents have a minimum and
maximum income of -150 and 869090 respectively. 25% of these people have an income less or
equal to 26539. Similarly, 25% of the people using tax agents have an income more than or equal
to 75743. The 95% confidence interval of the average income of people using tax agents is
60326.7, 653325. 50% of the persons have an income which is less than 48049. Further, 48
people have an income which is higher than others.
From the above table it can be said that people who Self-prepare tax have a minimum and
maximum income of 0 and 195995 respectively. 25% of these people have an income less or
equal to 17418.5. Similarly, 25% of the people Self-preparing tax have an income more than or
equal to 65906. The 95% confidence interval of the average income of self-preparers is 43977,
48806. 50% of the persons have an income which is less than 41077. Further, 7 people have an
income which is higher than others.
11STATISTICS AND DATA ANALYSIS
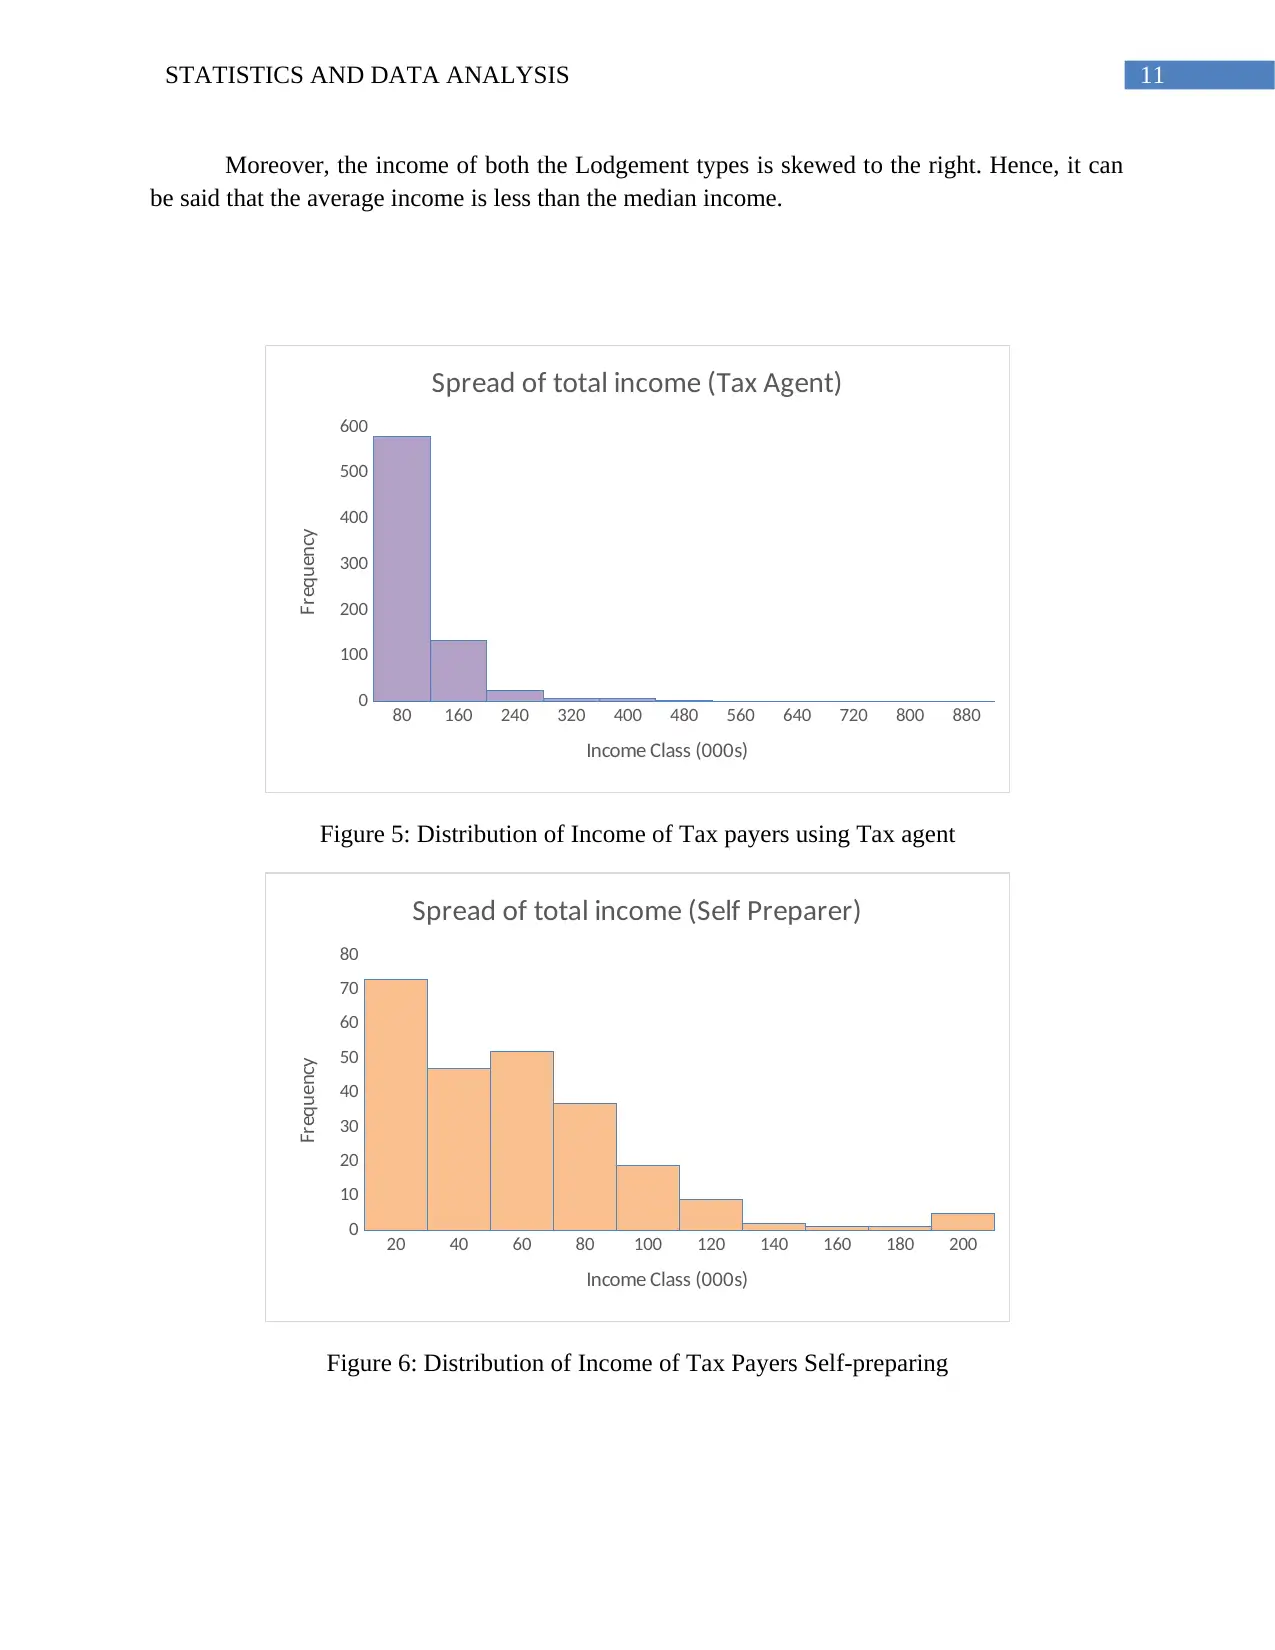
Moreover, the income of both the Lodgement types is skewed to the right. Hence, it can
be said that the average income is less than the median income.
80 160 240 320 400 480 560 640 720 800 880
0
100
200
300
400
500
600
Spread of total income (Tax Agent)
Income Class (000s)
Frequency
Figure 5: Distribution of Income of Tax payers using Tax agent
20 40 60 80 100 120 140 160 180 200
0
10
20
30
40
50
60
70
80
Spread of total income (Self Preparer)
Income Class (000s)
Frequency
Figure 6: Distribution of Income of Tax Payers Self-preparing
⊘ This is a preview!⊘
Do you want full access?
Subscribe today to unlock all pages.
Trusted by 1+ million students worldwide
1 out of 16
Related Documents


Your All-in-One AI-Powered Toolkit for Academic Success.
+13062052269
info@desklib.com
Available 24*7 on WhatsApp / Email
![[object Object]](/_next/static/media/star-bottom.7253800d.svg)
Unlock your academic potential
Copyright © 2020–2026 A2Z Services. All Rights Reserved. Developed and managed by ZUCOL.