Comparative Financial Analysis: Australian Vanadium and Alcoa Report
VerifiedAdded on 2020/04/01
|14
|3409
|288
Report
AI Summary
This report provides a comprehensive financial analysis comparing Australian Vanadium (formerly Yellow Rock Resources Limited) and Alcoa Inc. The analysis includes a detailed examination of financial results, comparing key metrics such as revenue, net profit, operating income, and various ratios related to profitability, liquidity, resource management, and financial stability. The report also delves into additional financial issues like interest rate risk, liquidity risk, credit risk, foreign currency impacts, and commodity price fluctuations. Furthermore, it contrasts the environmental reporting practices of both companies, highlighting Alcoa's proactive approach to reducing carbon emissions and promoting sustainability, while noting the lack of such detailed reporting from Australian Vanadium. The conclusion synthesizes the findings, offering insights into the financial performance and environmental consciousness of both companies.
Accounting for Management
1
1
Paraphrase This Document
Need a fresh take? Get an instant paraphrase of this document with our AI Paraphraser
Table of Contents
Introduction................................................................................................................................3
Comparison of financial result...................................................................................................3
Profitability:...........................................................................................................................5
Liquidity:................................................................................................................................6
Operation:...............................................................................................................................6
Resource management...........................................................................................................6
Financial Stability & Performance:........................................................................................7
Additional financial issues.....................................................................................................8
Comparison of environmental issues and reporting of the issues............................................10
Conclusion:..............................................................................................................................12
Reference..................................................................................................................................13
2
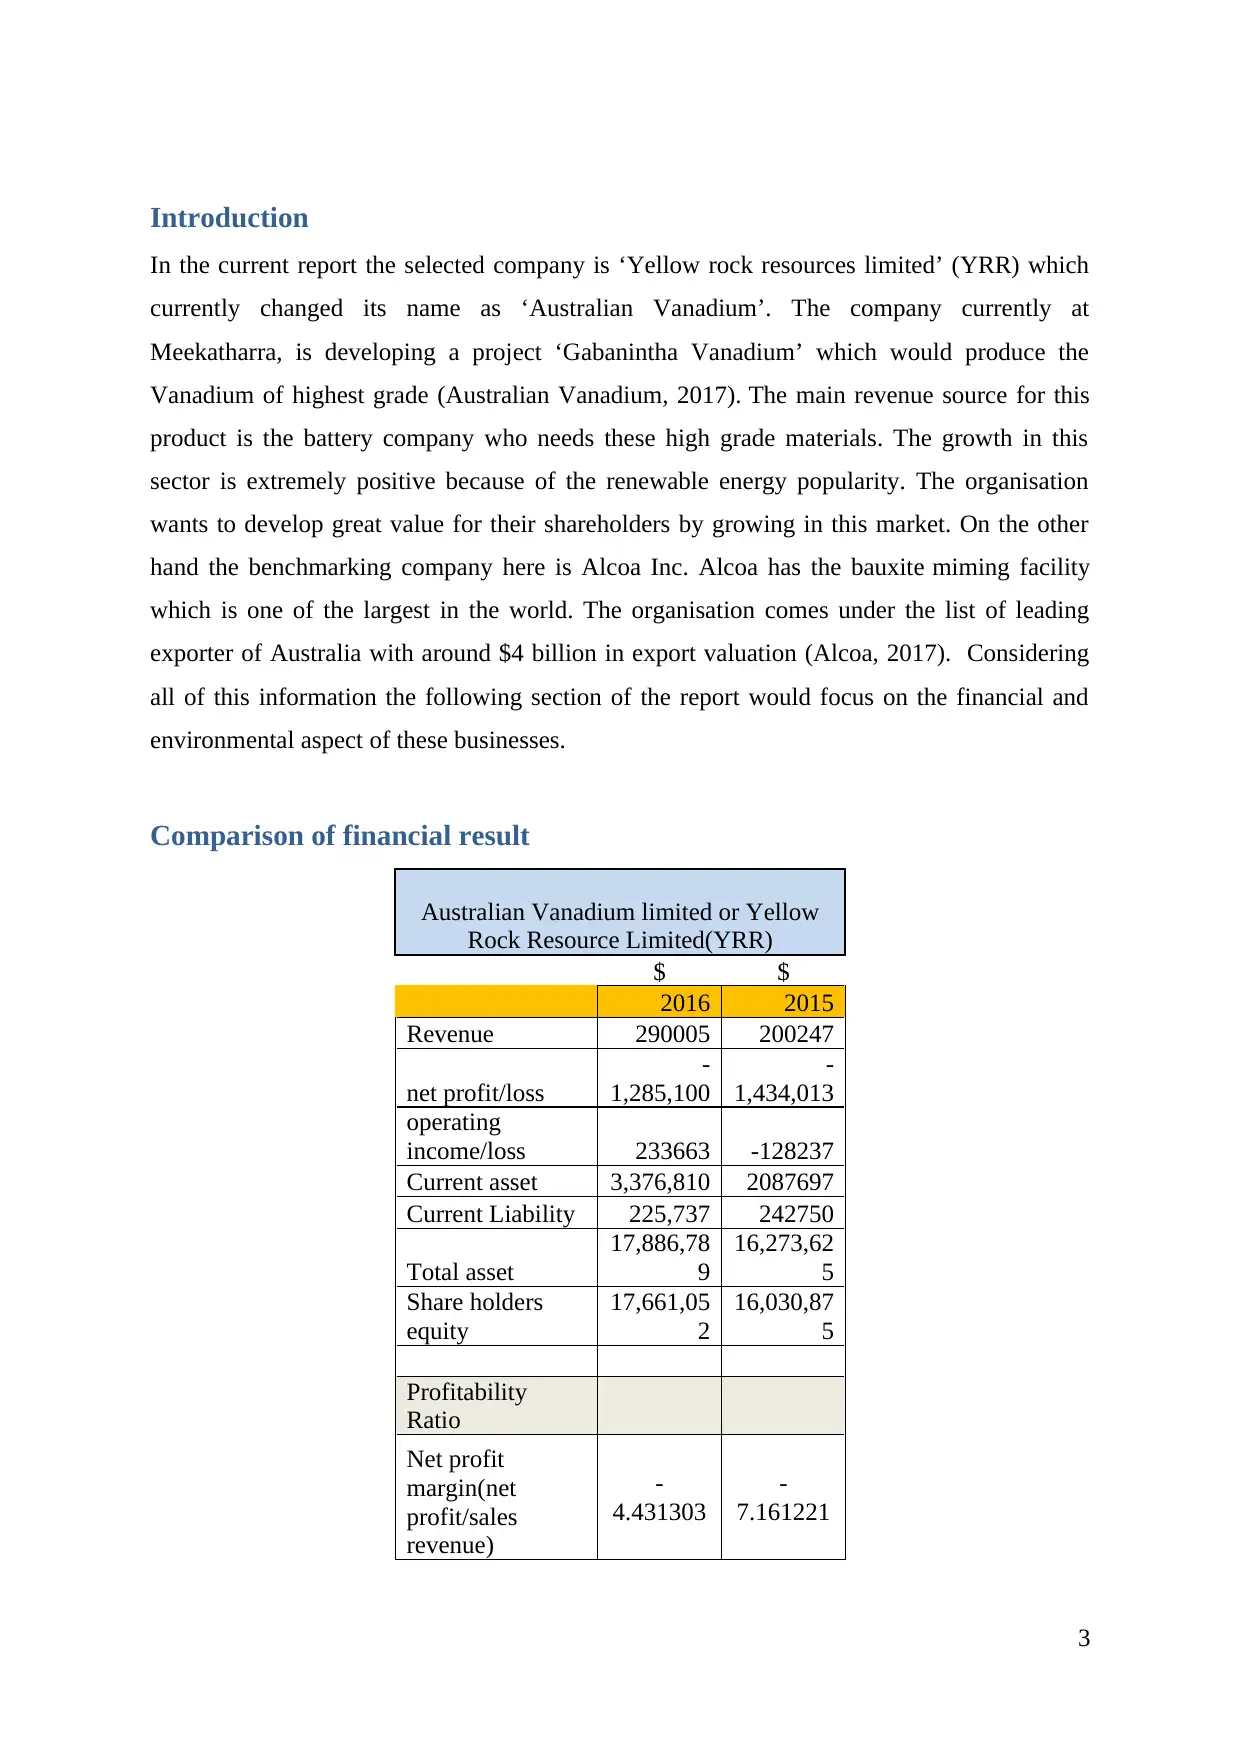
Introduction
In the current report the selected company is ‘Yellow rock resources limited’ (YRR) which
currently changed its name as ‘Australian Vanadium’. The company currently at
Meekatharra, is developing a project ‘Gabanintha Vanadium’ which would produce the
Vanadium of highest grade (Australian Vanadium, 2017). The main revenue source for this
product is the battery company who needs these high grade materials. The growth in this
sector is extremely positive because of the renewable energy popularity. The organisation
wants to develop great value for their shareholders by growing in this market. On the other
hand the benchmarking company here is Alcoa Inc. Alcoa has the bauxite miming facility
which is one of the largest in the world. The organisation comes under the list of leading
exporter of Australia with around $4 billion in export valuation (Alcoa, 2017). Considering
all of this information the following section of the report would focus on the financial and
environmental aspect of these businesses.
Comparison of financial result
Australian Vanadium limited or Yellow
Rock Resource Limited(YRR)
$ $
2016 2015
Revenue 290005 200247
net profit/loss
-
1,285,100
-
1,434,013
operating
income/loss 233663 -128237
Current asset 3,376,810 2087697
Current Liability 225,737 242750
Total asset
17,886,78
9
16,273,62
5
Share holders
equity
17,661,05
2
16,030,87
5
Profitability
Ratio
Net profit
margin(net
profit/sales
revenue)
-
4.431303
-
7.161221
3
⊘ This is a preview!⊘
Do you want full access?
Subscribe today to unlock all pages.
Trusted by 1+ million students worldwide
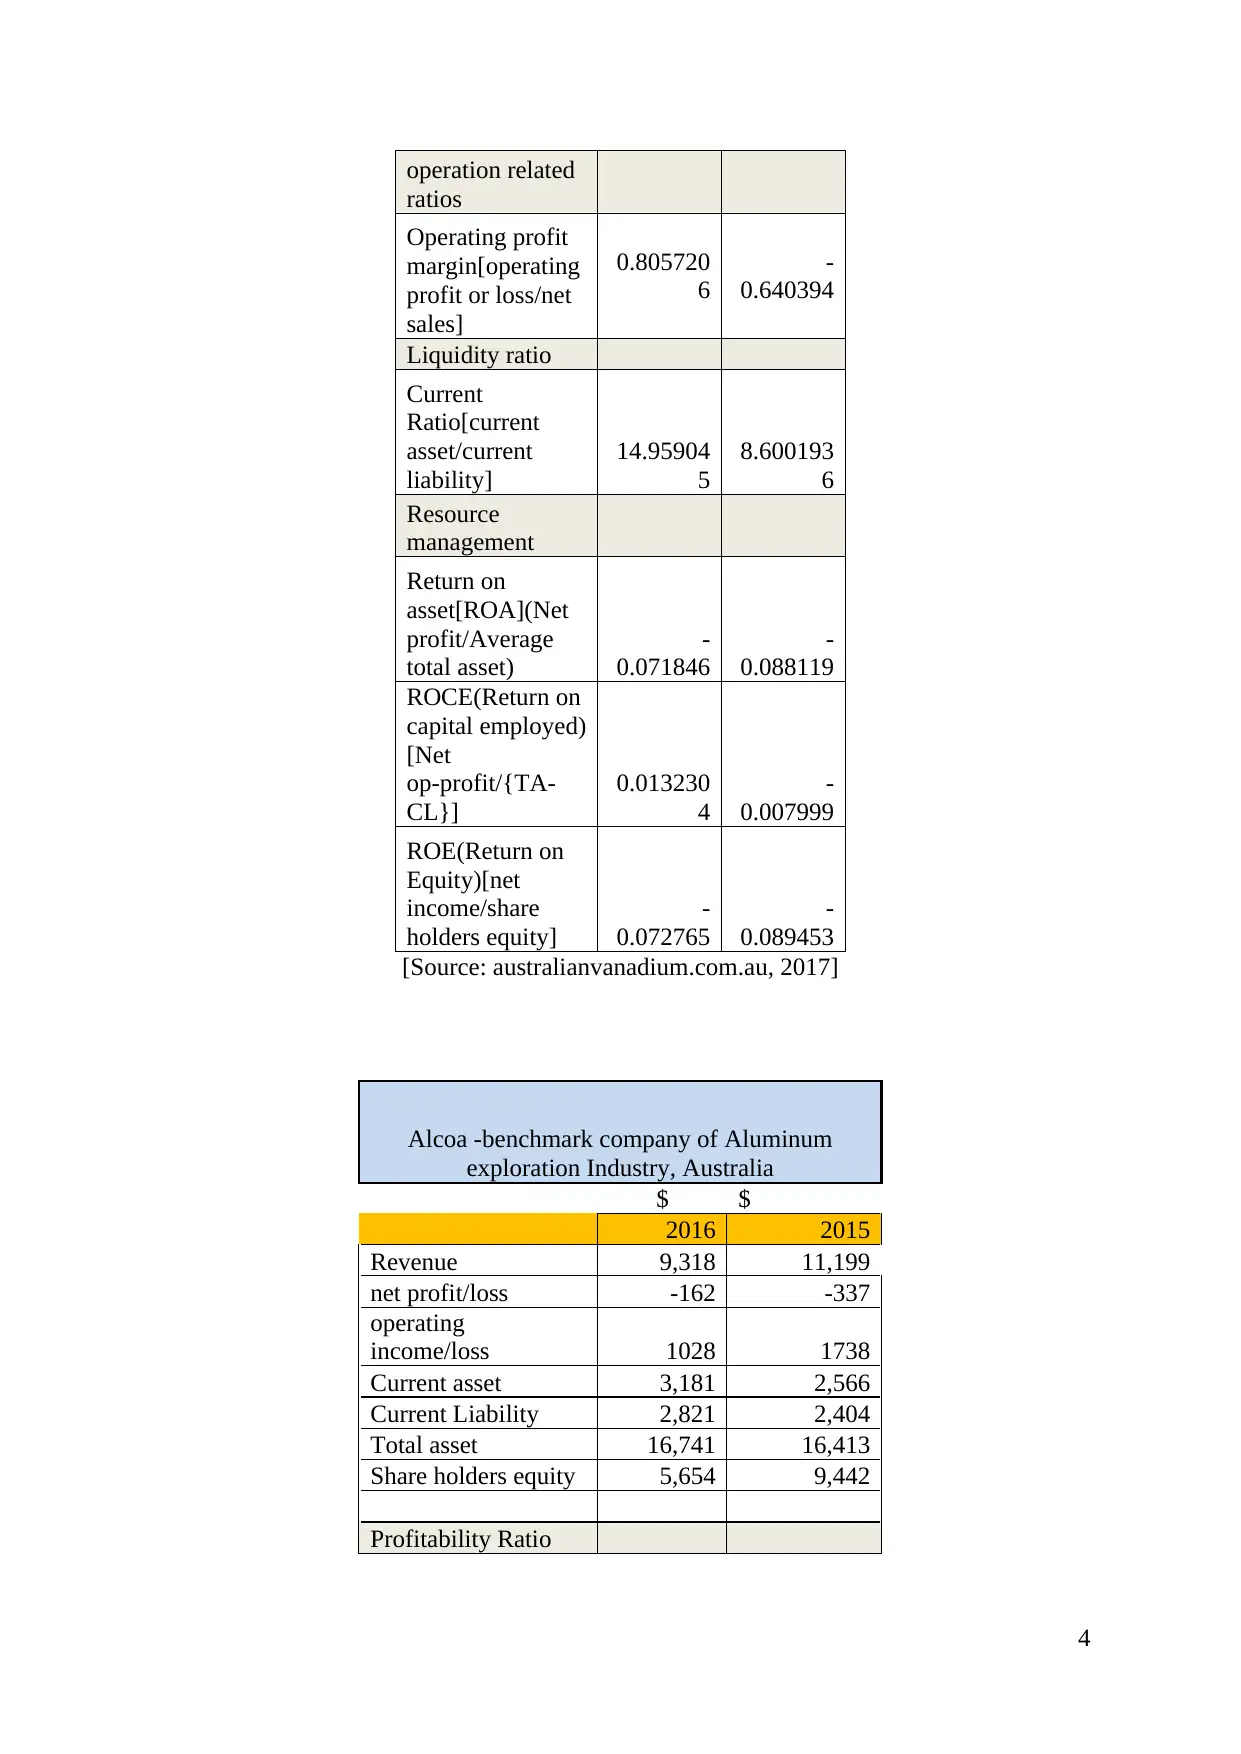
operation related
ratios
Operating profit
margin[operating
profit or loss/net
sales]
0.805720
6
-
0.640394
Liquidity ratio
Current
Ratio[current
asset/current
liability]
14.95904
5
8.600193
6
Resource
management
Return on
asset[ROA](Net
profit/Average
total asset)
-
0.071846
-
0.088119
ROCE(Return on
capital employed)
[Net
op-profit/{TA-
CL}]
0.013230
4
-
0.007999
ROE(Return on
Equity)[net
income/share
holders equity]
-
0.072765
-
0.089453
[Source: australianvanadium.com.au, 2017]
Alcoa -benchmark company of Aluminum
exploration Industry, Australia
$ $
2016 2015
Revenue 9,318 11,199
net profit/loss -162 -337
operating
income/loss 1028 1738
Current asset 3,181 2,566
Current Liability 2,821 2,404
Total asset 16,741 16,413
Share holders equity 5,654 9,442
Profitability Ratio
4
Paraphrase This Document
Need a fresh take? Get an instant paraphrase of this document with our AI Paraphraser
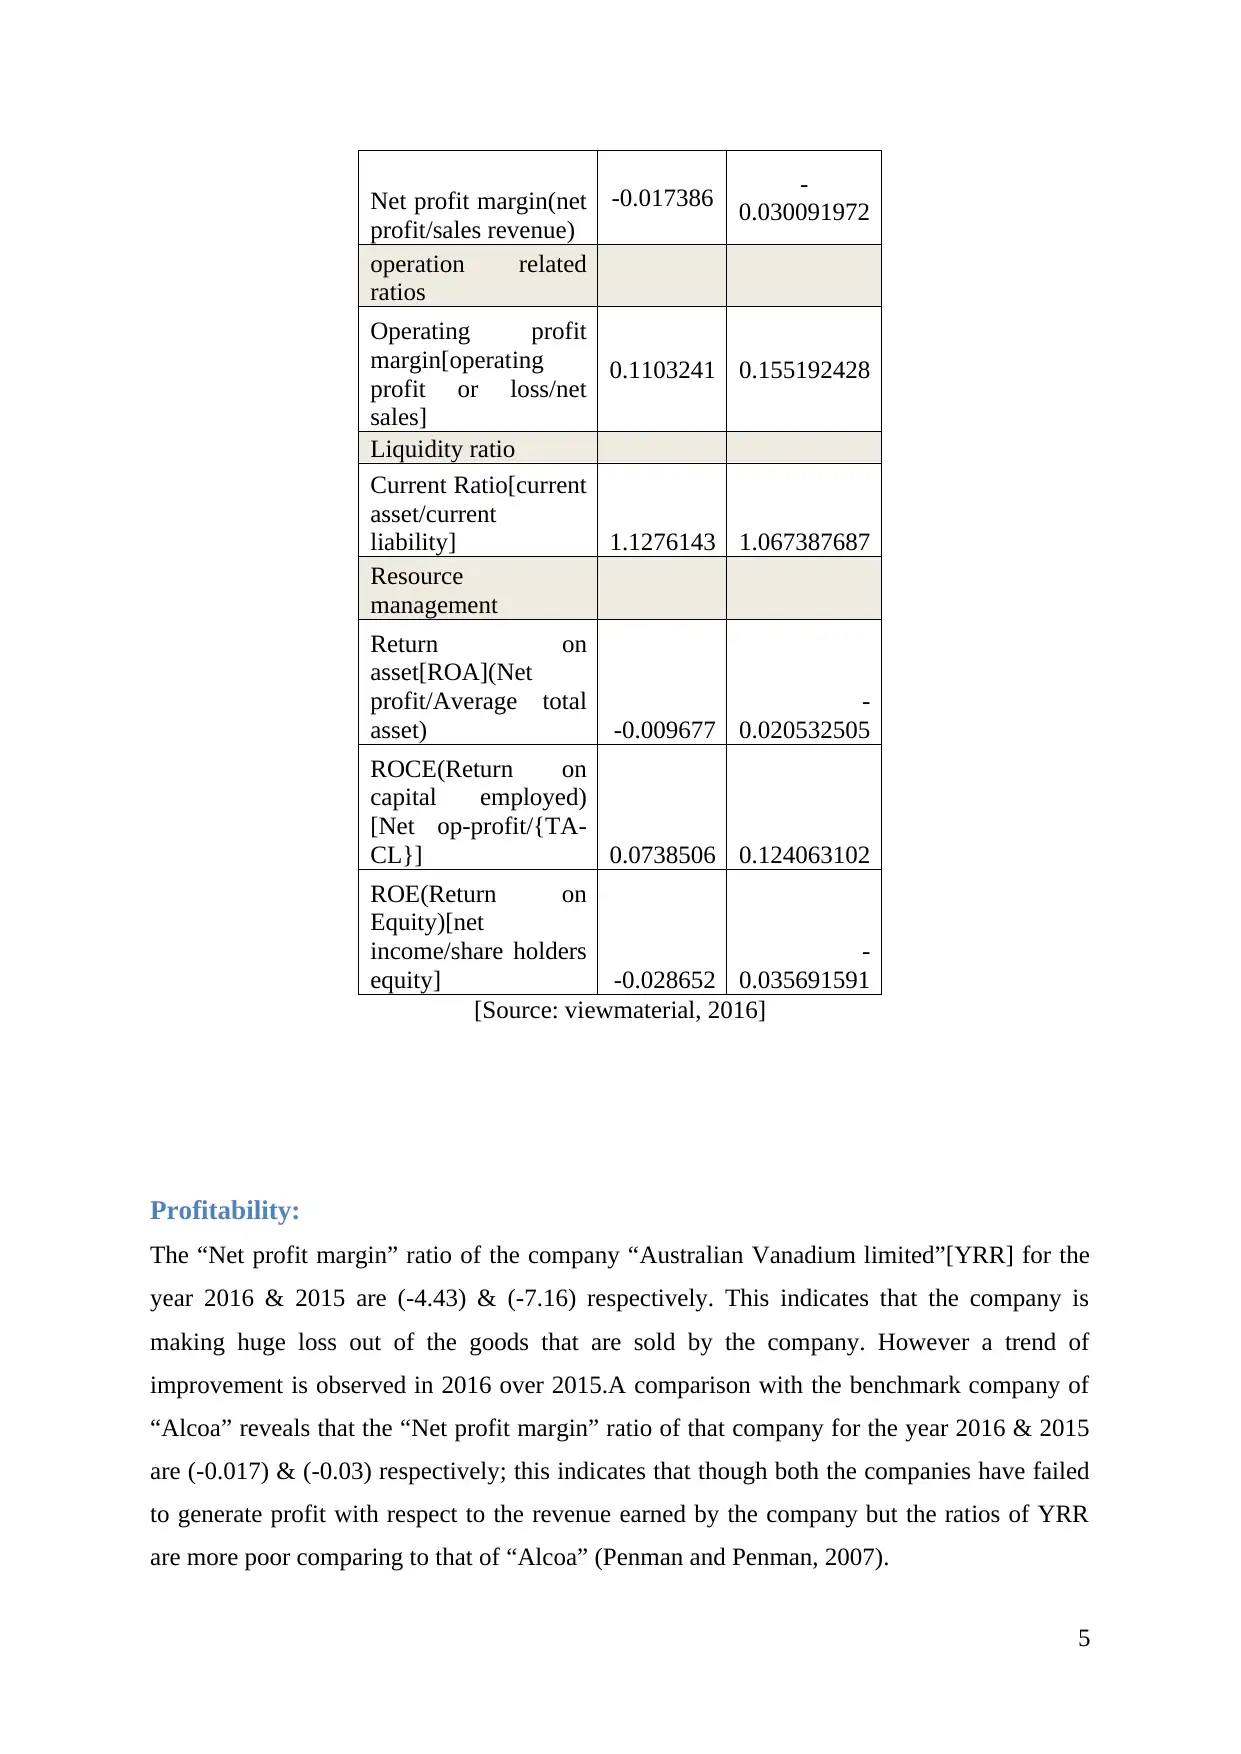
Net profit margin(net
profit/sales revenue)
-0.017386 -
0.030091972
operation related
ratios
Operating profit
margin[operating
profit or loss/net
sales]
0.1103241 0.155192428
Liquidity ratio
Current Ratio[current
asset/current
liability] 1.1276143 1.067387687
Resource
management
Return on
asset[ROA](Net
profit/Average total
asset) -0.009677
-
0.020532505
ROCE(Return on
capital employed)
[Net op-profit/{TA-
CL}] 0.0738506 0.124063102
ROE(Return on
Equity)[net
income/share holders
equity] -0.028652
-
0.035691591
[Source: viewmaterial, 2016]
Profitability:
The “Net profit margin” ratio of the company “Australian Vanadium limited”[YRR] for the
year 2016 & 2015 are (-4.43) & (-7.16) respectively. This indicates that the company is
making huge loss out of the goods that are sold by the company. However a trend of
improvement is observed in 2016 over 2015.A comparison with the benchmark company of
“Alcoa” reveals that the “Net profit margin” ratio of that company for the year 2016 & 2015
are (-0.017) & (-0.03) respectively; this indicates that though both the companies have failed
to generate profit with respect to the revenue earned by the company but the ratios of YRR
are more poor comparing to that of “Alcoa” (Penman and Penman, 2007).
5
Liquidity:
The current ratio of 14.96 in 2016 and that of 8.60 of 2015 of the company YRR shows that
the company is having huge amount of liquid asset in hand in comparison to the current
liability of the company. More over the current ratio of 2016 is higher than that of 2015.This
indicates that the company prefers to hold huge amount of liquid cash instead of investing
them (MacQueen et al., 2016). An evaluation of the liquidity ratios with that of Alcoa shows
that ratios of that company are around 1.13 & 1.07 for 2016 & 2015 respectively. This
indicates that Alcoa is not holding good liquidity position but is also more capable to make
good utilization of their liquid cash in comparison to YRR
Operation:
The operational profit margin ratio of YRR are 0.81 & (-0.64) for 2116 & 2015 respectively.
This indicates that the operating profit generating capacity out of the sales generated by the
company is comparatively better than the net profit generation capacity of that company
(Penman and Penman, 2007). However the operating profit generation capacity of that
company is showing some degree of improvements in 2016 over that of 2015.That is the ratio
has become positive in 2015.
The operating profit ratios of Alcoa are 0.11 & 0.16 respectively and therefore it can be seen
that Alcoa is having better operational efficiency with respect to YRR.
Resource management
The resource management position of the companies would be compared through the ratios
like the return on asset, return on equity and return on capital (Griffin, 2009). Return on asset
of Alcoa is -0.0096 and -0.0205 for the year 2016 and 2015 respectively. On the other hand
the return on asset for ‘Yellow rock resources limited’ (YRR) are -0.071 and -0.088 for the
year 2016 and 2015 respectively. The ratios are both in negative as the net profit of both the
businesses are in negative. For Alcoa the ratio has improved from year 2015 to 2016. On the
other hand the ratio for YRR is more or less the same. So as a benchmark company the
utilisation of asset in the business operation is much more efficient for Alcoa in comparison
to YRR.
The ROCE ratios for RYC are 0.0132 and -0.007 for the year 2016 and 2015 respectively. On
the other hand the ratios for Alcoa are 0.073 and 0.124. In case of Alcoa as a benchmark
company the performance is better than RYC but the efficiency of capital employed has
6
⊘ This is a preview!⊘
Do you want full access?
Subscribe today to unlock all pages.
Trusted by 1+ million students worldwide
dropped for Alcoa from the year 2015 to 2016 (Healy and Palepu, 2012). In case of YRR the
ratio has improves over the year period.
In case of return on equity the figure for RYC are -0.072 and -0.089 for the year 2016 and
2015 respectively whereas the figure for Alcoa are -0.028 and -0.035. Both of them show
some minor improvement on this ratio (Higgins, 2012). Over all net profit of both the
business is in negative and that is why the ratio is negative but the performance of Alcoa is
better and the organisation is able to use its investment better.
Financial Stability & Performance:
From the discussion of the above ratios it can be seen that the overall financial performance
of the company is quiet poor with respect to the industry benchmark standard. It is true that
the company is operating in the heavy industry that demands a huge initial infrastructural
investment but still it is very much required that the investments are to be done in an efficient
manner so that the business can earn a good profit earning pace or momentum that can help
the business to quickly recover the initial investments made by the company (MacQueen et
al., 2016).
A deeper look at the ratios help us to identify that the operating profit margin ratio of the
company YRR is comparatively better than the net profit margin ratio. This indicates that the
business is losing out maximum of its earrings in regulating the operation expenses of the
company. Thus it can be said that YRR is badly suffering due to operational inefficiency.
The high liquidity ratios of the company are showing that the company is holding huge
amount of liquid cash instead of investments (Griffin, 2009). This indicates that the company
lacks good planning of investments
The Negative resource management ratios such as ROA & ROE are showing that the
company has failed to generate sufficient return on total asset as well as equity capital due to
inefficient management of the assets at their disposal.
However the cautious nature of the company that leads to holding of liquid cash (instead of
making unplanned expenditure that may lead to further loss) and the effort of the company to
improve their operational efficiency which leads to positive operating profit margin ratio in
2016(0.81) describes that the company is expect to sustain and to attain financial stability in
near future (Healy and Palepu, 2012).
7
Paraphrase This Document
Need a fresh take? Get an instant paraphrase of this document with our AI Paraphraser
Additional financial issues
The financial risk factors of the business need to be under considered properly and those are
given below.
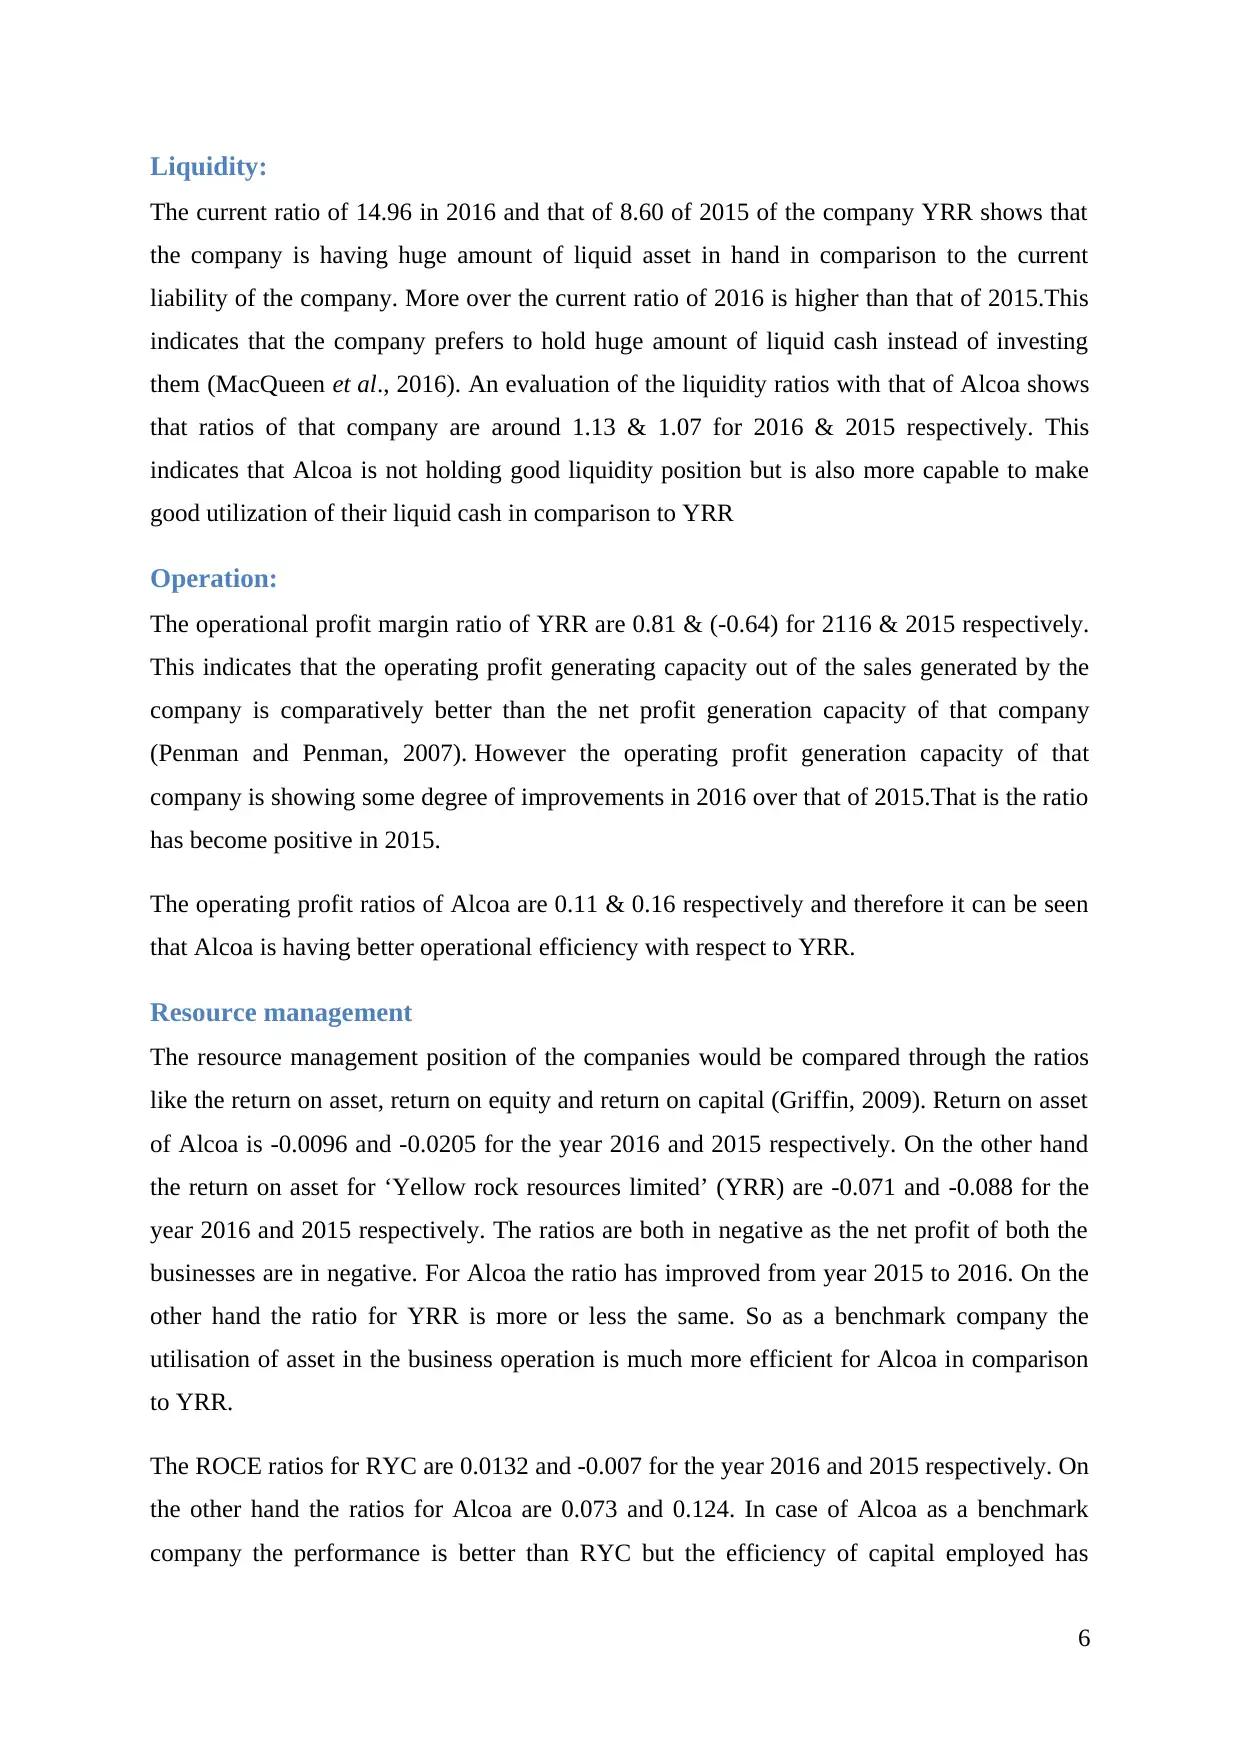
Risk due to interest rate-
[Source: australianvanadium.com.au, 2017]
The above interest bearing account is having huge sum of money which have increase by
76% from the year 2015 to 2016. The increase in interest rate could create risk for this (Van
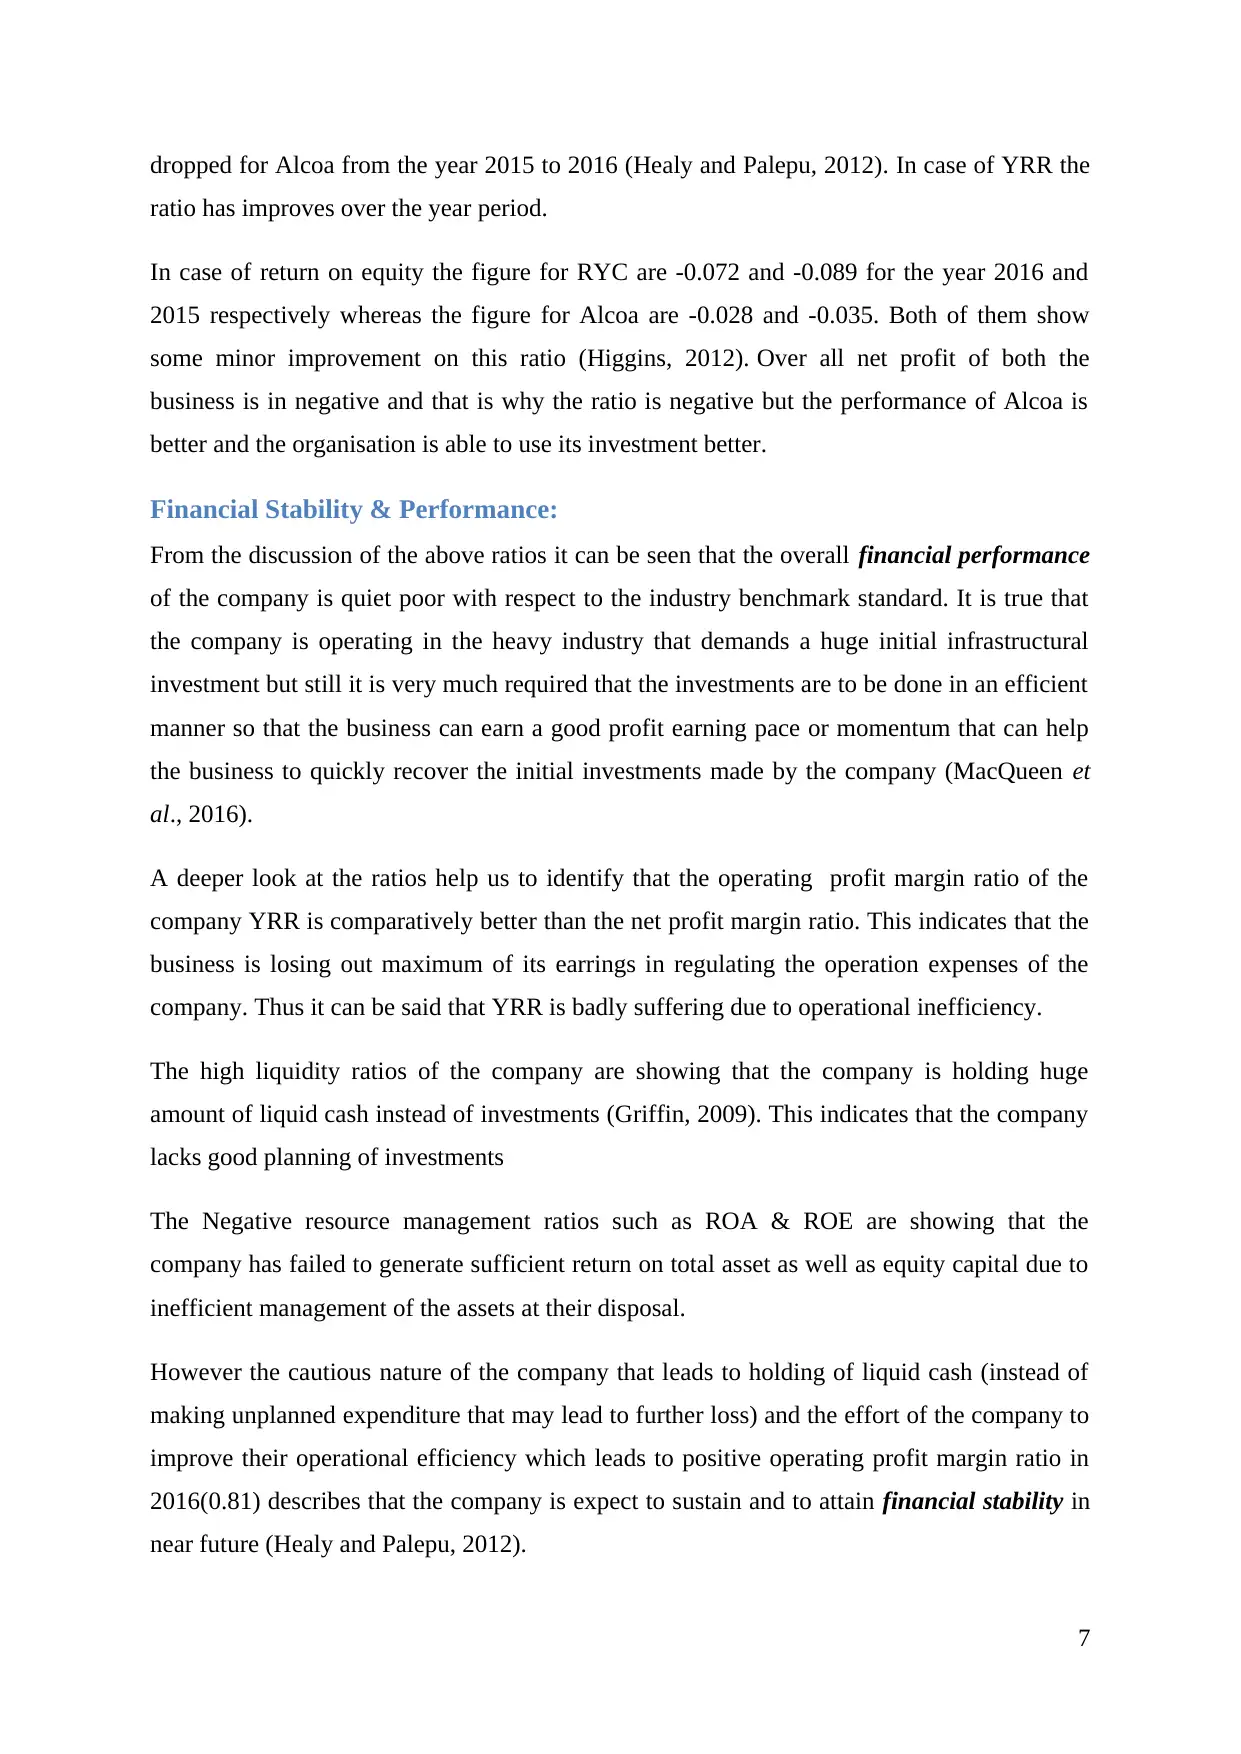
Deventer et al., 2013). The below interest rate pattern for the economy is showing a
downward pattern. So this risk is on the lower side for the company.
[Source: Tradingeconomics, 2017]
Risk of liquidity
The debt level in the YRR does not have any significant exposure in the current business
situation and because of that this risk is very low for the company (Van Deventer et al.,
2013).
8
The financial risk factors of the business need to be under considered properly and those are
given below.
Risk due to interest rate-
[Source: australianvanadium.com.au, 2017]
The above interest bearing account is having huge sum of money which have increase by
76% from the year 2015 to 2016. The increase in interest rate could create risk for this (Van
Deventer et al., 2013). The below interest rate pattern for the economy is showing a
downward pattern. So this risk is on the lower side for the company.
[Source: Tradingeconomics, 2017]
Risk of liquidity
The debt level in the YRR does not have any significant exposure in the current business
situation and because of that this risk is very low for the company (Van Deventer et al.,
2013).
8
Risk from credit
The third parties are trustworthy as stated in the annual report of YRR 2016. In that context
the risk from the bad debt are low in the company (Christoffersen, 2012). So the from the
annual report any significant risk of credit is not visible.
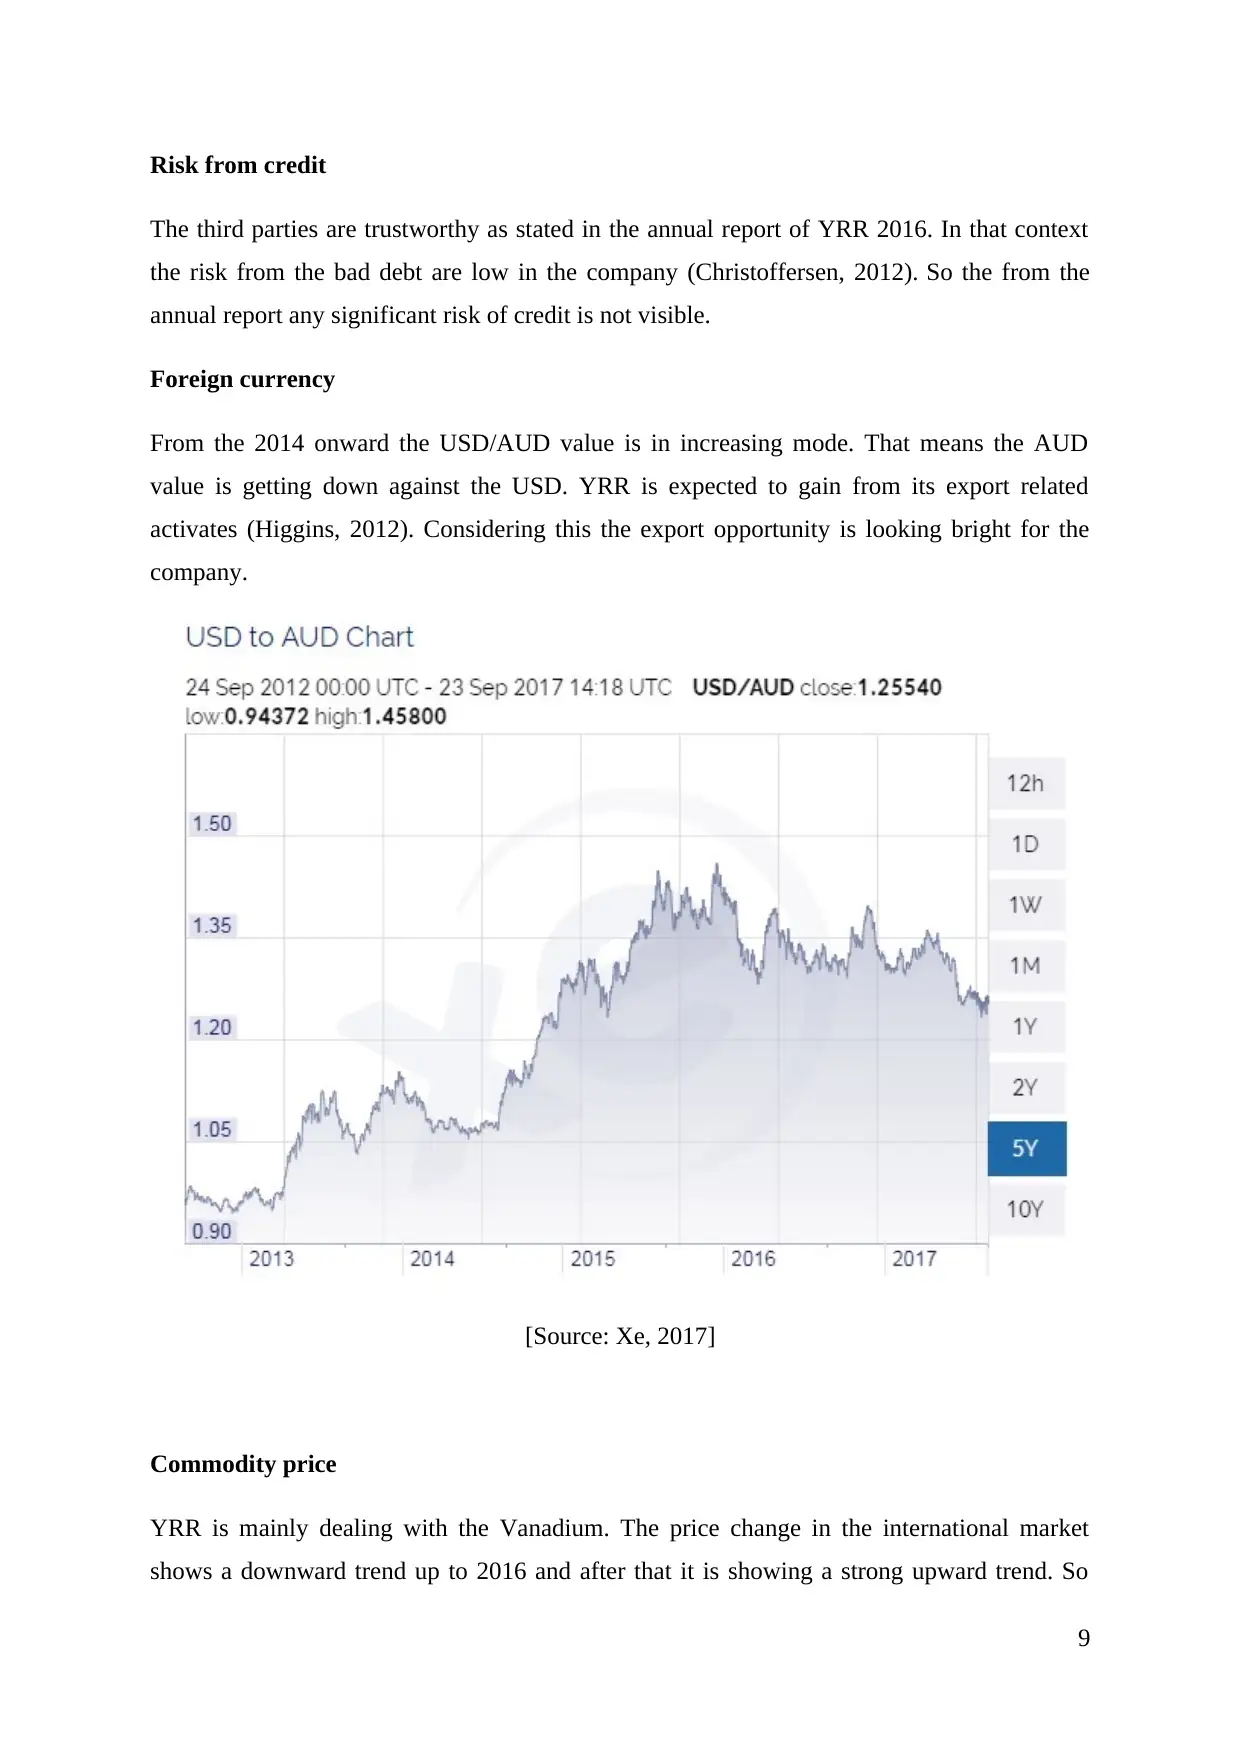
Foreign currency
From the 2014 onward the USD/AUD value is in increasing mode. That means the AUD
value is getting down against the USD. YRR is expected to gain from its export related
activates (Higgins, 2012). Considering this the export opportunity is looking bright for the
company.
[Source: Xe, 2017]
Commodity price
YRR is mainly dealing with the Vanadium. The price change in the international market
shows a downward trend up to 2016 and after that it is showing a strong upward trend. So
9
The third parties are trustworthy as stated in the annual report of YRR 2016. In that context
the risk from the bad debt are low in the company (Christoffersen, 2012). So the from the
annual report any significant risk of credit is not visible.
Foreign currency
From the 2014 onward the USD/AUD value is in increasing mode. That means the AUD
value is getting down against the USD. YRR is expected to gain from its export related
activates (Higgins, 2012). Considering this the export opportunity is looking bright for the
company.
[Source: Xe, 2017]
Commodity price
YRR is mainly dealing with the Vanadium. The price change in the international market
shows a downward trend up to 2016 and after that it is showing a strong upward trend. So
9
⊘ This is a preview!⊘
Do you want full access?
Subscribe today to unlock all pages.
Trusted by 1+ million students worldwide
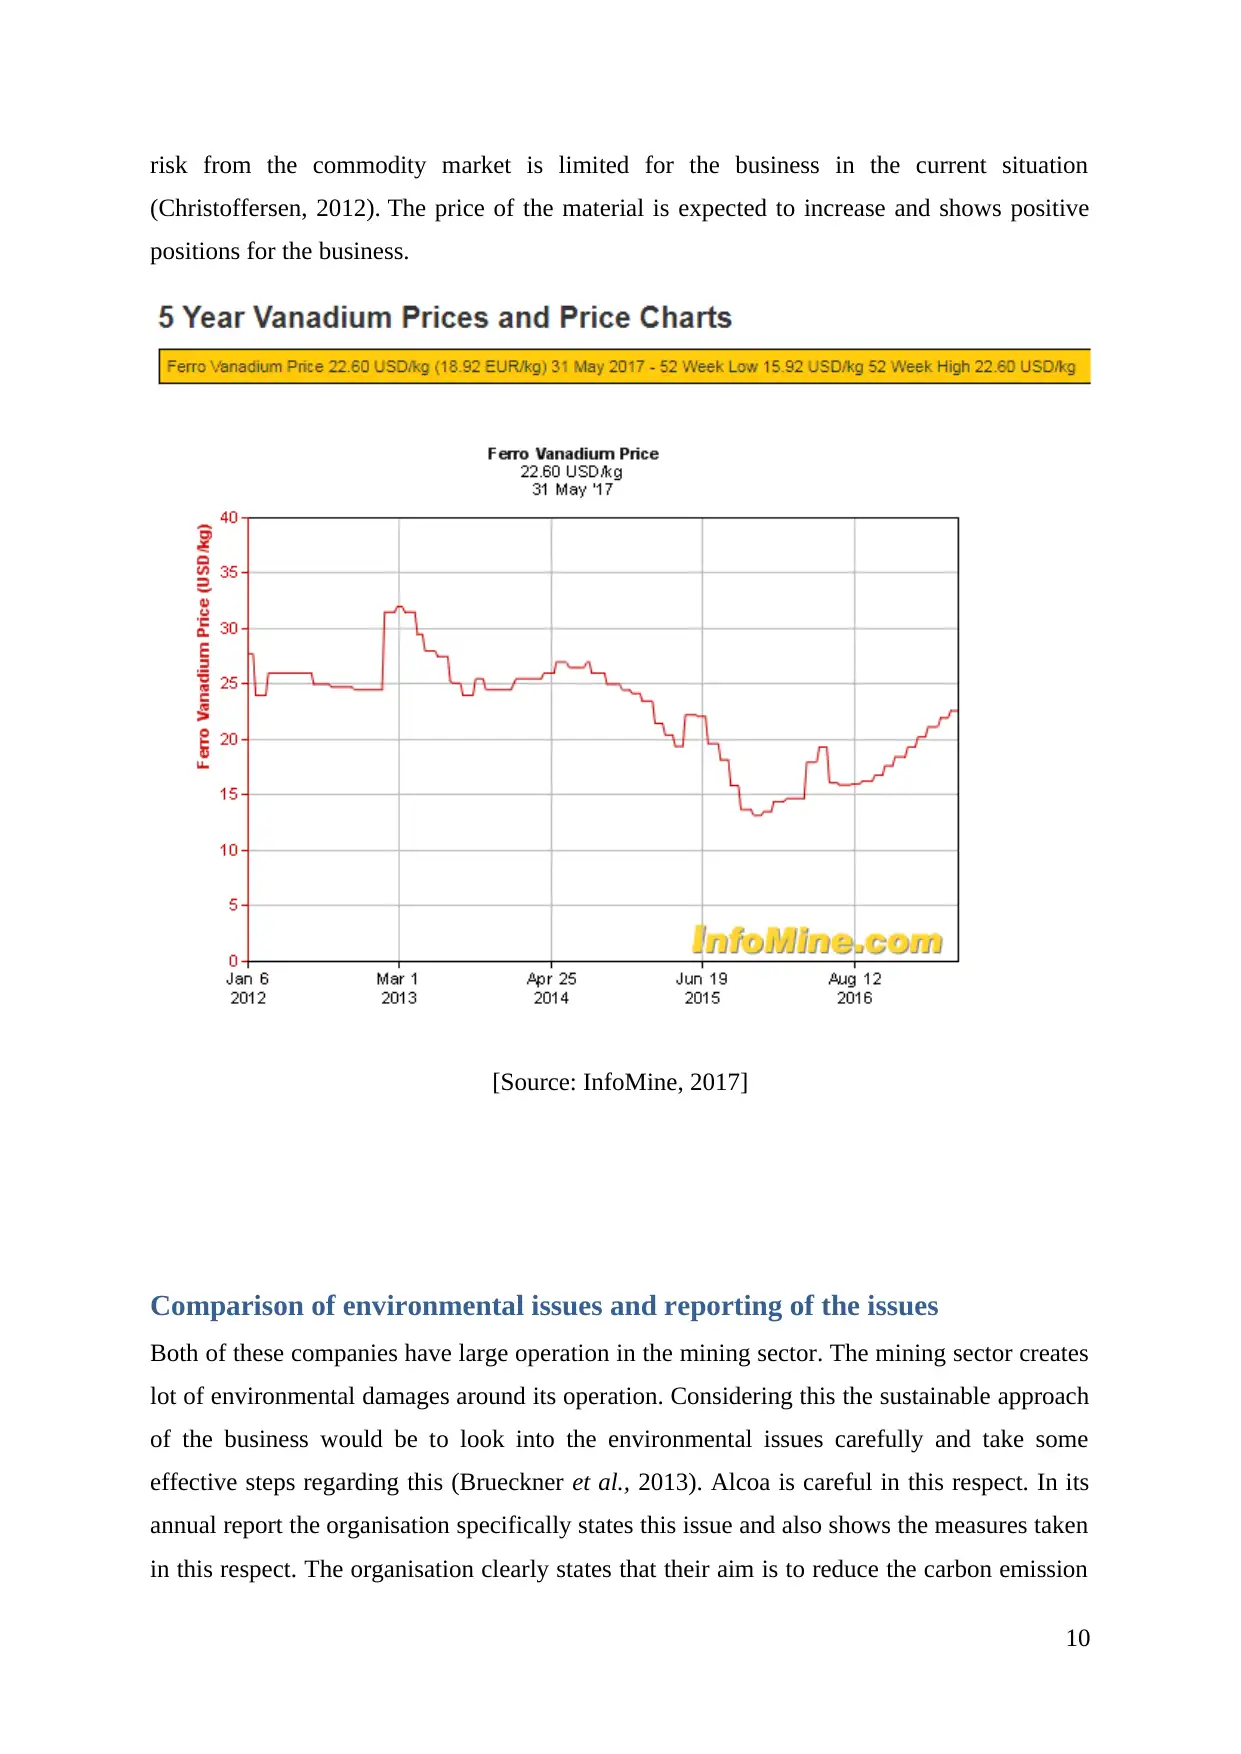
risk from the commodity market is limited for the business in the current situation
(Christoffersen, 2012). The price of the material is expected to increase and shows positive
positions for the business.
[Source: InfoMine, 2017]
Comparison of environmental issues and reporting of the issues
Both of these companies have large operation in the mining sector. The mining sector creates
lot of environmental damages around its operation. Considering this the sustainable approach
of the business would be to look into the environmental issues carefully and take some
effective steps regarding this (Brueckner et al., 2013). Alcoa is careful in this respect. In its
annual report the organisation specifically states this issue and also shows the measures taken
in this respect. The organisation clearly states that their aim is to reduce the carbon emission
10
Paraphrase This Document
Need a fresh take? Get an instant paraphrase of this document with our AI Paraphraser
from the business for the environmental benefit. 5.5 million mt tons of carbon were reduced
from its operation in the year 2015 (asx.com.au, 2015). The organisation got into the
‘Aluminium stewardship initiative’ for the sustainable standard for the aluminium sector in
the world. In the annual report of 2016 the organisation mentions the reduction level of
carbon emission by 6 million mt tons. So it is clear that the business is continuously putting
effort in this context. This report further mentions the reduction of energy intensity by 1%,
consumption of water by around nineteen million m3 and landfill related waste by 86.5k mt
tons (viewmaterial, 2016). The organisation also develops product line called SUSTANA
which are basically based on the recycled material and low carbon emitting process. The
website of the company shows the target for the company in this regard. The organisation
target is to reduce the carbon emission by 30% within 2020 and 35% within completion of
2030, reduce the energy intensity by 10 and 15% within the year 2020 and 2030 respectively,
reduce the landfills by 75 and 100% within the 2020 and 2030 respectively, reduce the fresh
water use by 25% and 30% within the 2020 and 2030 respectively (Alcoa, 2017). All of these
approaches from the Alcoa side show that the company is serious about the environmental
issues and takes effective steps to reduce the impact.
‘Yellow rock resources limited’ do not produce any of such information. In the annual report
of 2015 the organisation says that currently the organisation does not come under any such
regulations. But the long time sustainability of the business is one important thing (Brueckner
et al., 2013). The benchmarking organisation takes a long term position in the business and
its operation. Considering this ‘Yellow rock resources limited’ must also follow those
approaches of environmental measures. Currently this mining sector is having some problems
and there is serious profitability pressure on the organisations. Alcoa is also having problem
in the profitability matter of the business operation but they are following the environmental
responsibility of the business for the long term sustainability. The profitability position of
‘Yellow rock resources limited’ is much worse than Alcoa. Currently the organisation is not
coming under any direction legislative obligation of the environmental matters
(australianvanadium.com.au, 2017). Considering this the business must take effective steps
for the improvement of the profitability position of the business. At the same time the
business must also make a long term commitment for the environmental matters. A diligent
effort in this context from now would help the business to keep low environmental impact in
the long run (Fonseca, 2010). Alcoa is trying to reverse the process by reducing the
environmental impacts whereas ‘Yellow rock resources limited’ can take effective step to
11
keep those environmental impacts at minimum level from now. This would reduce the
requirement of large investment for the organisation to control the standards. Environment is
one of the main challenges that the businesses worldwide are facing and that is why the
businesses need to make long term strategy in this context.
Conclusion:
The study of the financial statements of the company YRR via ratio analysis and the
comparison of those ratios with that of Alcoa reveals the fact that the company is not only
failed to generate any net profit over the investments made by the company, but the
performance of the company is much behind compared to the benchmark standards of the
Aluminium exploration industry in which it is operating (Beck et al., 2008). The main reason
behind this poor performance can be identified (as revealed by the application of the tools of
ratio analysis) as the operational inefficiency of the company.
To improve the financial performance of the company the following recommendations can be
made:
The company should identify each department and operations that are absorbing the
maximum cash expenditure out of the total expenditure of the company
The company should judge the rationality of that expenditure to promote control &
savings of resources (Brigham and Ehrhardt, 2013).
The company should develop and intelligent framework of investment so that it can
invest the liquid assets in hand for earning good profit.
12
⊘ This is a preview!⊘
Do you want full access?
Subscribe today to unlock all pages.
Trusted by 1+ million students worldwide
1 out of 14
Related Documents


Your All-in-One AI-Powered Toolkit for Academic Success.
+13062052269
info@desklib.com
Available 24*7 on WhatsApp / Email
![[object Object]](/_next/static/media/star-bottom.7253800d.svg)
Unlock your academic potential
Copyright © 2020–2026 A2Z Services. All Rights Reserved. Developed and managed by ZUCOL.