Project: Analyzing Australian Worker Data on Income and Education

Verified

Added on  2019/09/23

|3
|349
|236
Project
AI Summary
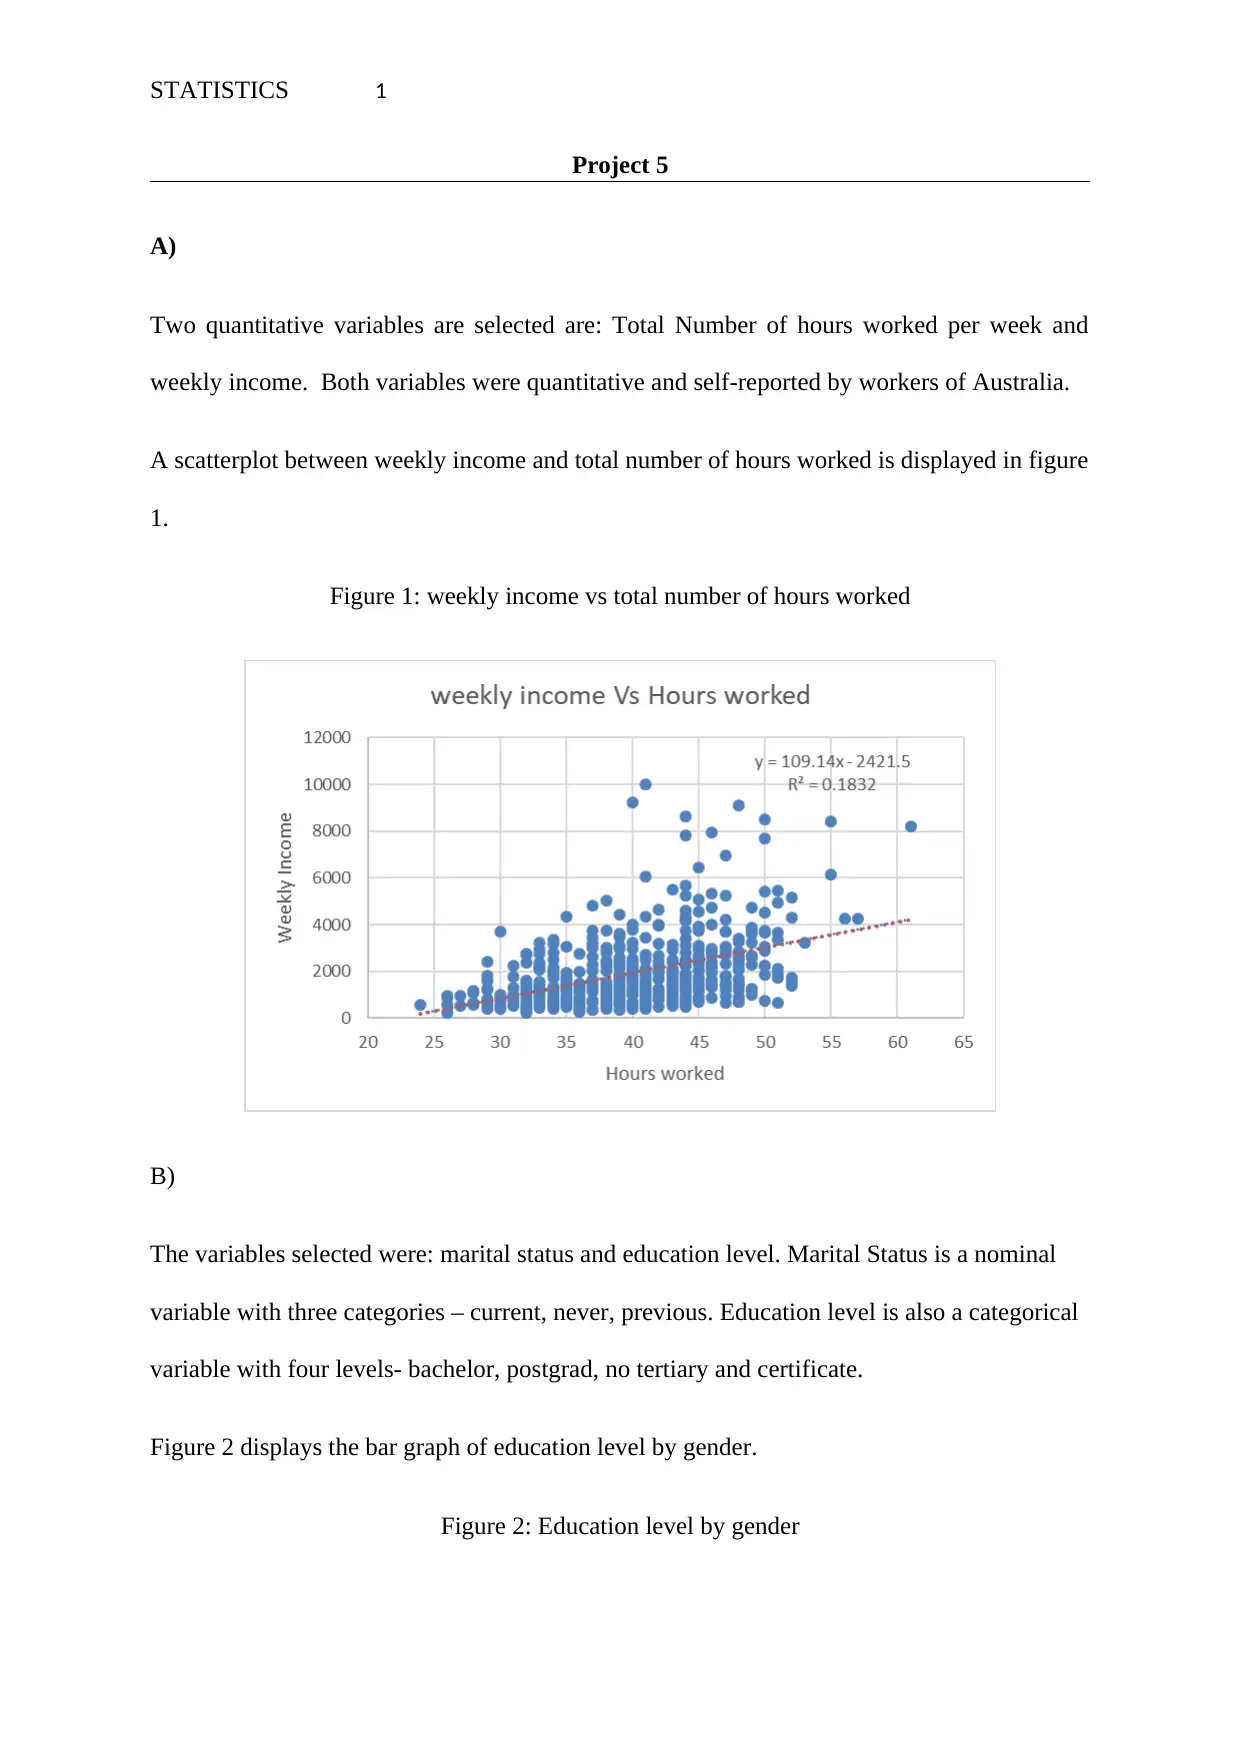
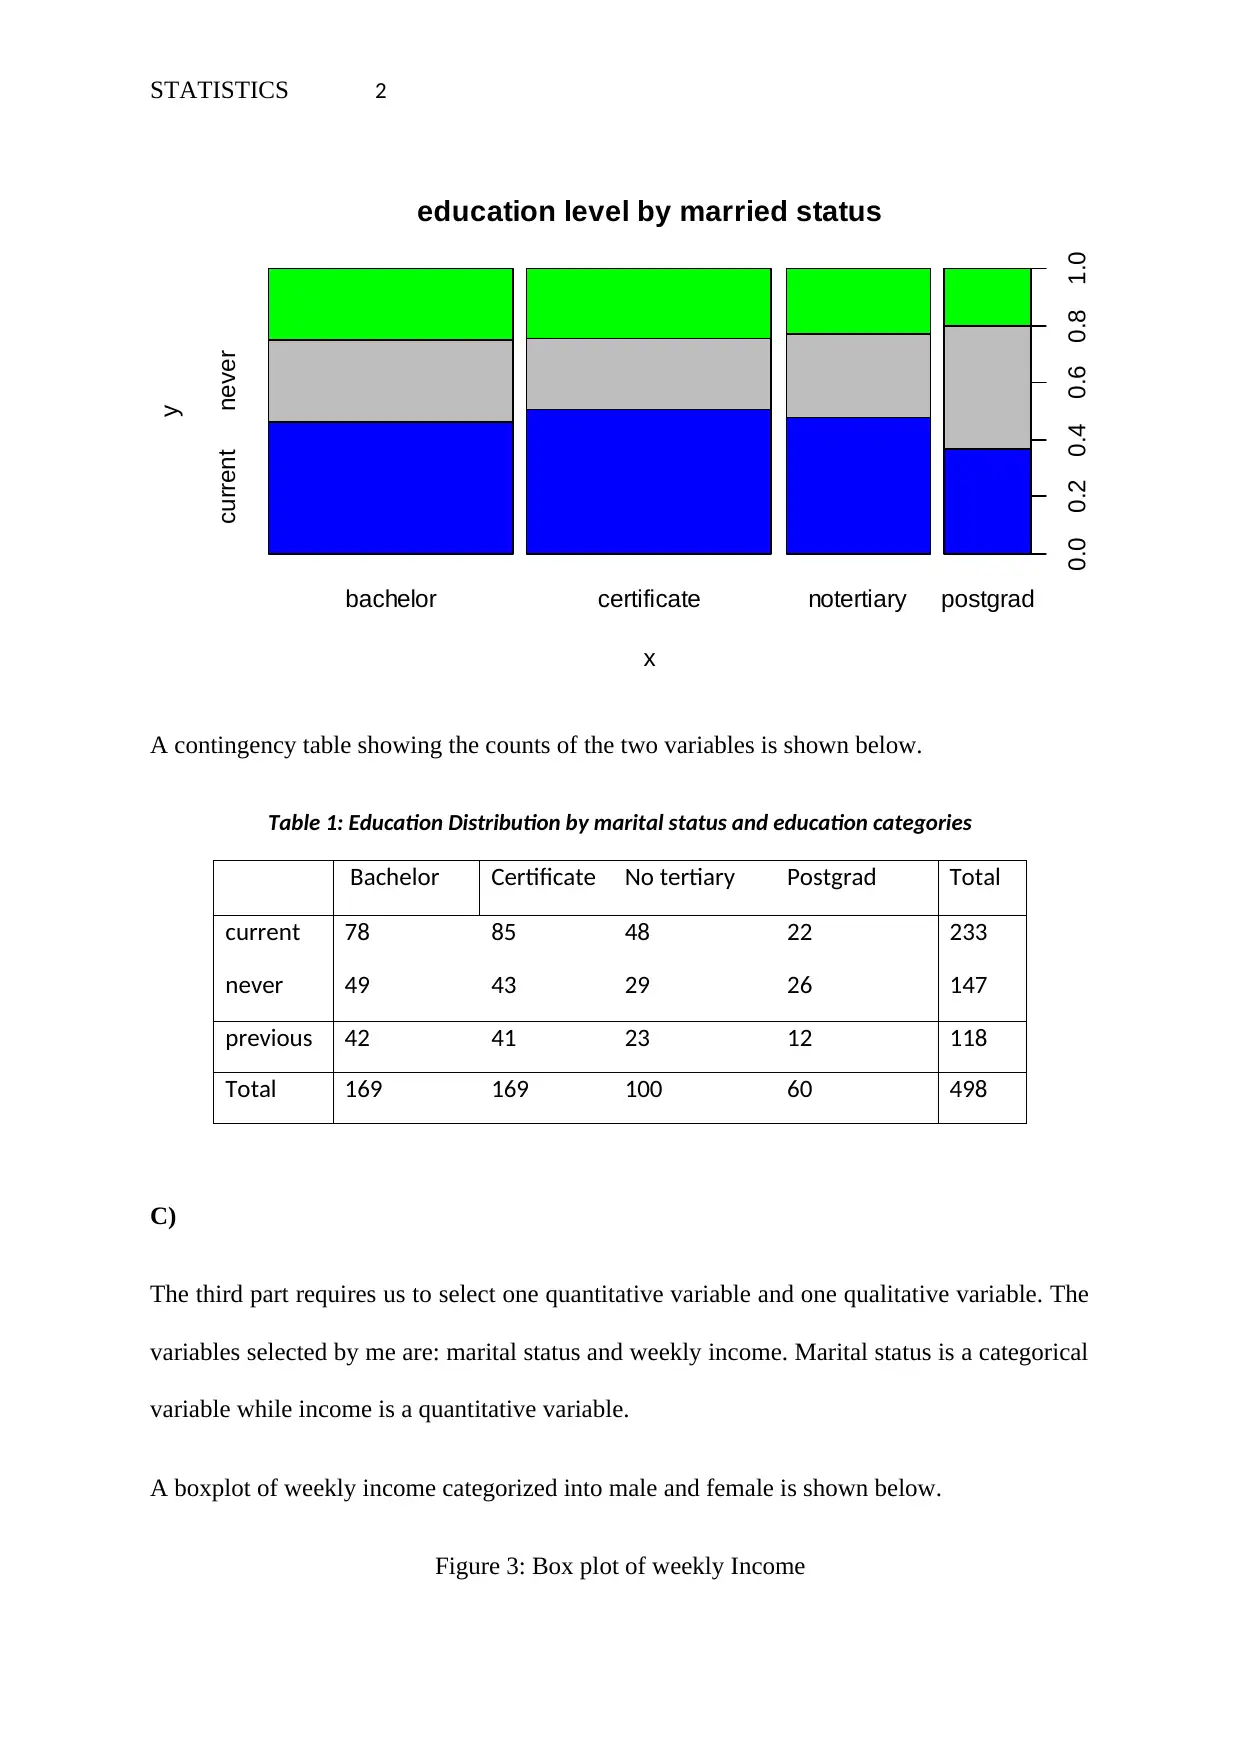
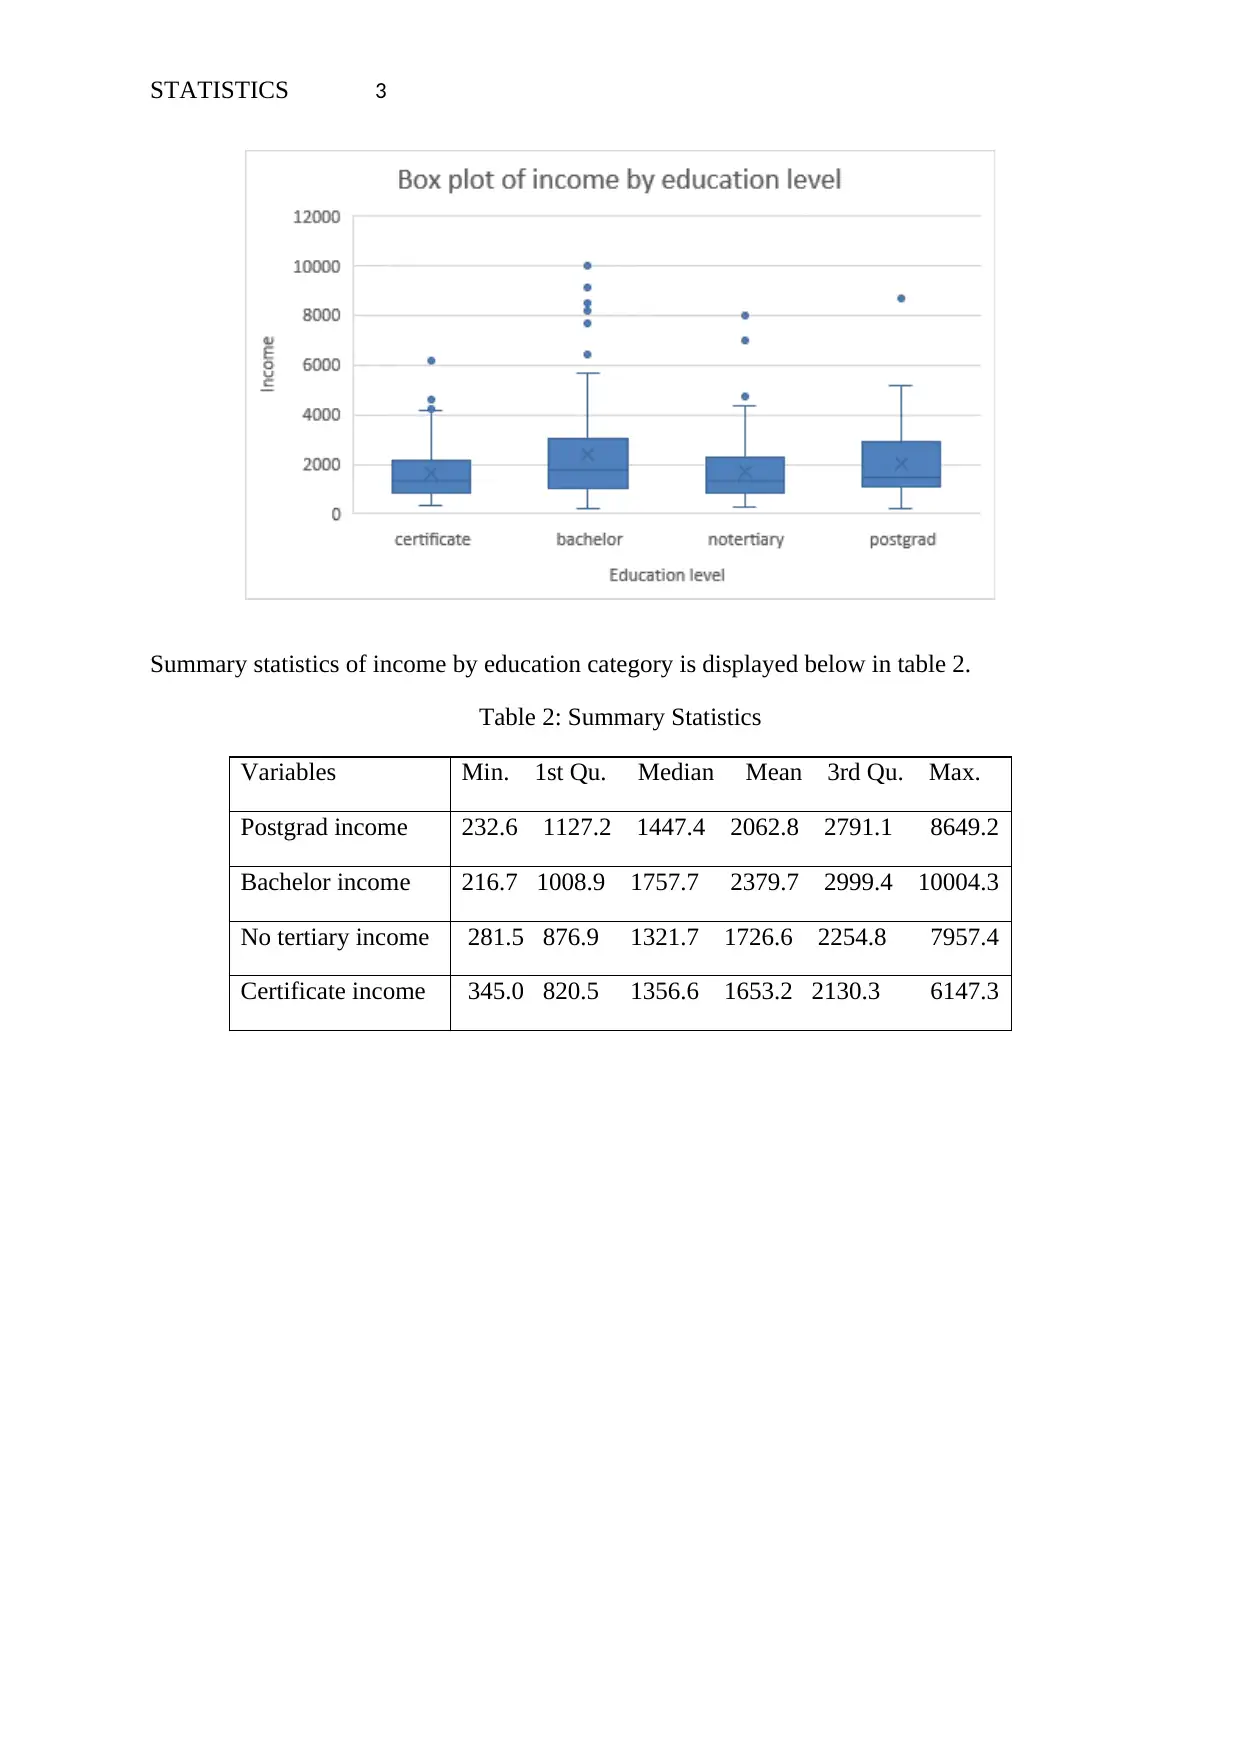
This project analyzes Australian worker data, focusing on the relationships between income, education, and marital status. The project begins by examining the correlation between weekly income and the total number of hours worked, using a scatterplot. It then explores the distribution of education levels by gender using bar graphs and contingency tables. Finally, the project investigates the relationship between marital status and weekly income using boxplots and summary statistics. The analysis includes the use of various statistical tools and data visualization techniques to understand the data and draw meaningful conclusions about the relationships between the variables. The project utilizes descriptive statistics to summarize the data and presents the findings in tables and figures.
Document Page
STATISTICS 1
Project 5
A)
Two quantitative variables are selected are: Total Number of hours worked per week and
weekly income. Both variables were quantitative and self-reported by workers of Australia.
A scatterplot between weekly income and total number of hours worked is displayed in figure
1.
Figure 1: weekly income vs total number of hours worked
B)
The variables selected were: marital status and education level. Marital Status is a nominal
variable with three categories – current, never, previous. Education level is also a categorical
variable with four levels- bachelor, postgrad, no tertiary and certificate.
Figure 2 displays the bar graph of education level by gender.
Figure 2: Education level by gender
tabler-icon-diamond-filled.svg

Paraphrase This Document

Need a fresh take? Get an instant paraphrase of this document with our AI Paraphraser
Document Page
STATISTICS 2
education level by married status
x
y
bachelor certificate notertiary postgrad
current never
0.0 0.2 0.4 0.6 0.8 1.0
A contingency table showing the counts of the two variables is shown below.
Table 1: Education Distribution by marital status and education categories
Bachelor Certificate No tertiary Postgrad Total
current 78 85 48 22 233
never 49 43 29 26 147
previous 42 41 23 12 118
Total 169 169 100 60 498
C)
The third part requires us to select one quantitative variable and one qualitative variable. The
variables selected by me are: marital status and weekly income. Marital status is a categorical
variable while income is a quantitative variable.
A boxplot of weekly income categorized into male and female is shown below.
Figure 3: Box plot of weekly Income
Document Page
STATISTICS 3
Summary statistics of income by education category is displayed below in table 2.
Table 2: Summary Statistics
Variables Min. 1st Qu. Median Mean 3rd Qu. Max.
Postgrad income 232.6 1127.2 1447.4 2062.8 2791.1 8649.2
Bachelor income 216.7 1008.9 1757.7 2379.7 2999.4 10004.3
No tertiary income 281.5 876.9 1321.7 1726.6 2254.8 7957.4
Certificate income 345.0 820.5 1356.6 1653.2 2130.3 6147.3
chevron_up_icon
1 out of 3
circle_padding
hide_on_mobile
zoom_out_icon
[object Object]