Statistics Report: Australia's Trade
VerifiedAdded on 2020/02/03
|13
|2048
|94
Report
AI Summary
This statistical report analyzes Australia's import and export price indices from 2000 to 2015. It uses various statistical techniques, including graphical representation (column charts and trend lines), to identify trends and relationships. The report finds an upward trend in both import and export prices, with export prices showing greater variability. The analysis explores the reasons behind these trends, including reduced trade barriers and increased domestic spending, particularly on luxury imports. The report also examines the relationship between the all-ordinaries index and inflation, calculating covariance and correlation coefficients. Finally, it discusses the implications of these trends for Australian businesses, highlighting the need for strategies to improve export growth and manage the balance of trade.

STATISTICS
Paraphrase This Document
Need a fresh take? Get an instant paraphrase of this document with our AI Paraphraser
ABSTRACT
The development of statistical techniques have changes a world for data analysis and
decision making. The report proposed herewith emphasizes on adoption of range of statistical
techniques so as to evaluate export & import trend in Australia. Further, the inflation rate of
economy has also been analysed. It is seen that the country possesses high level of bargaining
power due to availability of adequate amount of technical and non-technical resources. Further, a
lower degree of relationship is established between inflation and values of ordinaries index. It
can be said that Australia with its focused approach of increasing exports and controlling
inflation is expected to develop resources and improve life of citizens.
Table of Contents
Abstract............................................................................................................................................2
Introduction......................................................................................................................................5
Question 1........................................................................................................................................5
(a) Indicating data into yearly......................................................................................................5
(b) Discussing the most appropriate graph to present this statistics and then presenting it in a
graph............................................................................................................................................6
(c) Discussing emerging trends in Australia export and import prices in the last few years.......8
(d) Explaining why this trend occurred in the recent years.........................................................8
(e) Implication of this trend for Australian business.................................................................11
Question 2......................................................................................................................................12
a) Calculating covariance & coorelation coeffficient between X & Y.....................................12
(b) Relationship between all-ordinary index and inflation........................................................15
(c & d) Determining the least square line and coefficient of determination R2........................16
Conclusion.....................................................................................................................................17
References......................................................................................................................................19
⊘ This is a preview!⊘
Do you want full access?
Subscribe today to unlock all pages.
Trusted by 1+ million students worldwide
List of tables
Table 1: Yearly import and export prices........................................................................................5
Table 2: Correlation- coefficient...................................................................................................12
Table 3: Covariance.......................................................................................................................12
Table 4: Calculation for Covariance..............................................................................................12
Table 5: Calculation for Correlation coefficient............................................................................14
List of Figures
Figure 1: Column chart: import and export prices...........................................................................7
Figure 2: Trend line- Import and export prices...............................................................................7
Figure 3: Australia’s exports 1963 to 1990.....................................................................................9
Figure 4: Australia’s exports 1989 to 2014.....................................................................................9
Figure 5: Australia’s top 5 exports then and now..........................................................................10
Figure 6: Sector wise exports of Australia....................................................................................11
Paraphrase This Document
Need a fresh take? Get an instant paraphrase of this document with our AI Paraphraser
INTRODUCTION
The internal trade balance and activities related to import and export needs to be
monitored within an economy. It is through application of statistical techniques that data for past
is analysed and future trend is forecasted. The numerical analysis and graphical presentation aids
in catering to the requirements of all related parties. Further, it helps in designing the most
suitable strategy and handling with complex situations of the businesses. The report proposed
herewith emphasizes on analyzing import and export price index of Australia. The statistical data
for past has been analysed through graphical presentation. Furthermore, the recent export and
import trends within an economy is analysed through the report. Moreover, the inflation rate and
ordinary index prices is evaluated through application of statistical tools such as correlation, co-
variance and graphical representation of data. In addition to this, suitable chart is selected to
present the information in a most effective manner.
QUESTION 1
(a) Indicating data into yearly
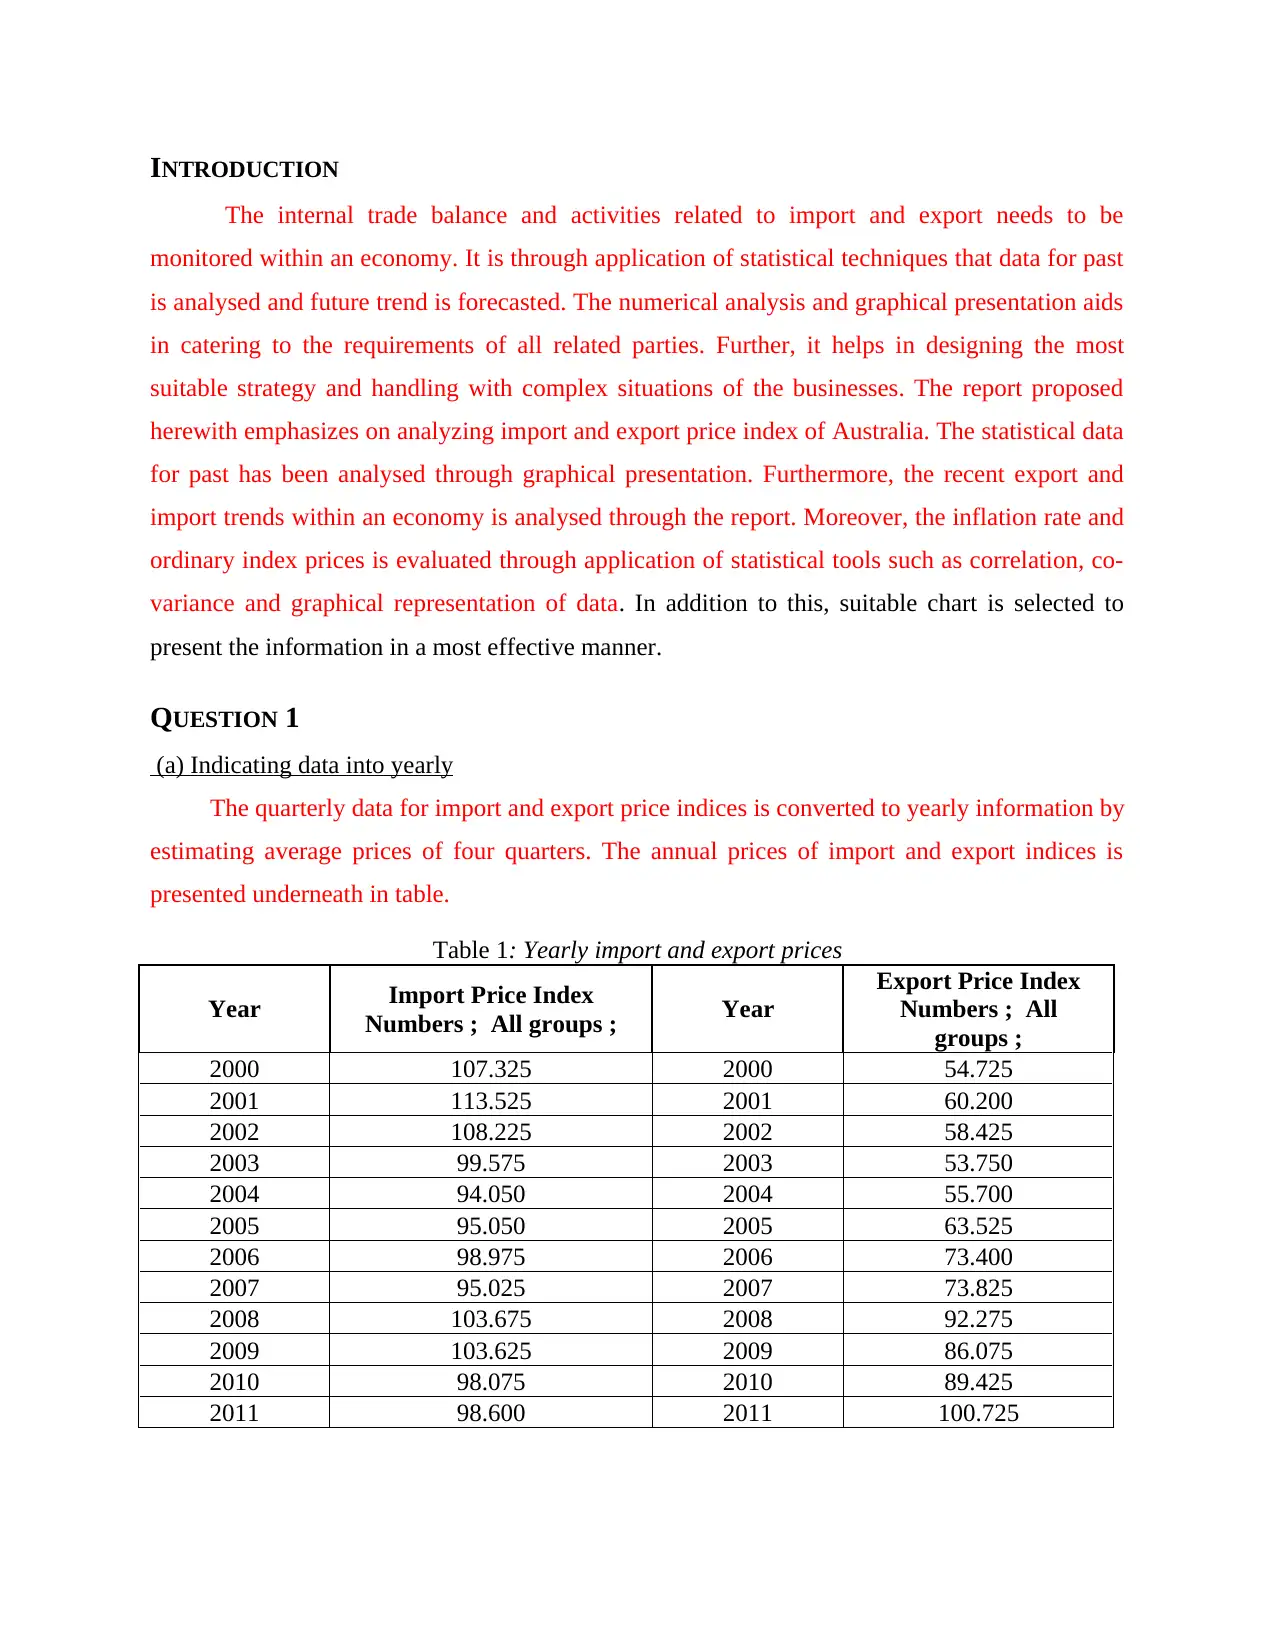
The quarterly data for import and export price indices is converted to yearly information by
estimating average prices of four quarters. The annual prices of import and export indices is
presented underneath in table.
Table 1: Yearly import and export prices
Year Import Price Index
Numbers ; All groups ; Year
Export Price Index
Numbers ; All
groups ;
2000 107.325 2000 54.725
2001 113.525 2001 60.200
2002 108.225 2002 58.425
2003 99.575 2003 53.750
2004 94.050 2004 55.700
2005 95.050 2005 63.525
2006 98.975 2006 73.400
2007 95.025 2007 73.825
2008 103.675 2008 92.275
2009 103.625 2009 86.075
2010 98.075 2010 89.425
2011 98.600 2011 100.725
The internal trade balance and activities related to import and export needs to be
monitored within an economy. It is through application of statistical techniques that data for past
is analysed and future trend is forecasted. The numerical analysis and graphical presentation aids
in catering to the requirements of all related parties. Further, it helps in designing the most
suitable strategy and handling with complex situations of the businesses. The report proposed
herewith emphasizes on analyzing import and export price index of Australia. The statistical data
for past has been analysed through graphical presentation. Furthermore, the recent export and
import trends within an economy is analysed through the report. Moreover, the inflation rate and
ordinary index prices is evaluated through application of statistical tools such as correlation, co-
variance and graphical representation of data. In addition to this, suitable chart is selected to
present the information in a most effective manner.
QUESTION 1
(a) Indicating data into yearly
The quarterly data for import and export price indices is converted to yearly information by
estimating average prices of four quarters. The annual prices of import and export indices is
presented underneath in table.
Table 1: Yearly import and export prices
Year Import Price Index
Numbers ; All groups ; Year
Export Price Index
Numbers ; All
groups ;
2000 107.325 2000 54.725
2001 113.525 2001 60.200
2002 108.225 2002 58.425
2003 99.575 2003 53.750
2004 94.050 2004 55.700
2005 95.050 2005 63.525
2006 98.975 2006 73.400
2007 95.025 2007 73.825
2008 103.675 2008 92.275
2009 103.625 2009 86.075
2010 98.075 2010 89.425
2011 98.600 2011 100.725
2012 100.075 2012 92.825
2013 102.375 2013 92.350
2014 105.725 2014 88.950
2015 106.800 2015 80.725
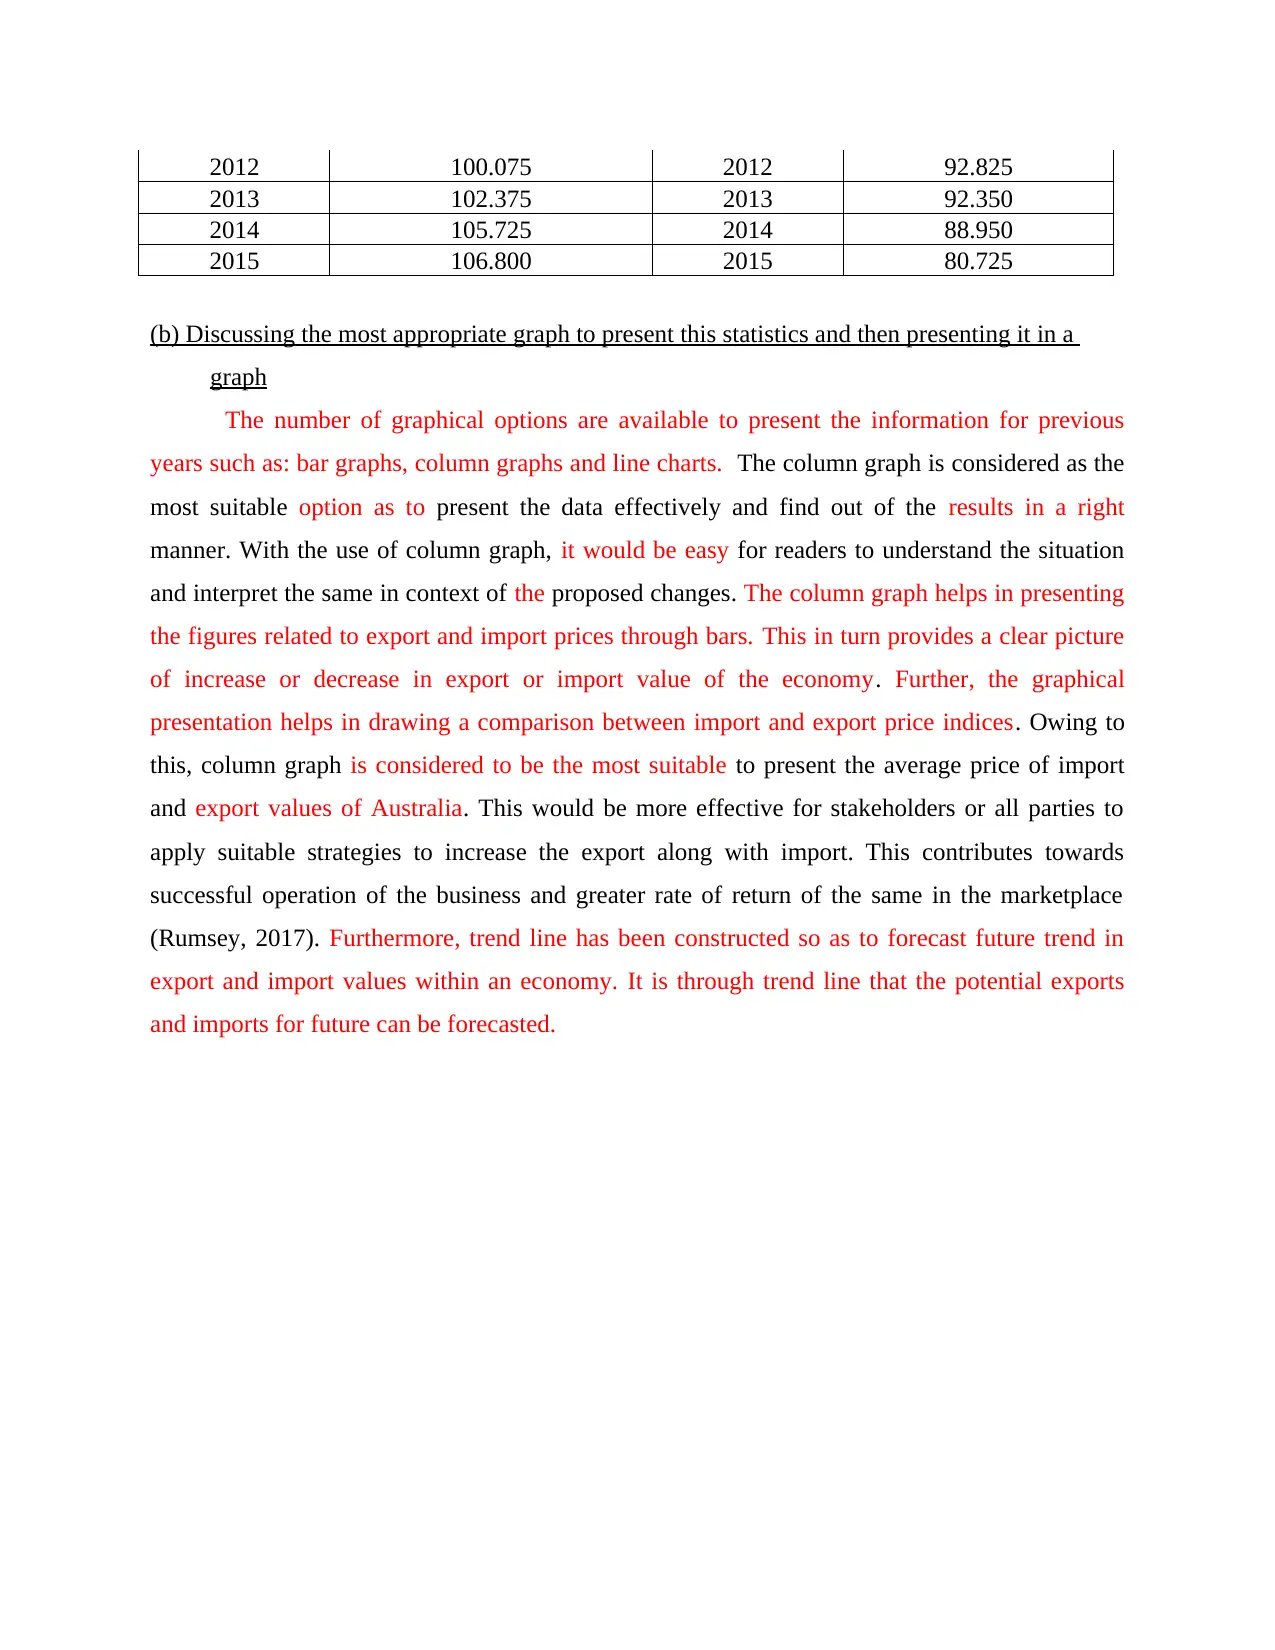
(b) Discussing the most appropriate graph to present this statistics and then presenting it in a
graph
The number of graphical options are available to present the information for previous
years such as: bar graphs, column graphs and line charts. The column graph is considered as the
most suitable option as to present the data effectively and find out of the results in a right
manner. With the use of column graph, it would be easy for readers to understand the situation
and interpret the same in context of the proposed changes. The column graph helps in presenting
the figures related to export and import prices through bars. This in turn provides a clear picture
of increase or decrease in export or import value of the economy. Further, the graphical
presentation helps in drawing a comparison between import and export price indices. Owing to
this, column graph is considered to be the most suitable to present the average price of import
and export values of Australia. This would be more effective for stakeholders or all parties to
apply suitable strategies to increase the export along with import. This contributes towards
successful operation of the business and greater rate of return of the same in the marketplace
(Rumsey, 2017). Furthermore, trend line has been constructed so as to forecast future trend in
export and import values within an economy. It is through trend line that the potential exports
and imports for future can be forecasted.
2013 102.375 2013 92.350
2014 105.725 2014 88.950
2015 106.800 2015 80.725
(b) Discussing the most appropriate graph to present this statistics and then presenting it in a
graph
The number of graphical options are available to present the information for previous
years such as: bar graphs, column graphs and line charts. The column graph is considered as the
most suitable option as to present the data effectively and find out of the results in a right
manner. With the use of column graph, it would be easy for readers to understand the situation
and interpret the same in context of the proposed changes. The column graph helps in presenting
the figures related to export and import prices through bars. This in turn provides a clear picture
of increase or decrease in export or import value of the economy. Further, the graphical
presentation helps in drawing a comparison between import and export price indices. Owing to
this, column graph is considered to be the most suitable to present the average price of import
and export values of Australia. This would be more effective for stakeholders or all parties to
apply suitable strategies to increase the export along with import. This contributes towards
successful operation of the business and greater rate of return of the same in the marketplace
(Rumsey, 2017). Furthermore, trend line has been constructed so as to forecast future trend in
export and import values within an economy. It is through trend line that the potential exports
and imports for future can be forecasted.
⊘ This is a preview!⊘
Do you want full access?
Subscribe today to unlock all pages.
Trusted by 1+ million students worldwide
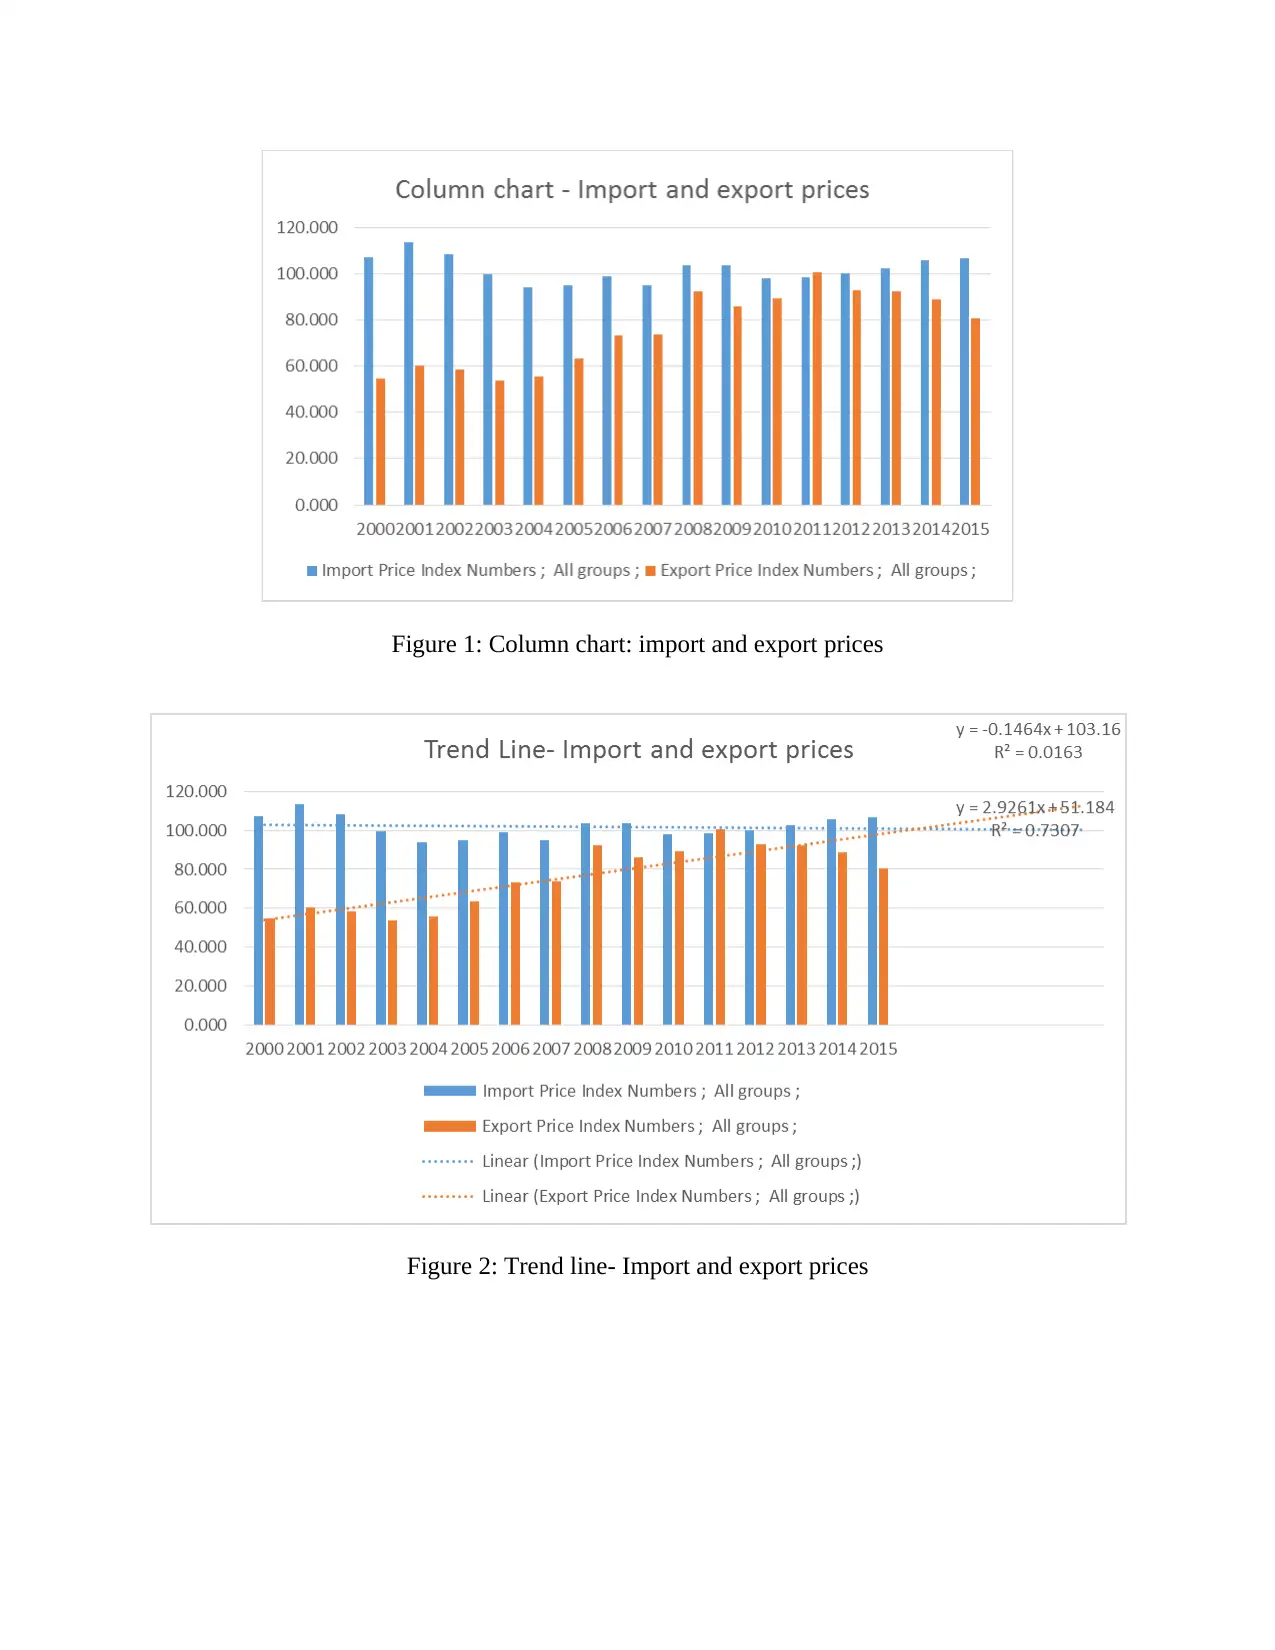
Figure 1: Column chart: import and export prices
Figure 2: Trend line- Import and export prices
Figure 2: Trend line- Import and export prices
Paraphrase This Document
Need a fresh take? Get an instant paraphrase of this document with our AI Paraphraser
(c) Discussing emerging trends in Australia export and import prices in the last few years
The column graph presented above indicates the upward trend for values related to
import and export price index. This would be effective for business to increase the revenue.
However, company consumer is spending higher amount for purchasing luxury product.
Furthermore, export price index is showing that greater reduction in comparison to index.
Towing to this, it can be said that downward trend has been derived for the future performance of
the business. This proves to be effective in creating long run success of the business with the
increased rate of return. It is seen that export prices are rising at increasing rate over the period of
fifteen years. However, the rise in import prices is considered to be at constant rate. This in turn
shows that the country is emphasizing on increasing earnings through rising level of exports.
However, the economy prefers to import at comparatively lower prices. It can be said that
Australia, being a developed economy, possesses high level of bargaining power due to
availability of adequate amount of technical and non-technical resources. This in turn indicates
that the country has huge potential to increase foreign earnings since gap between export and
import prices has been widened year-on-year basis.
(d) Explaining why this trend occurred in the recent years
The aforementioned graph is showing the greater variable in the export and import price
index to a great extent. It assists corporation to integrate all related activities and support
business in delivering good quality of services to large number of buyers. Furthermore, trade
barriers and other related regulation in the country were relatively less. Owing to this, import
price index has the upward trend bu the export price index is having greater variation. It enables
corporation to integrate all related activities and produce valid outcome in the direction of
growth and success of the authority as appropriate strategies can be developed on right time.
However, the level of inflation in the country was also increasing and decreasing. Owing to this,
export price index is not stable. Instead it is varying to a great extent. Owing to this, variation
can also be found under balance of trade. However, strong growth in the income push up the
import to a great extent. It is because since 1990s country have not been faced recession and at
the same time, spending limit has been increased. However, the imported goods covered the
luxury items. A the same time reduction in tariff over the time is another potential reason behind
higher import price index. The value of exports for goods and services has been increased
The column graph presented above indicates the upward trend for values related to
import and export price index. This would be effective for business to increase the revenue.
However, company consumer is spending higher amount for purchasing luxury product.
Furthermore, export price index is showing that greater reduction in comparison to index.
Towing to this, it can be said that downward trend has been derived for the future performance of
the business. This proves to be effective in creating long run success of the business with the
increased rate of return. It is seen that export prices are rising at increasing rate over the period of
fifteen years. However, the rise in import prices is considered to be at constant rate. This in turn
shows that the country is emphasizing on increasing earnings through rising level of exports.
However, the economy prefers to import at comparatively lower prices. It can be said that
Australia, being a developed economy, possesses high level of bargaining power due to
availability of adequate amount of technical and non-technical resources. This in turn indicates
that the country has huge potential to increase foreign earnings since gap between export and
import prices has been widened year-on-year basis.
(d) Explaining why this trend occurred in the recent years
The aforementioned graph is showing the greater variable in the export and import price
index to a great extent. It assists corporation to integrate all related activities and support
business in delivering good quality of services to large number of buyers. Furthermore, trade
barriers and other related regulation in the country were relatively less. Owing to this, import
price index has the upward trend bu the export price index is having greater variation. It enables
corporation to integrate all related activities and produce valid outcome in the direction of
growth and success of the authority as appropriate strategies can be developed on right time.
However, the level of inflation in the country was also increasing and decreasing. Owing to this,
export price index is not stable. Instead it is varying to a great extent. Owing to this, variation
can also be found under balance of trade. However, strong growth in the income push up the
import to a great extent. It is because since 1990s country have not been faced recession and at
the same time, spending limit has been increased. However, the imported goods covered the
luxury items. A the same time reduction in tariff over the time is another potential reason behind
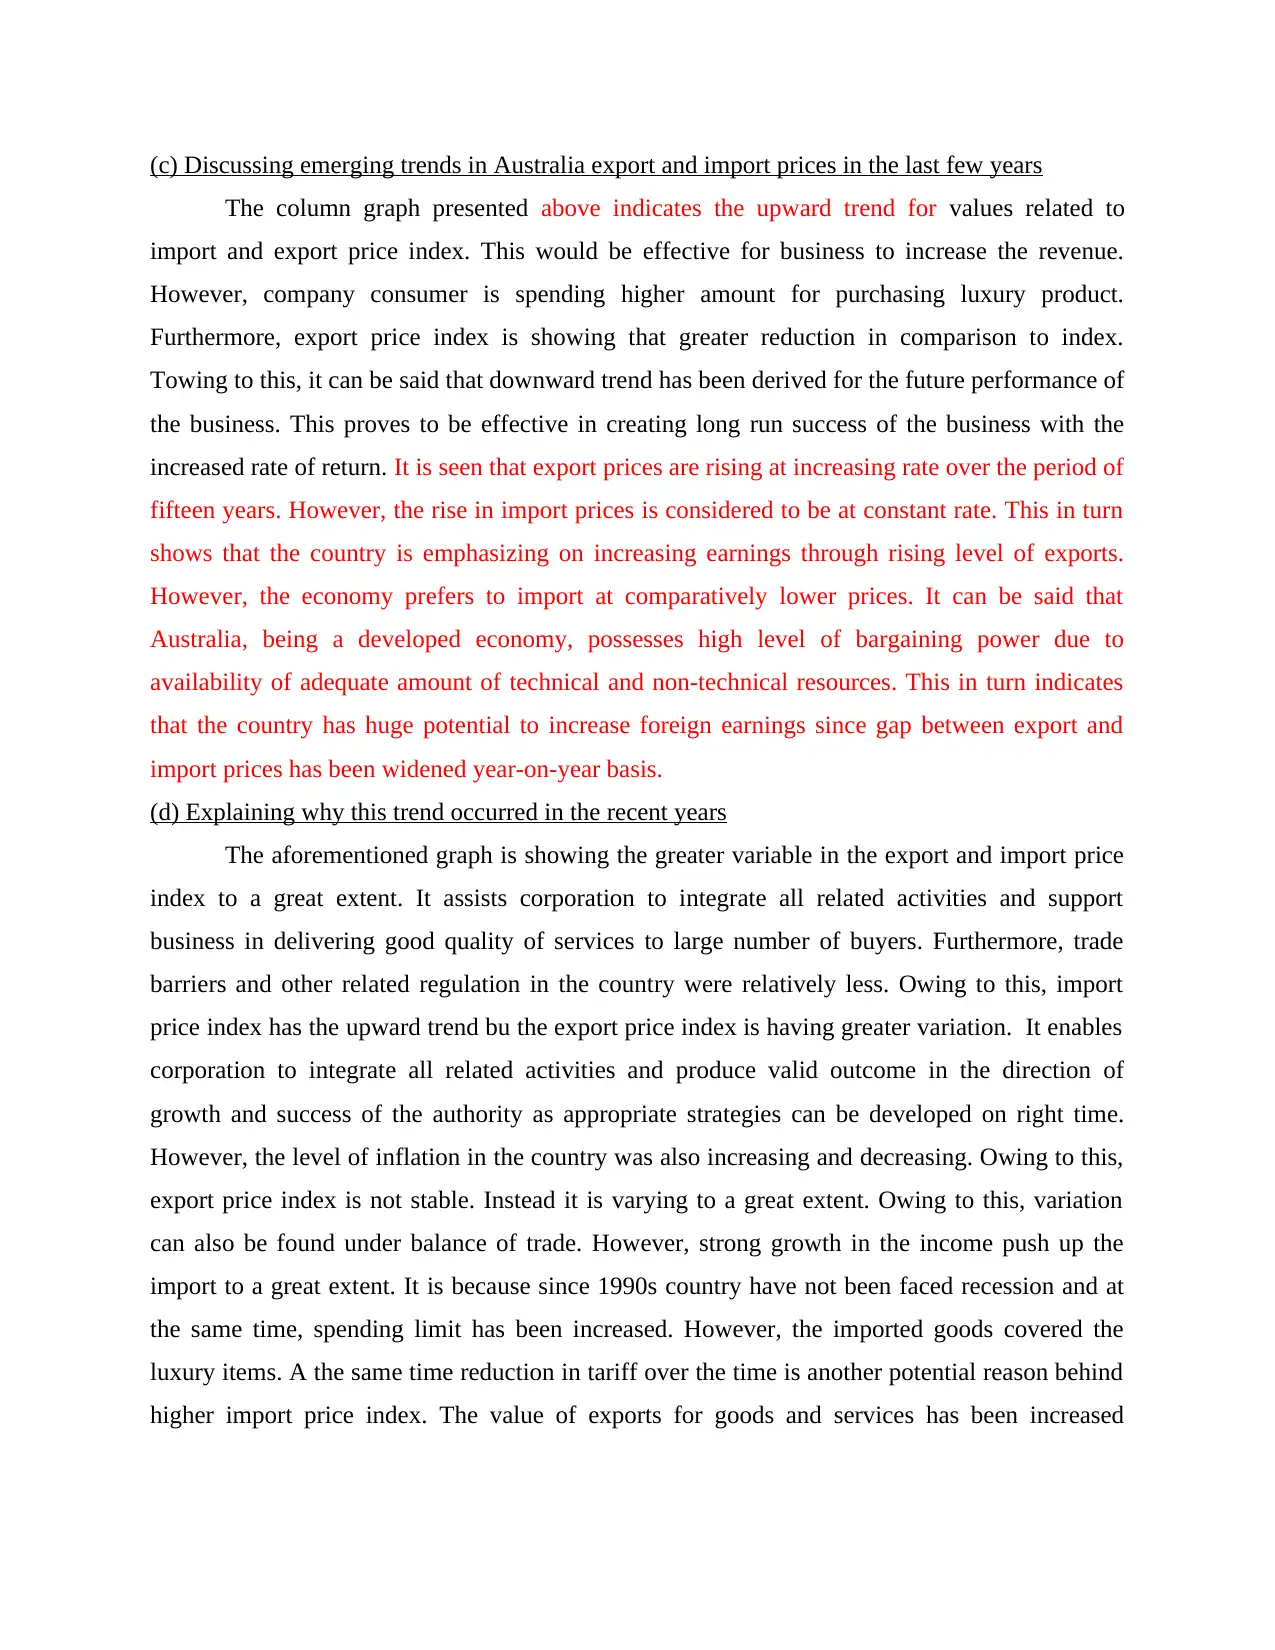
higher import price index. The value of exports for goods and services has been increased
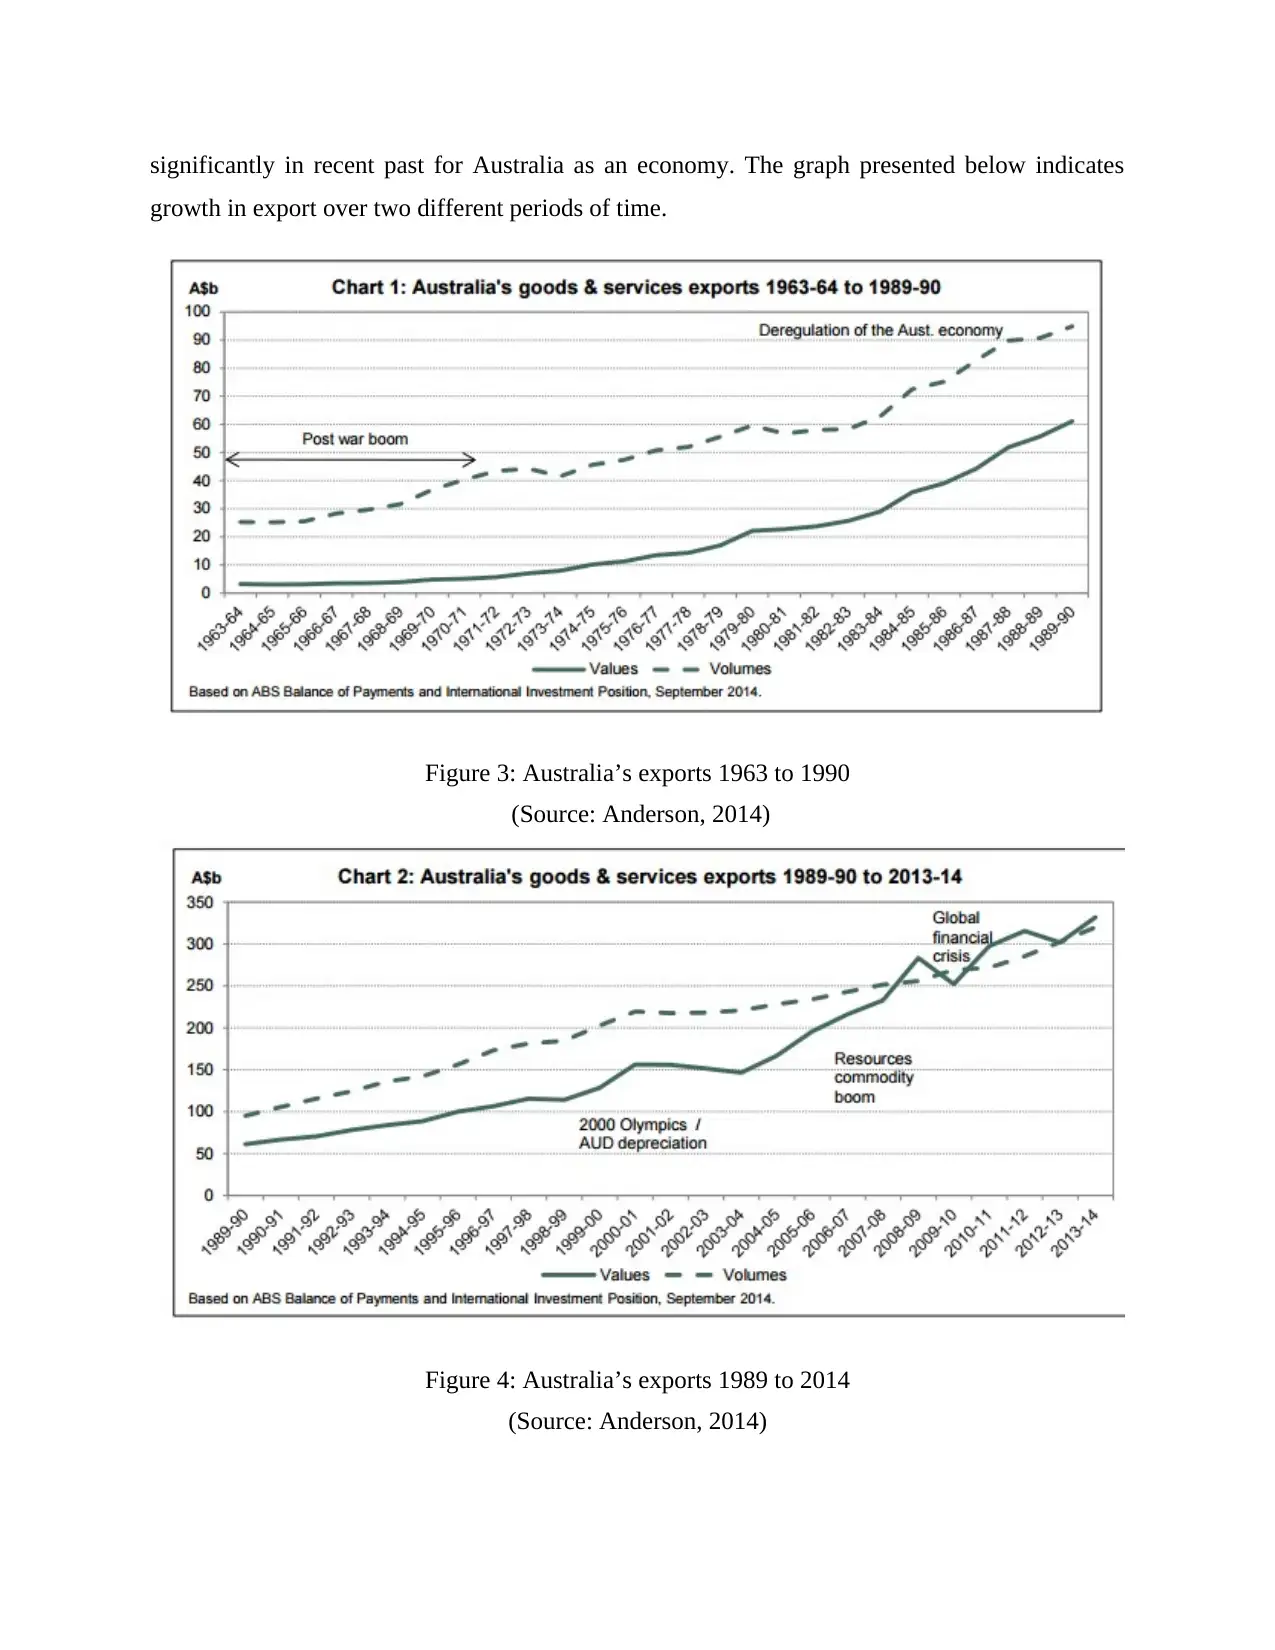
significantly in recent past for Australia as an economy. The graph presented below indicates
growth in export over two different periods of time.
Figure 3: Australia’s exports 1963 to 1990
(Source: Anderson, 2014)
Figure 4: Australia’s exports 1989 to 2014
(Source: Anderson, 2014)
growth in export over two different periods of time.
Figure 3: Australia’s exports 1963 to 1990
(Source: Anderson, 2014)
Figure 4: Australia’s exports 1989 to 2014
(Source: Anderson, 2014)
⊘ This is a preview!⊘
Do you want full access?
Subscribe today to unlock all pages.
Trusted by 1+ million students worldwide
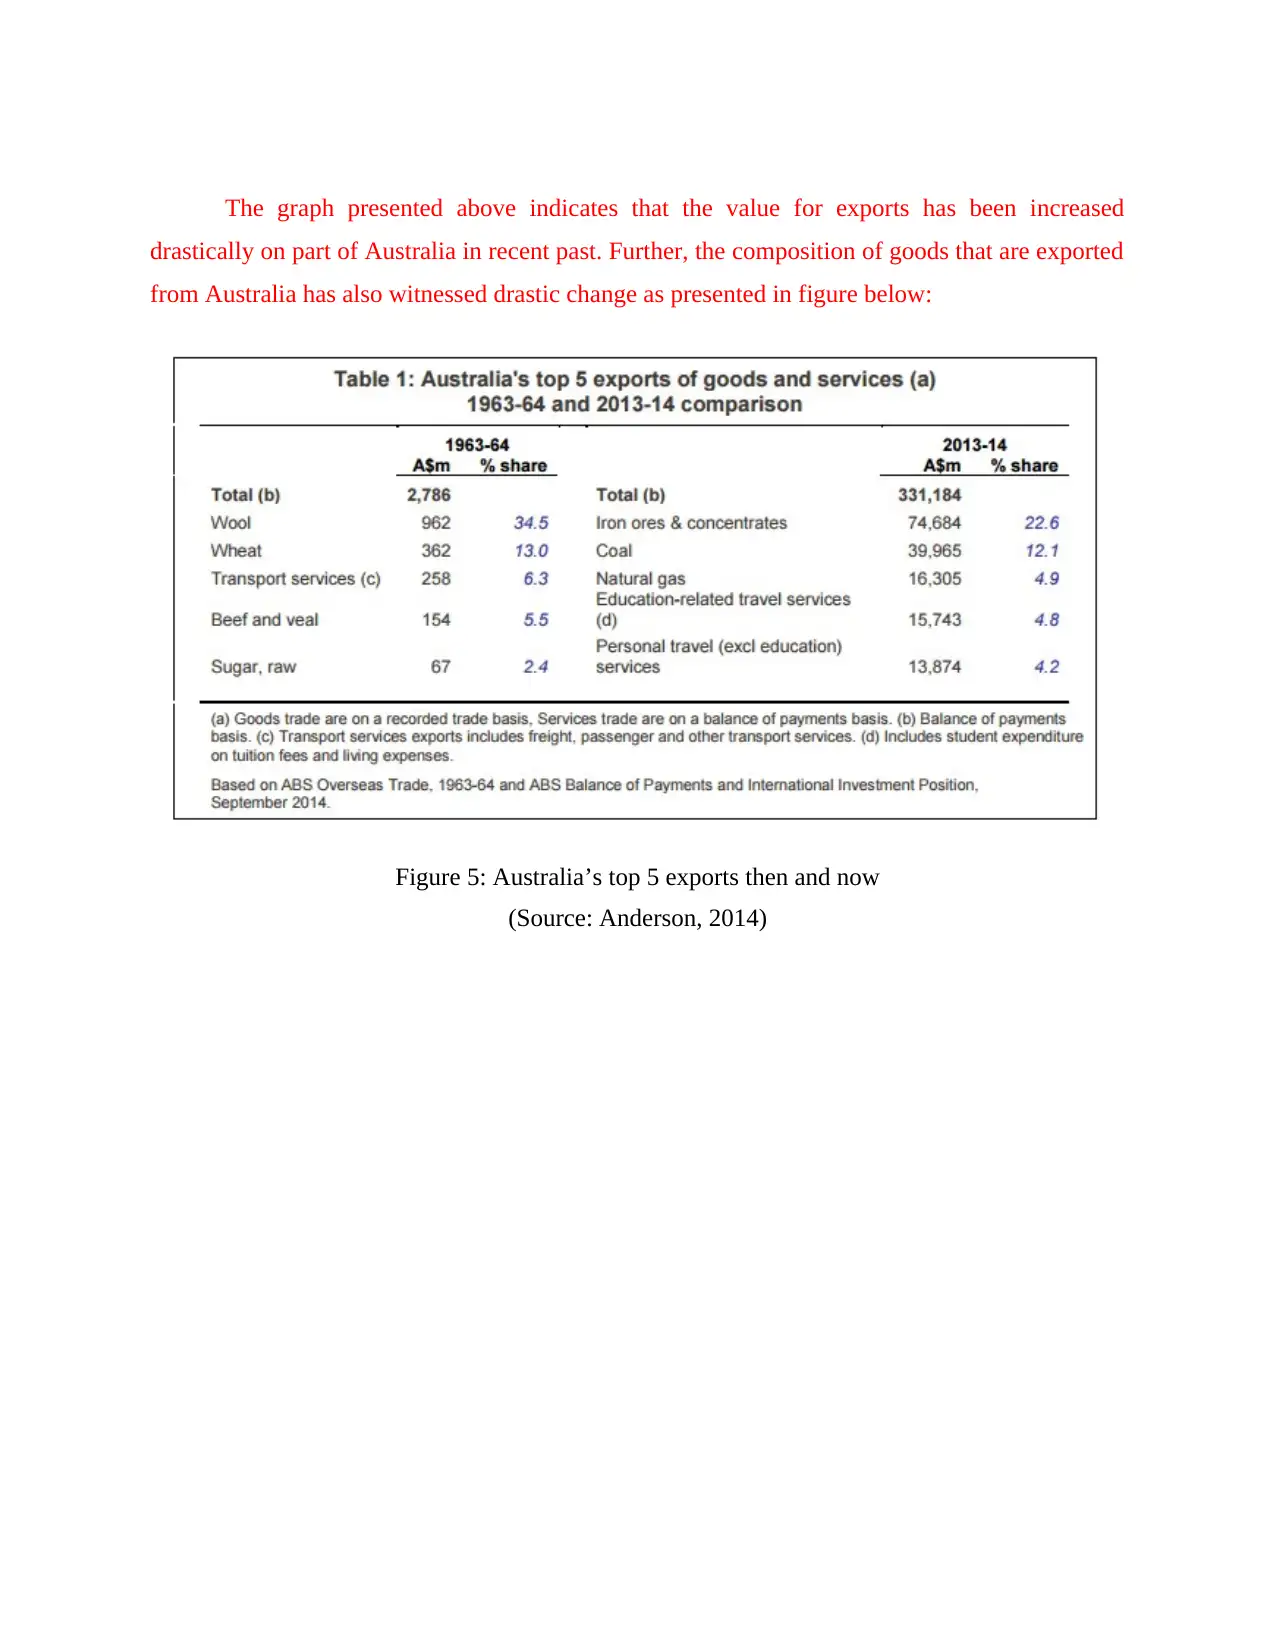
The graph presented above indicates that the value for exports has been increased
drastically on part of Australia in recent past. Further, the composition of goods that are exported
from Australia has also witnessed drastic change as presented in figure below:
Figure 5: Australia’s top 5 exports then and now
(Source: Anderson, 2014)
drastically on part of Australia in recent past. Further, the composition of goods that are exported
from Australia has also witnessed drastic change as presented in figure below:
Figure 5: Australia’s top 5 exports then and now
(Source: Anderson, 2014)
Paraphrase This Document
Need a fresh take? Get an instant paraphrase of this document with our AI Paraphraser
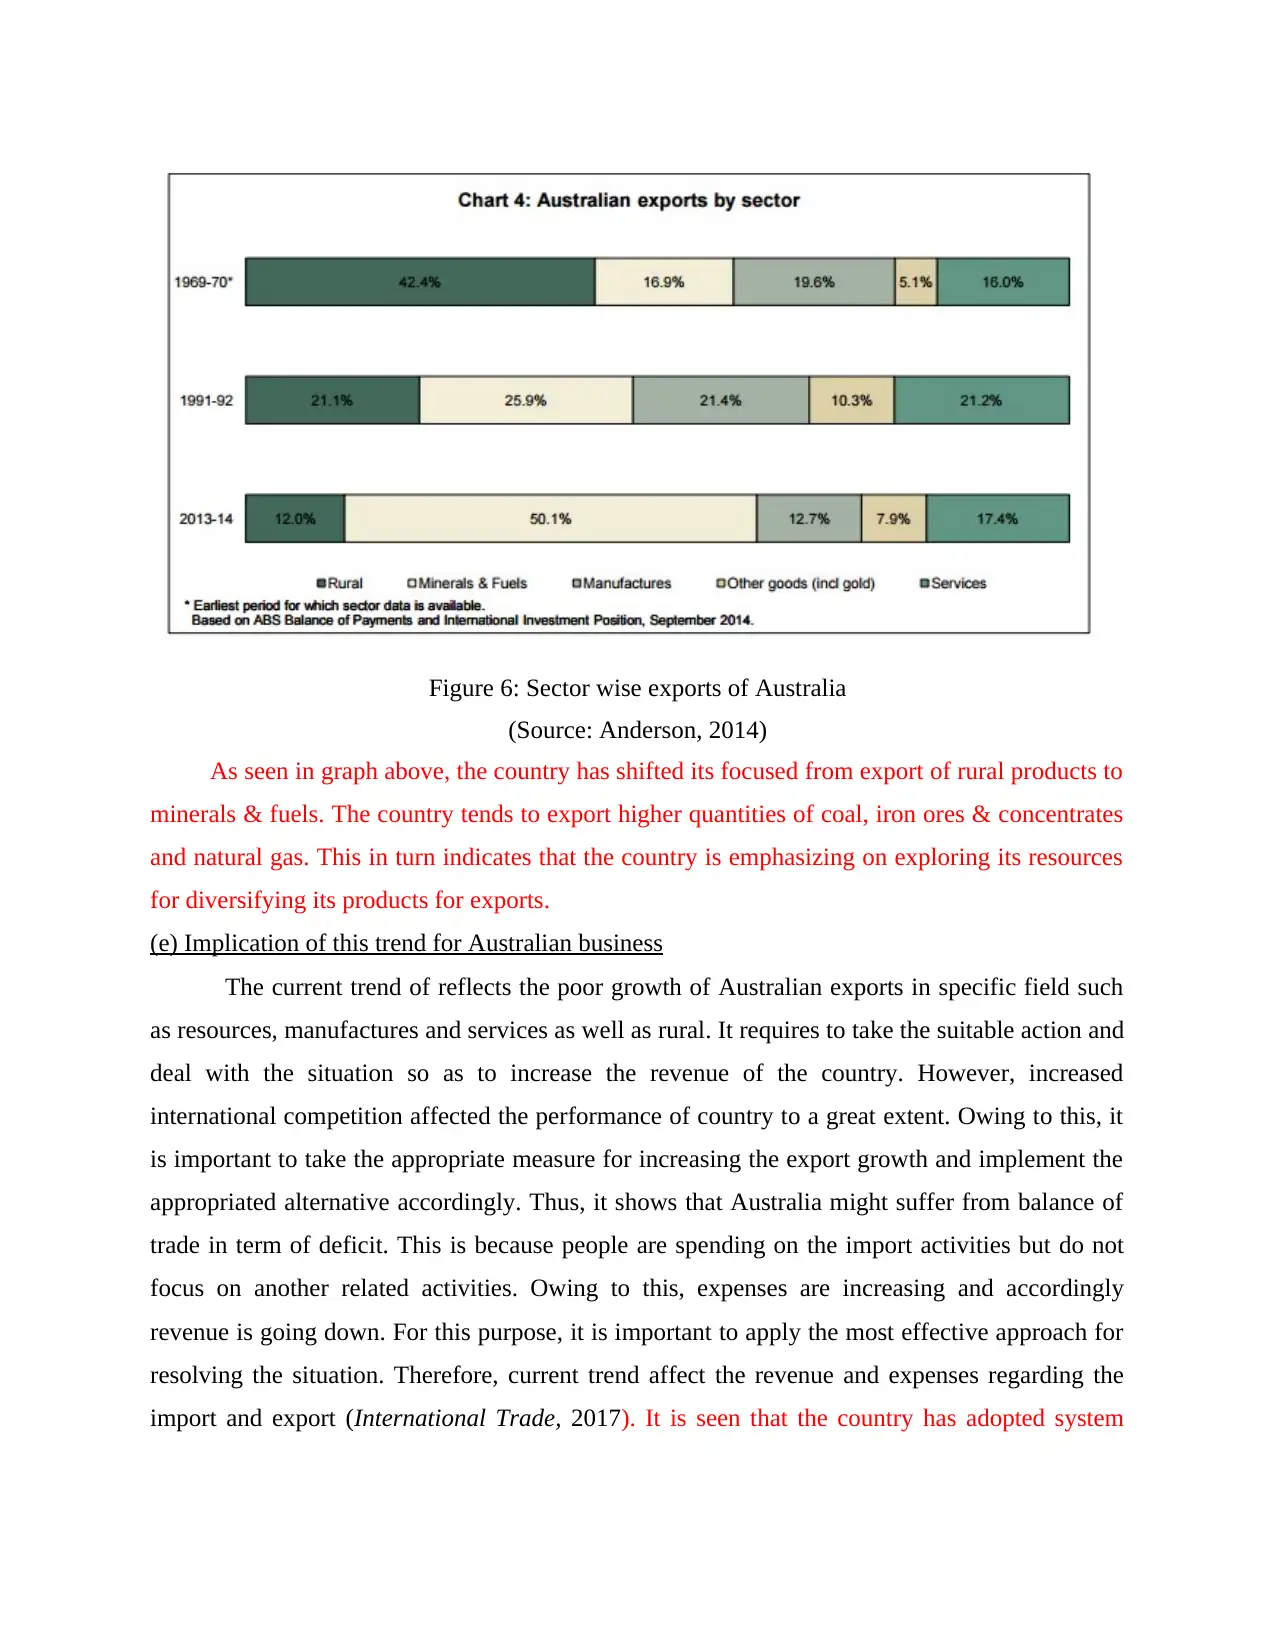
Figure 6: Sector wise exports of Australia
(Source: Anderson, 2014)
As seen in graph above, the country has shifted its focused from export of rural products to
minerals & fuels. The country tends to export higher quantities of coal, iron ores & concentrates
and natural gas. This in turn indicates that the country is emphasizing on exploring its resources
for diversifying its products for exports.
(e) Implication of this trend for Australian business
The current trend of reflects the poor growth of Australian exports in specific field such
as resources, manufactures and services as well as rural. It requires to take the suitable action and
deal with the situation so as to increase the revenue of the country. However, increased
international competition affected the performance of country to a great extent. Owing to this, it
is important to take the appropriate measure for increasing the export growth and implement the
appropriated alternative accordingly. Thus, it shows that Australia might suffer from balance of
trade in term of deficit. This is because people are spending on the import activities but do not
focus on another related activities. Owing to this, expenses are increasing and accordingly
revenue is going down. For this purpose, it is important to apply the most effective approach for
resolving the situation. Therefore, current trend affect the revenue and expenses regarding the
import and export (International Trade, 2017). It is seen that the country has adopted system

which is highly focused on improving values of exports. Further, the composition of products
that are preferred for exports have also witnessed a drastic change. It can be therefore said that
the country can avail benefit of high increase in proportion of exports as compare to that of
imports.
that are preferred for exports have also witnessed a drastic change. It can be therefore said that
the country can avail benefit of high increase in proportion of exports as compare to that of
imports.
⊘ This is a preview!⊘
Do you want full access?
Subscribe today to unlock all pages.
Trusted by 1+ million students worldwide
1 out of 13
Related Documents


Your All-in-One AI-Powered Toolkit for Academic Success.
+13062052269
info@desklib.com
Available 24*7 on WhatsApp / Email
![[object Object]](/_next/static/media/star-bottom.7253800d.svg)
Unlock your academic potential
Copyright © 2020–2026 A2Z Services. All Rights Reserved. Developed and managed by ZUCOL.