Project Management Report: Analysis of Automation Futures Case Study
VerifiedAdded on 2023/01/12
|26
|5361
|86
Report
AI Summary
This report provides a comprehensive analysis of project management, using the Automation Futures case study to illustrate key concepts. It begins with an executive summary and introduction, followed by an examination of project parameters, including the iron triangle and risk assessment. The report then delves into planning and cost management, including network diagrams, Gantt charts, and net profit calculations. It explores managing progress and spending, followed by earned value analysis and acceleration techniques. The report also includes a reflective essay, offering personal insights into the project management process. The conclusion summarizes the findings, and a list of references completes the report. The analysis covers critical aspects of project management, providing a practical understanding of the subject.
FUNDAMENTAL
OF
PROJECT
MANAGEMENT
OF
PROJECT
MANAGEMENT
Paraphrase This Document
Need a fresh take? Get an instant paraphrase of this document with our AI Paraphraser
EXECUTIVE SUMMARY
The report provides a comprehensive project management analysis that addresses all
important elements of project management and helps define the value of project management
activities within an enterprise. This report is drawn up on the basis of the Automation Futures
case study. At the other side, there is a reflection in this report which explains a description of
experience and issues in this aspect.
Contents
EXECUTIVE SUMMARY.............................................................................................................2
INTRODUCTION...........................................................................................................................4
TASK 1............................................................................................................................................4
1. Parameters and Risk of the company...........................................................................................4
(a) Iron Triangle Parameters.......................................................................................................4
2. Planning and Costs...................................................................................................................10
(a) Network Diagram...............................................................................................................10
(b) Gantt Chart..........................................................................................................................11
(c) Net profit of the contract...................................................................................................12
3. Managing progress and spending:..........................................................................................13
(a)...............................................................................................................................................13
(b)..............................................................................................................................................15
4. Earned Value Analysis and Acceleration:...............................................................................19
(a.)..............................................................................................................................................19
(b)..............................................................................................................................................22
(c)...............................................................................................................................................22
PART B.........................................................................................................................................22
Reflective Essay........................................................................................................................22
CONCLUSION................................................................................................................................22
REFERENCES..............................................................................................................................24
⊘ This is a preview!⊘
Do you want full access?
Subscribe today to unlock all pages.
Trusted by 1+ million students worldwide
INTRODUCTION
Project management is a practice of coordinating different types of tasks to meet the
corporate organization’s goals (Samset and Volden, 2016). It is a method to enable, evaluate and
track the actions of a given mission. The project report is based on an organization which is
Automation Future; company began a new initiative in order to grasp the principle of project
management. This report deals with all the roles and tasks performed during the project
management and how administrators address the challenges and risk evaluation methods of the
project manager methodology for decision-making.
TASK 1
1. Parameters and Risk of the company
(a) Iron Triangle Parameters
Automation Futures use their business pattern iron triangles and project management
triangles. The success of an organization relies largely on the way it utilizes its money in the
management of programs (Padalkar and Gopinath, 2016). For announcements of digital
technology ventures, project size, project efficiency and length are several important constraints
for the triangle of ventures. Methods and strategies must be utilized to successfully implement all
theses in order to accomplish the project objective. By developing the budget for this project, the
quality of this project can be preserved. The constraints of this project TTF PLC are as follows:
Projects implemented at fixed and variable costs on a realistic basis. AF PLC will then carry out
testing on the basis of customer preference. It is carried out in small sections to be shipped on
time and must be tracked on schedule.
Fixed time- When customers expect a product to be completed within a particular date,
tasks will be performed in an absolute sequence of business interest. Set period to pass
the job with an end date is reached (Muriana and Vizzini, 2017).
Fixed Scope- When work is to be carried out as stated, time and costs are set flexibly for
production. This work standard is maintained.
Paraphrase This Document
Need a fresh take? Get an instant paraphrase of this document with our AI Paraphraser
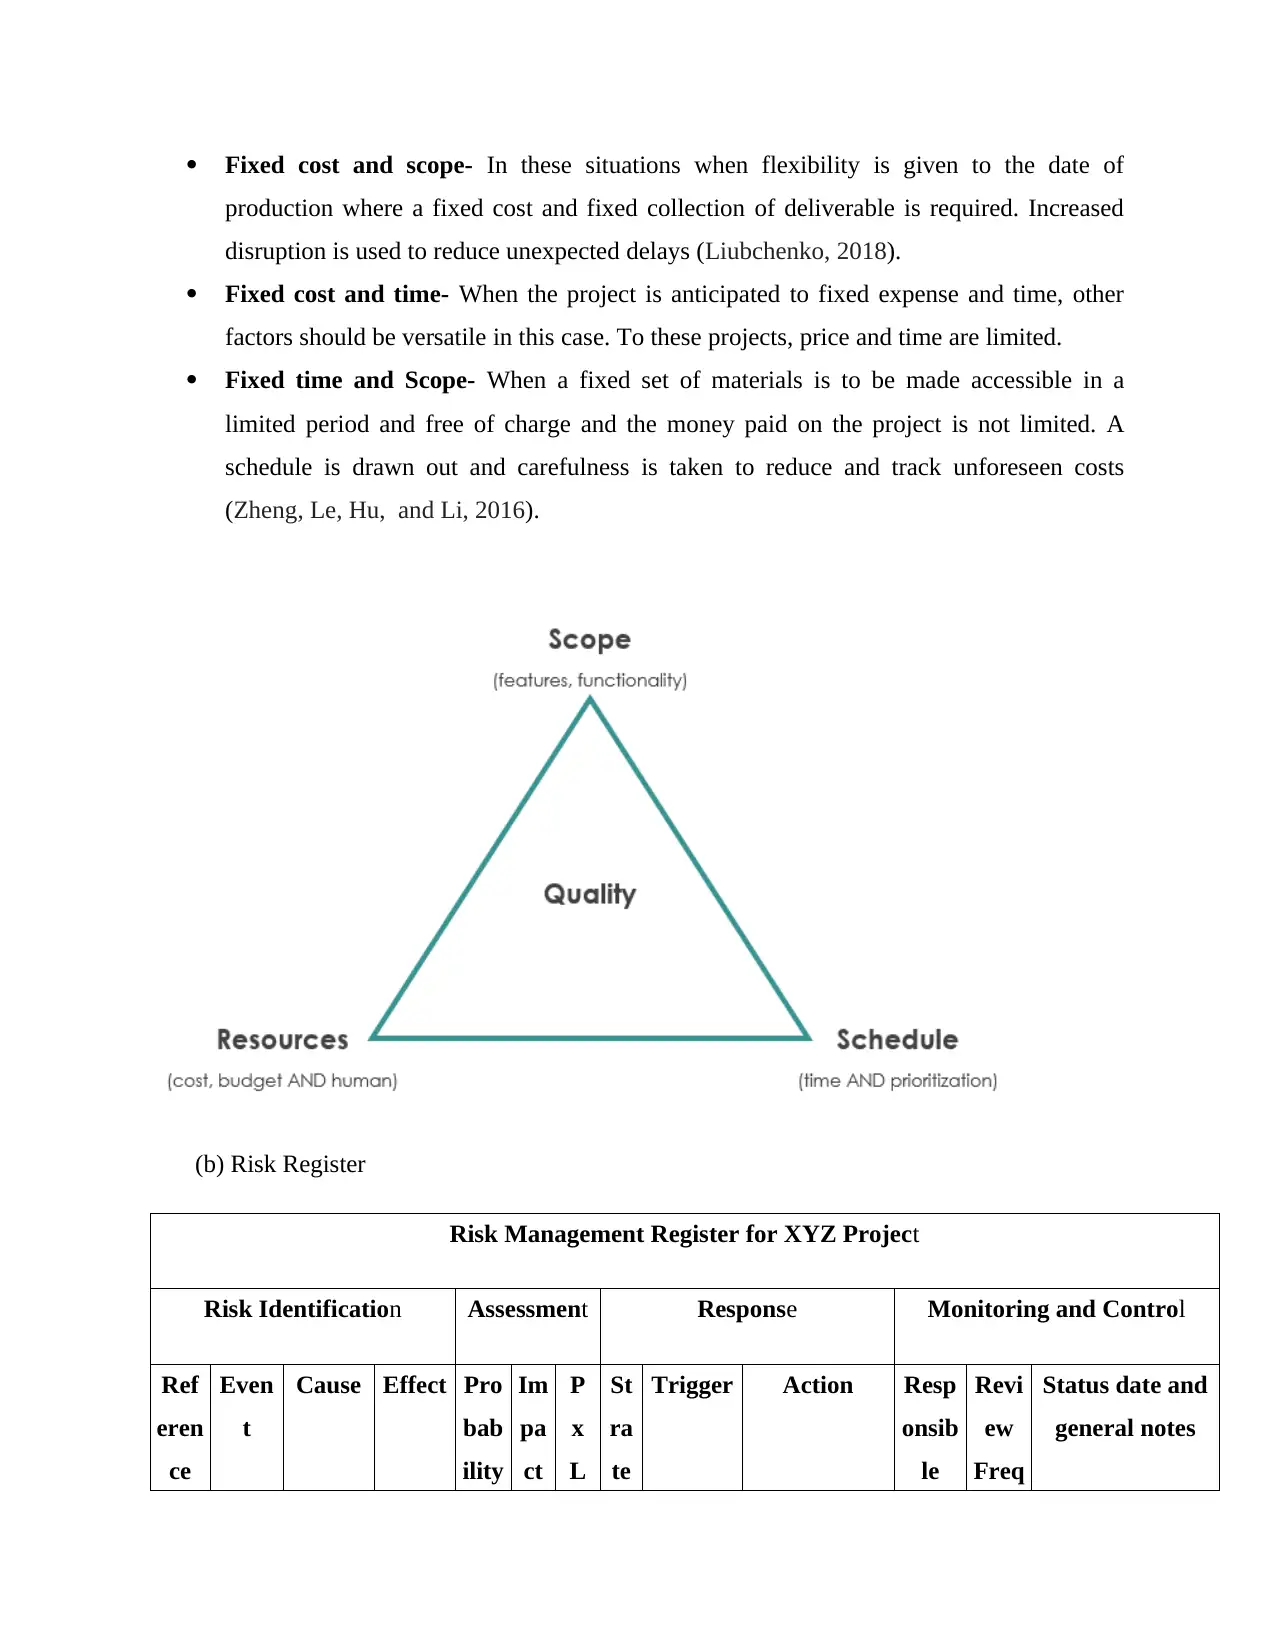
Fixed cost and scope- In these situations when flexibility is given to the date of
production where a fixed cost and fixed collection of deliverable is required. Increased
disruption is used to reduce unexpected delays (Lіubchenko, 2018).
Fixed cost and time- When the project is anticipated to fixed expense and time, other
factors should be versatile in this case. To these projects, price and time are limited.
Fixed time and Scope- When a fixed set of materials is to be made accessible in a
limited period and free of charge and the money paid on the project is not limited. A
schedule is drawn out and carefulness is taken to reduce and track unforeseen costs
(Zheng, Le, Hu, and Li, 2016).
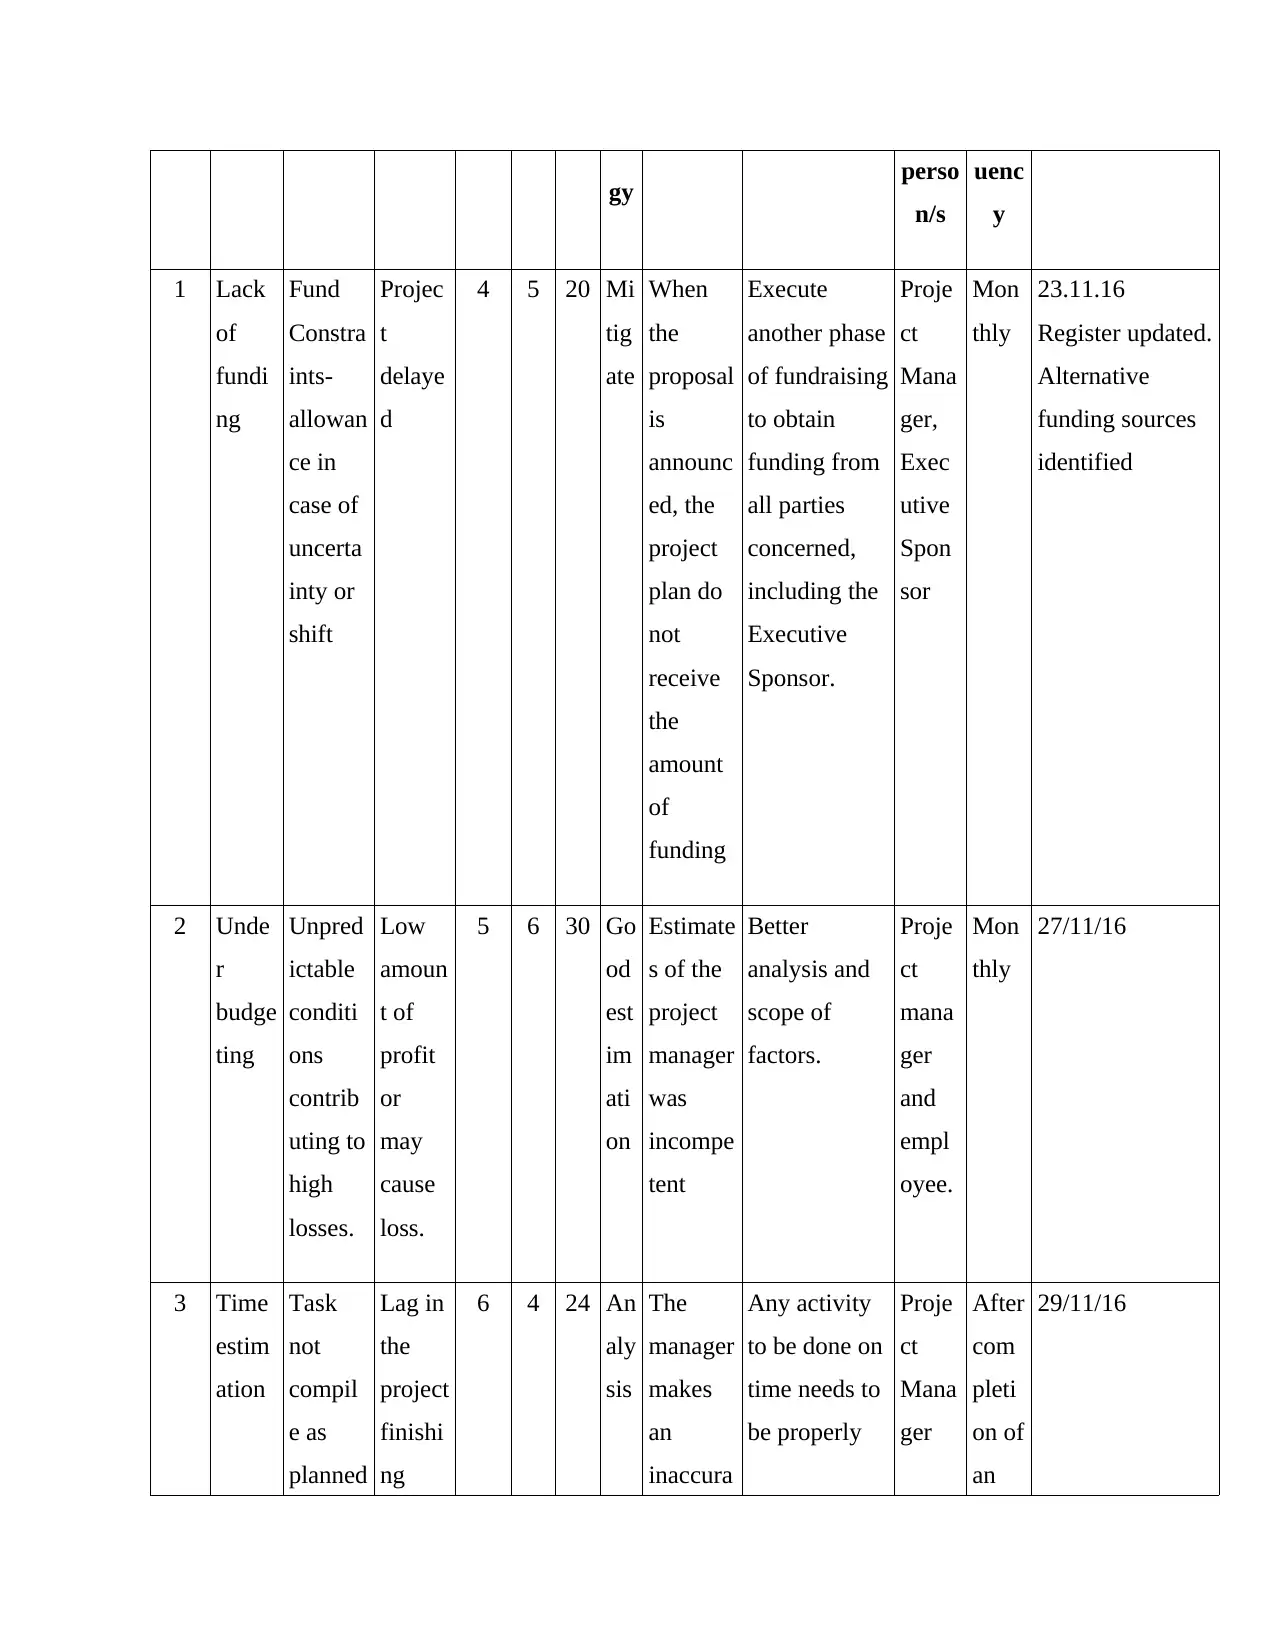
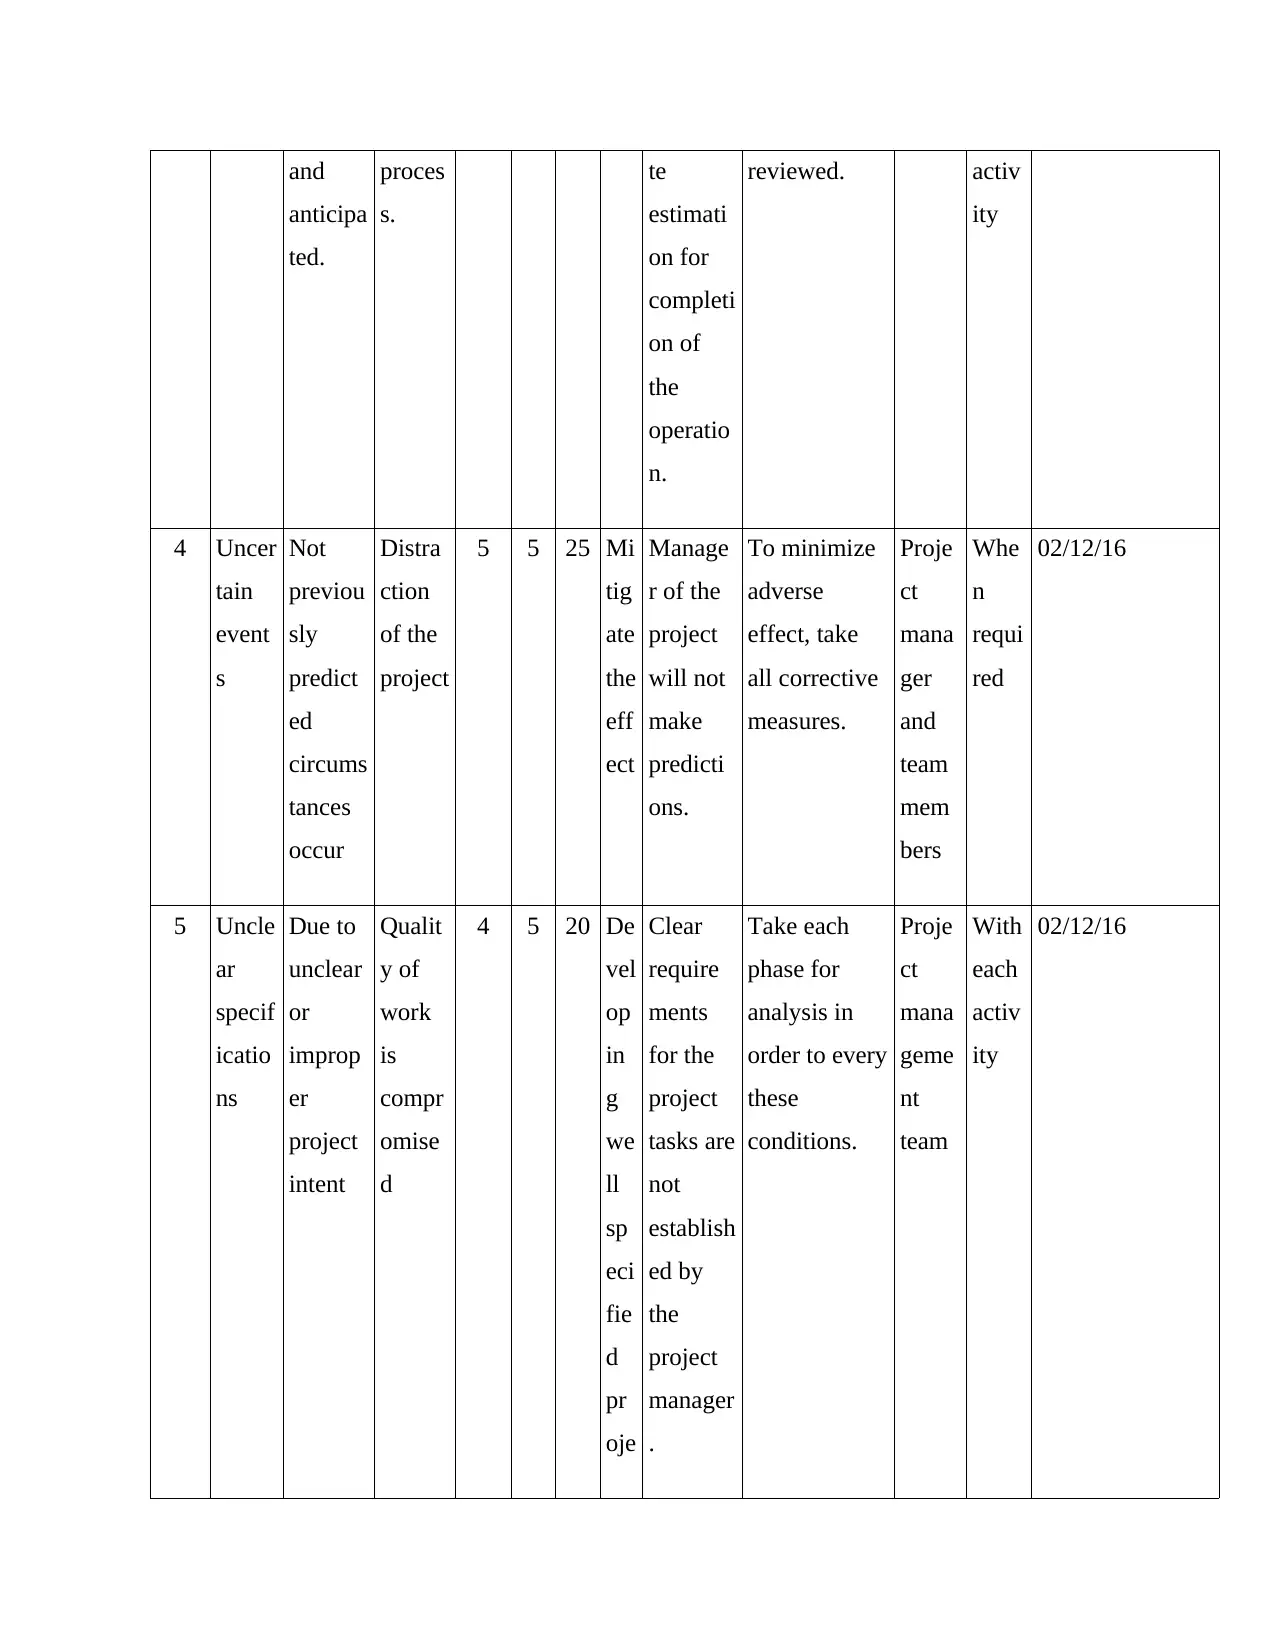
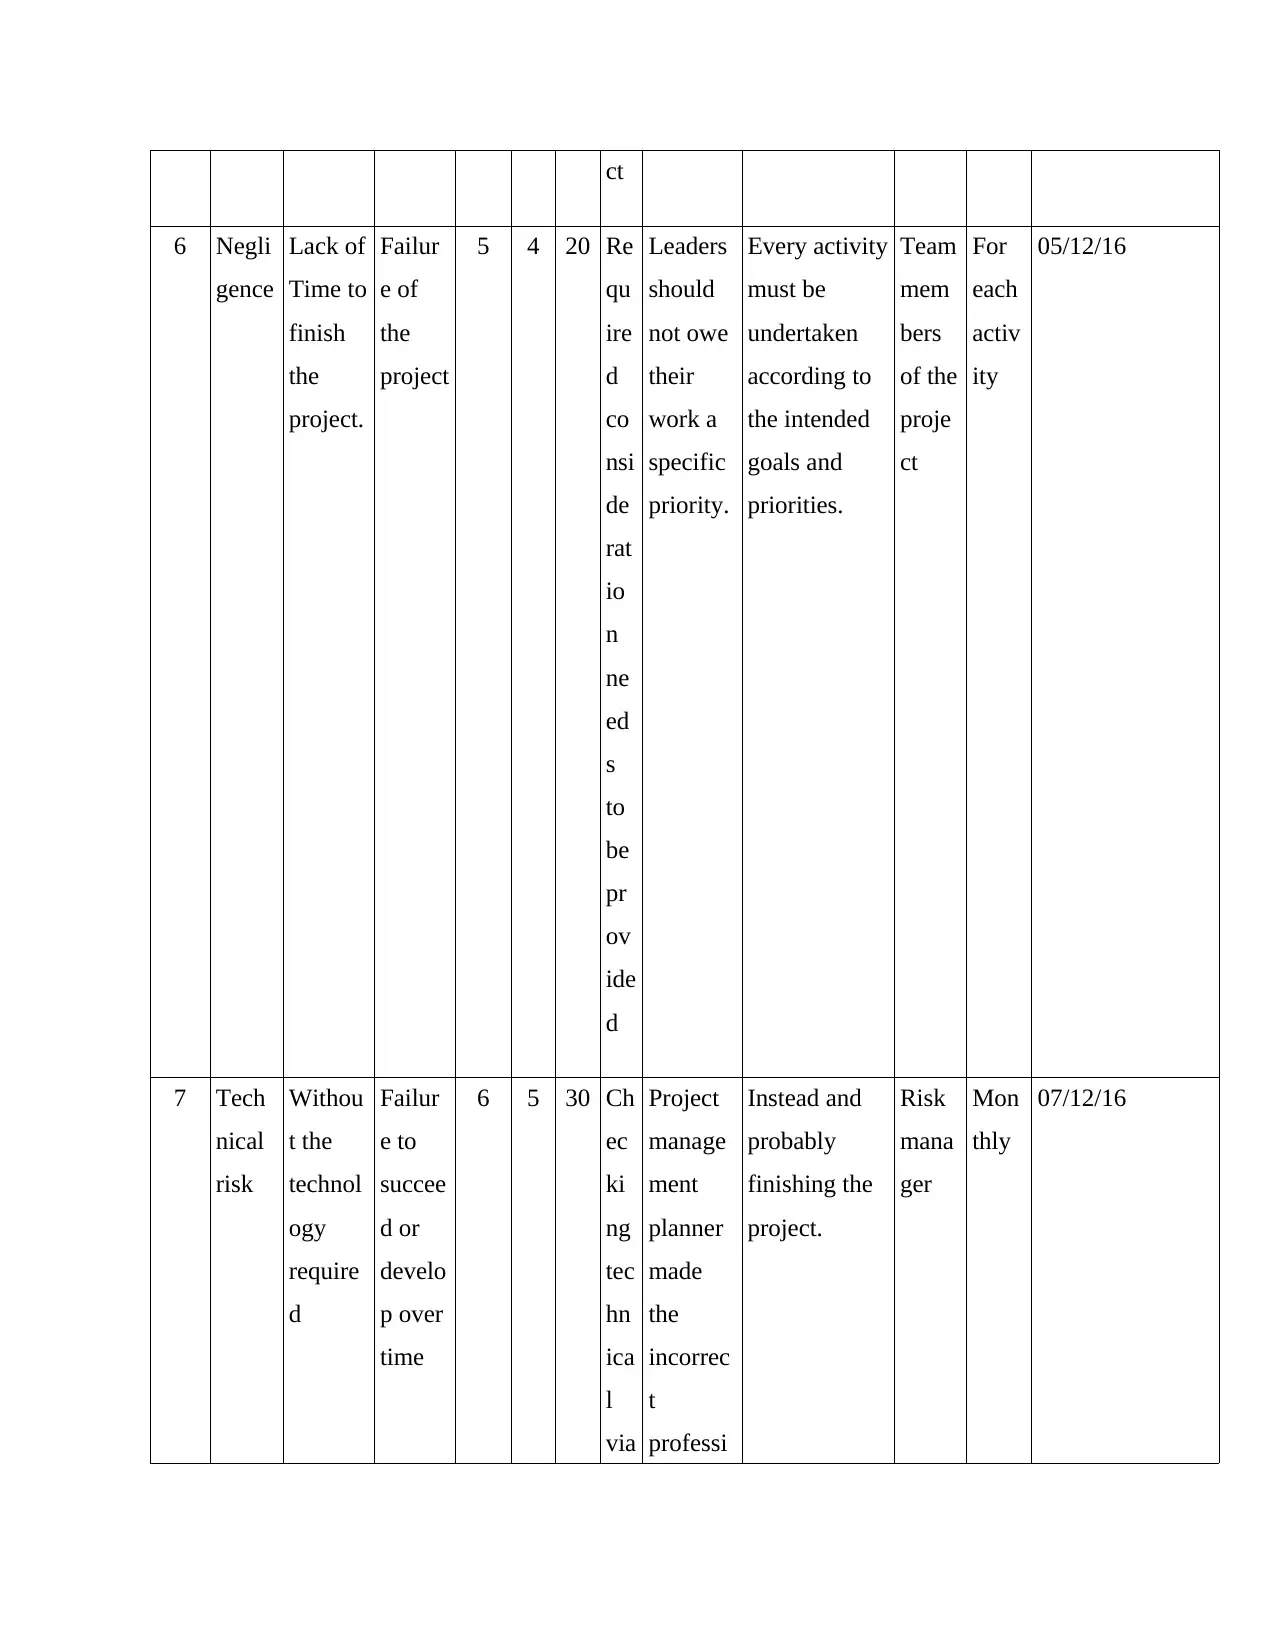
(b) Risk Register
Risk Management Register for XYZ Project
Risk Identification Assessment Response Monitoring and Control
Ref
eren
ce
Even
t
Cause Effect Pro
bab
ility
Im
pa
ct
P
x
L
St
ra
te
Trigger Action Resp
onsib
le
Revi
ew
Freq
Status date and
general notes
production where a fixed cost and fixed collection of deliverable is required. Increased
disruption is used to reduce unexpected delays (Lіubchenko, 2018).
Fixed cost and time- When the project is anticipated to fixed expense and time, other
factors should be versatile in this case. To these projects, price and time are limited.
Fixed time and Scope- When a fixed set of materials is to be made accessible in a
limited period and free of charge and the money paid on the project is not limited. A
schedule is drawn out and carefulness is taken to reduce and track unforeseen costs
(Zheng, Le, Hu, and Li, 2016).
(b) Risk Register
Risk Management Register for XYZ Project
Risk Identification Assessment Response Monitoring and Control
Ref
eren
ce
Even
t
Cause Effect Pro
bab
ility
Im
pa
ct
P
x
L
St
ra
te
Trigger Action Resp
onsib
le
Revi
ew
Freq
Status date and
general notes
gy perso
n/s
uenc
y
1 Lack
of
fundi
ng
Fund
Constra
ints-
allowan
ce in
case of
uncerta
inty or
shift
Projec
t
delaye
d
4 5 20 Mi
tig
ate
When
the
proposal
is
announc
ed, the
project
plan do
not
receive
the
amount
of
funding
Execute
another phase
of fundraising
to obtain
funding from
all parties
concerned,
including the
Executive
Sponsor.
Proje
ct
Mana
ger,
Exec
utive
Spon
sor
Mon
thly
23.11.16
Register updated.
Alternative
funding sources
identified
2 Unde
r
budge
ting
Unpred
ictable
conditi
ons
contrib
uting to
high
losses.
Low
amoun
t of
profit
or
may
cause
loss.
5 6 30 Go
od
est
im
ati
on
Estimate
s of the
project
manager
was
incompe
tent
Better
analysis and
scope of
factors.
Proje
ct
mana
ger
and
empl
oyee.
Mon
thly
27/11/16
3 Time
estim
ation
Task
not
compil
e as
planned
Lag in
the
project
finishi
ng
6 4 24 An
aly
sis
The
manager
makes
an
inaccura
Any activity
to be done on
time needs to
be properly
Proje
ct
Mana
ger
After
com
pleti
on of
an
29/11/16
⊘ This is a preview!⊘
Do you want full access?
Subscribe today to unlock all pages.
Trusted by 1+ million students worldwide
and
anticipa
ted.
proces
s.
te
estimati
on for
completi
on of
the
operatio
n.
reviewed. activ
ity
4 Uncer
tain
event
s
Not
previou
sly
predict
ed
circums
tances
occur
Distra
ction
of the
project
5 5 25 Mi
tig
ate
the
eff
ect
Manage
r of the
project
will not
make
predicti
ons.
To minimize
adverse
effect, take
all corrective
measures.
Proje
ct
mana
ger
and
team
mem
bers
Whe
n
requi
red
02/12/16
5 Uncle
ar
specif
icatio
ns
Due to
unclear
or
improp
er
project
intent
Qualit
y of
work
is
compr
omise
d
4 5 20 De
vel
op
in
g
we
ll
sp
eci
fie
d
pr
oje
Clear
require
ments
for the
project
tasks are
not
establish
ed by
the
project
manager
.
Take each
phase for
analysis in
order to every
these
conditions.
Proje
ct
mana
geme
nt
team
With
each
activ
ity
02/12/16
Paraphrase This Document
Need a fresh take? Get an instant paraphrase of this document with our AI Paraphraser
ct
6 Negli
gence
Lack of
Time to
finish
the
project.
Failur
e of
the
project
5 4 20 Re
qu
ire
d
co
nsi
de
rat
io
n
ne
ed
s
to
be
pr
ov
ide
d
Leaders
should
not owe
their
work a
specific
priority.
Every activity
must be
undertaken
according to
the intended
goals and
priorities.
Team
mem
bers
of the
proje
ct
For
each
activ
ity
05/12/16
7 Tech
nical
risk
Withou
t the
technol
ogy
require
d
Failur
e to
succee
d or
develo
p over
time
6 5 30 Ch
ec
ki
ng
tec
hn
ica
l
via
Project
manage
ment
planner
made
the
incorrec
t
professi
Instead and
probably
finishing the
project.
Risk
mana
ger
Mon
thly
07/12/16
bil
ity
onal risk
assessm
ent.
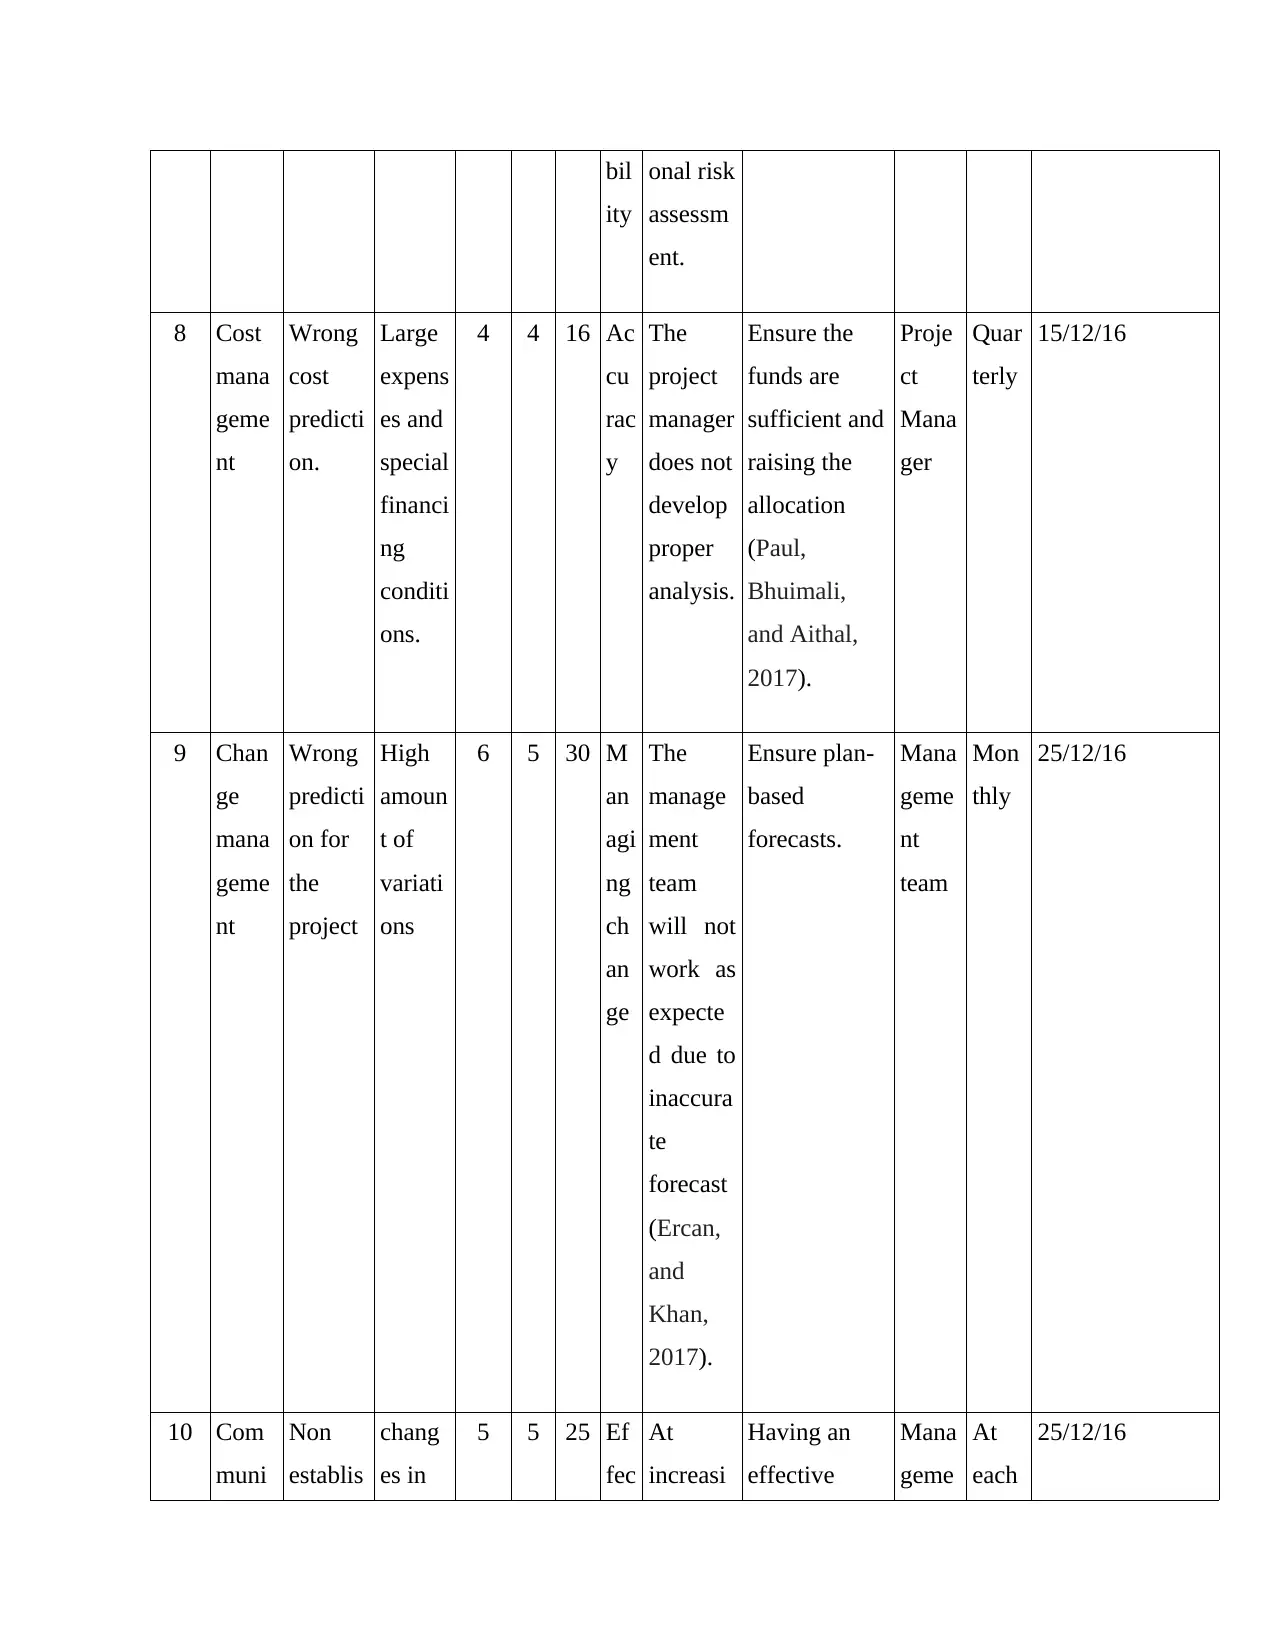
8 Cost
mana
geme
nt
Wrong
cost
predicti
on.
Large
expens
es and
special
financi
ng
conditi
ons.
4 4 16 Ac
cu
rac
y
The
project
manager
does not
develop
proper
analysis.
Ensure the
funds are
sufficient and
raising the
allocation
(Paul,
Bhuimali,
and Aithal,
2017).
Proje
ct
Mana
ger
Quar
terly
15/12/16
9 Chan
ge
mana
geme
nt
Wrong
predicti
on for
the
project
High
amoun
t of
variati
ons
6 5 30 M
an
agi
ng
ch
an
ge
The
manage
ment
team
will not
work as
expecte
d due to
inaccura
te
forecast
(Ercan,
and
Khan,
2017).
Ensure plan-
based
forecasts.
Mana
geme
nt
team
Mon
thly
25/12/16
10 Com
muni
Non
establis
chang
es in
5 5 25 Ef
fec
At
increasi
Having an
effective
Mana
geme
At
each
25/12/16
ity
onal risk
assessm
ent.
8 Cost
mana
geme
nt
Wrong
cost
predicti
on.
Large
expens
es and
special
financi
ng
conditi
ons.
4 4 16 Ac
cu
rac
y
The
project
manager
does not
develop
proper
analysis.
Ensure the
funds are
sufficient and
raising the
allocation
(Paul,
Bhuimali,
and Aithal,
2017).
Proje
ct
Mana
ger
Quar
terly
15/12/16
9 Chan
ge
mana
geme
nt
Wrong
predicti
on for
the
project
High
amoun
t of
variati
ons
6 5 30 M
an
agi
ng
ch
an
ge
The
manage
ment
team
will not
work as
expecte
d due to
inaccura
te
forecast
(Ercan,
and
Khan,
2017).
Ensure plan-
based
forecasts.
Mana
geme
nt
team
Mon
thly
25/12/16
10 Com
muni
Non
establis
chang
es in
5 5 25 Ef
fec
At
increasi
Having an
effective
Mana
geme
At
each
25/12/16
⊘ This is a preview!⊘
Do you want full access?
Subscribe today to unlock all pages.
Trusted by 1+ million students worldwide
cation hment
of
commu
nicatio
n
channel
curren
t and
requir
ed
output
.
tiv
e
co
m
m
un
ica
tio
n
ch
an
nel
ng point
of the
project,
manage
ment
does not
commun
icate
clearly.
networking
network
require all
necessary
measures.
nt
and
team
mem
bers
stage
of
the
proje
ct
2. Planning and Costs
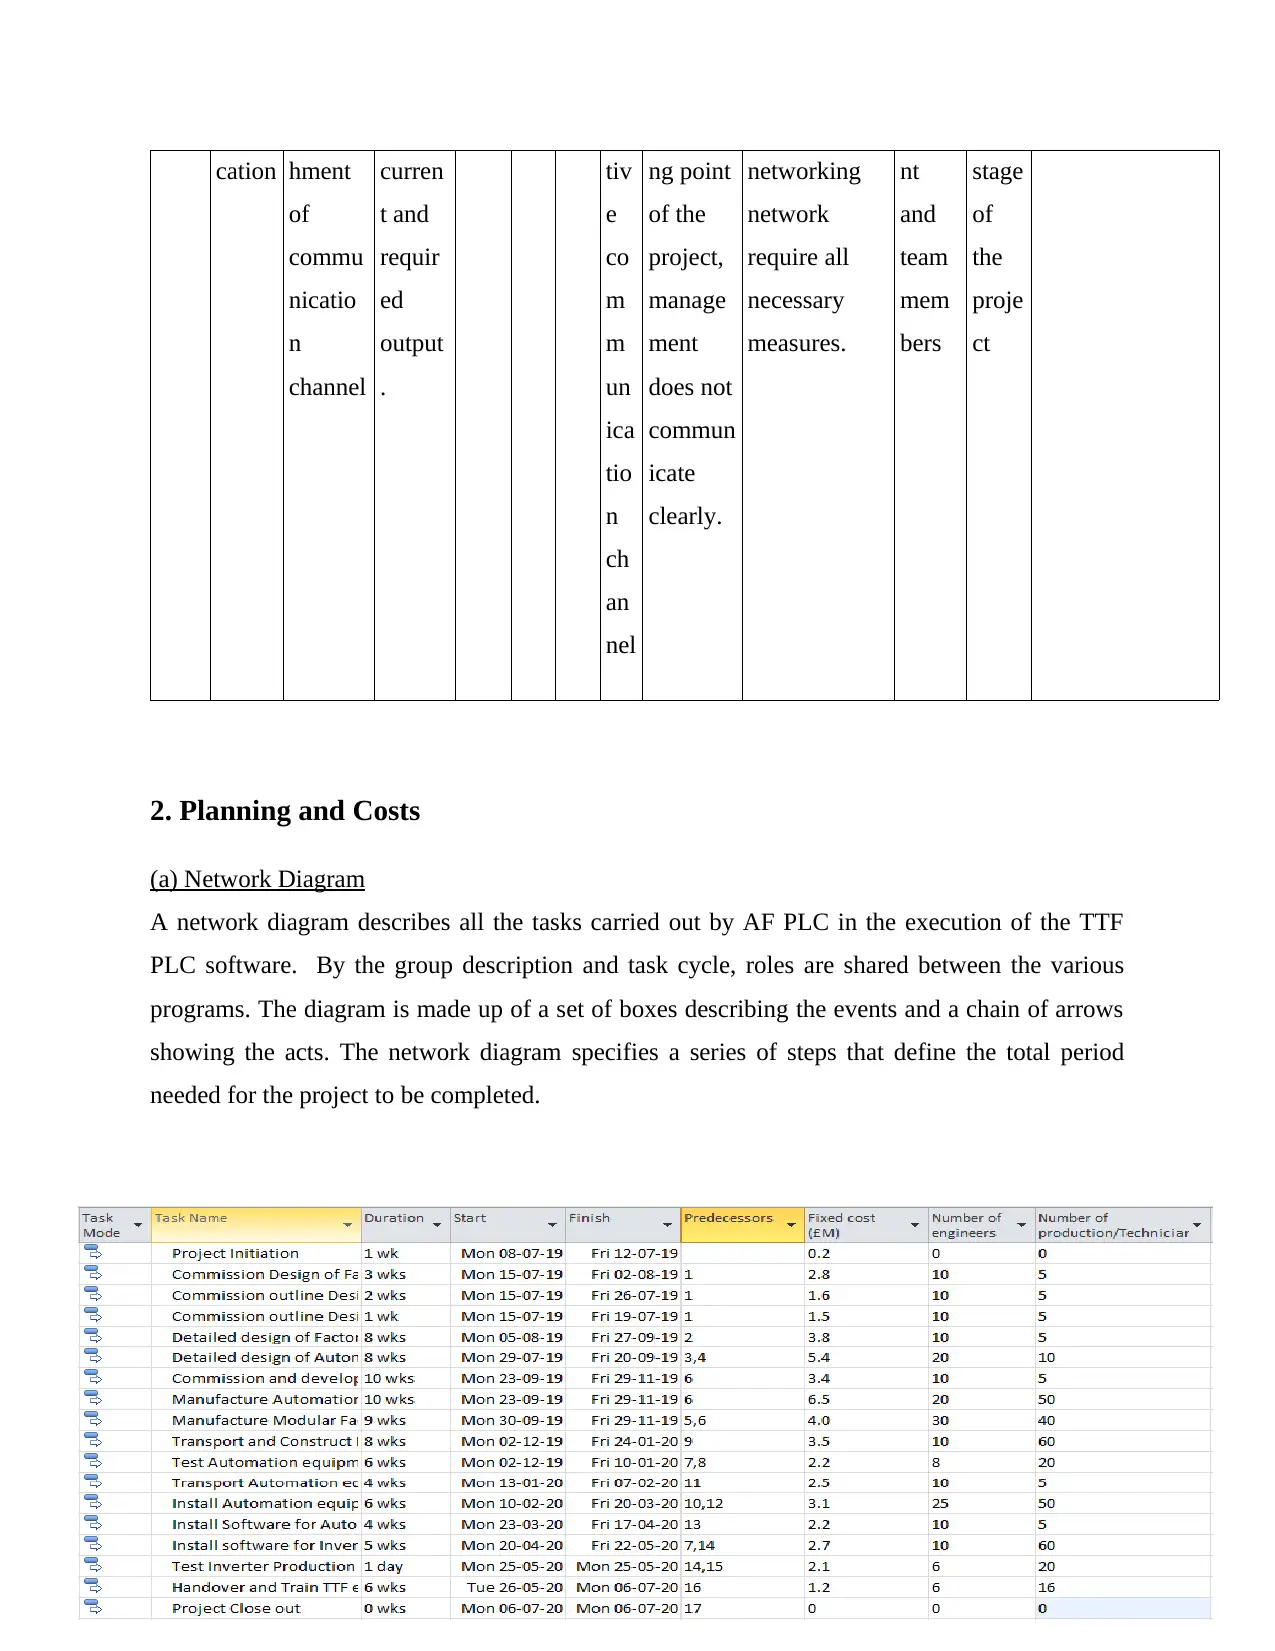
(a) Network Diagram
A network diagram describes all the tasks carried out by AF PLC in the execution of the TTF
PLC software. By the group description and task cycle, roles are shared between the various
programs. The diagram is made up of a set of boxes describing the events and a chain of arrows
showing the acts. The network diagram specifies a series of steps that define the total period
needed for the project to be completed.
of
commu
nicatio
n
channel
curren
t and
requir
ed
output
.
tiv
e
co
m
m
un
ica
tio
n
ch
an
nel
ng point
of the
project,
manage
ment
does not
commun
icate
clearly.
networking
network
require all
necessary
measures.
nt
and
team
mem
bers
stage
of
the
proje
ct
2. Planning and Costs
(a) Network Diagram
A network diagram describes all the tasks carried out by AF PLC in the execution of the TTF
PLC software. By the group description and task cycle, roles are shared between the various
programs. The diagram is made up of a set of boxes describing the events and a chain of arrows
showing the acts. The network diagram specifies a series of steps that define the total period
needed for the project to be completed.
Paraphrase This Document
Need a fresh take? Get an instant paraphrase of this document with our AI Paraphraser
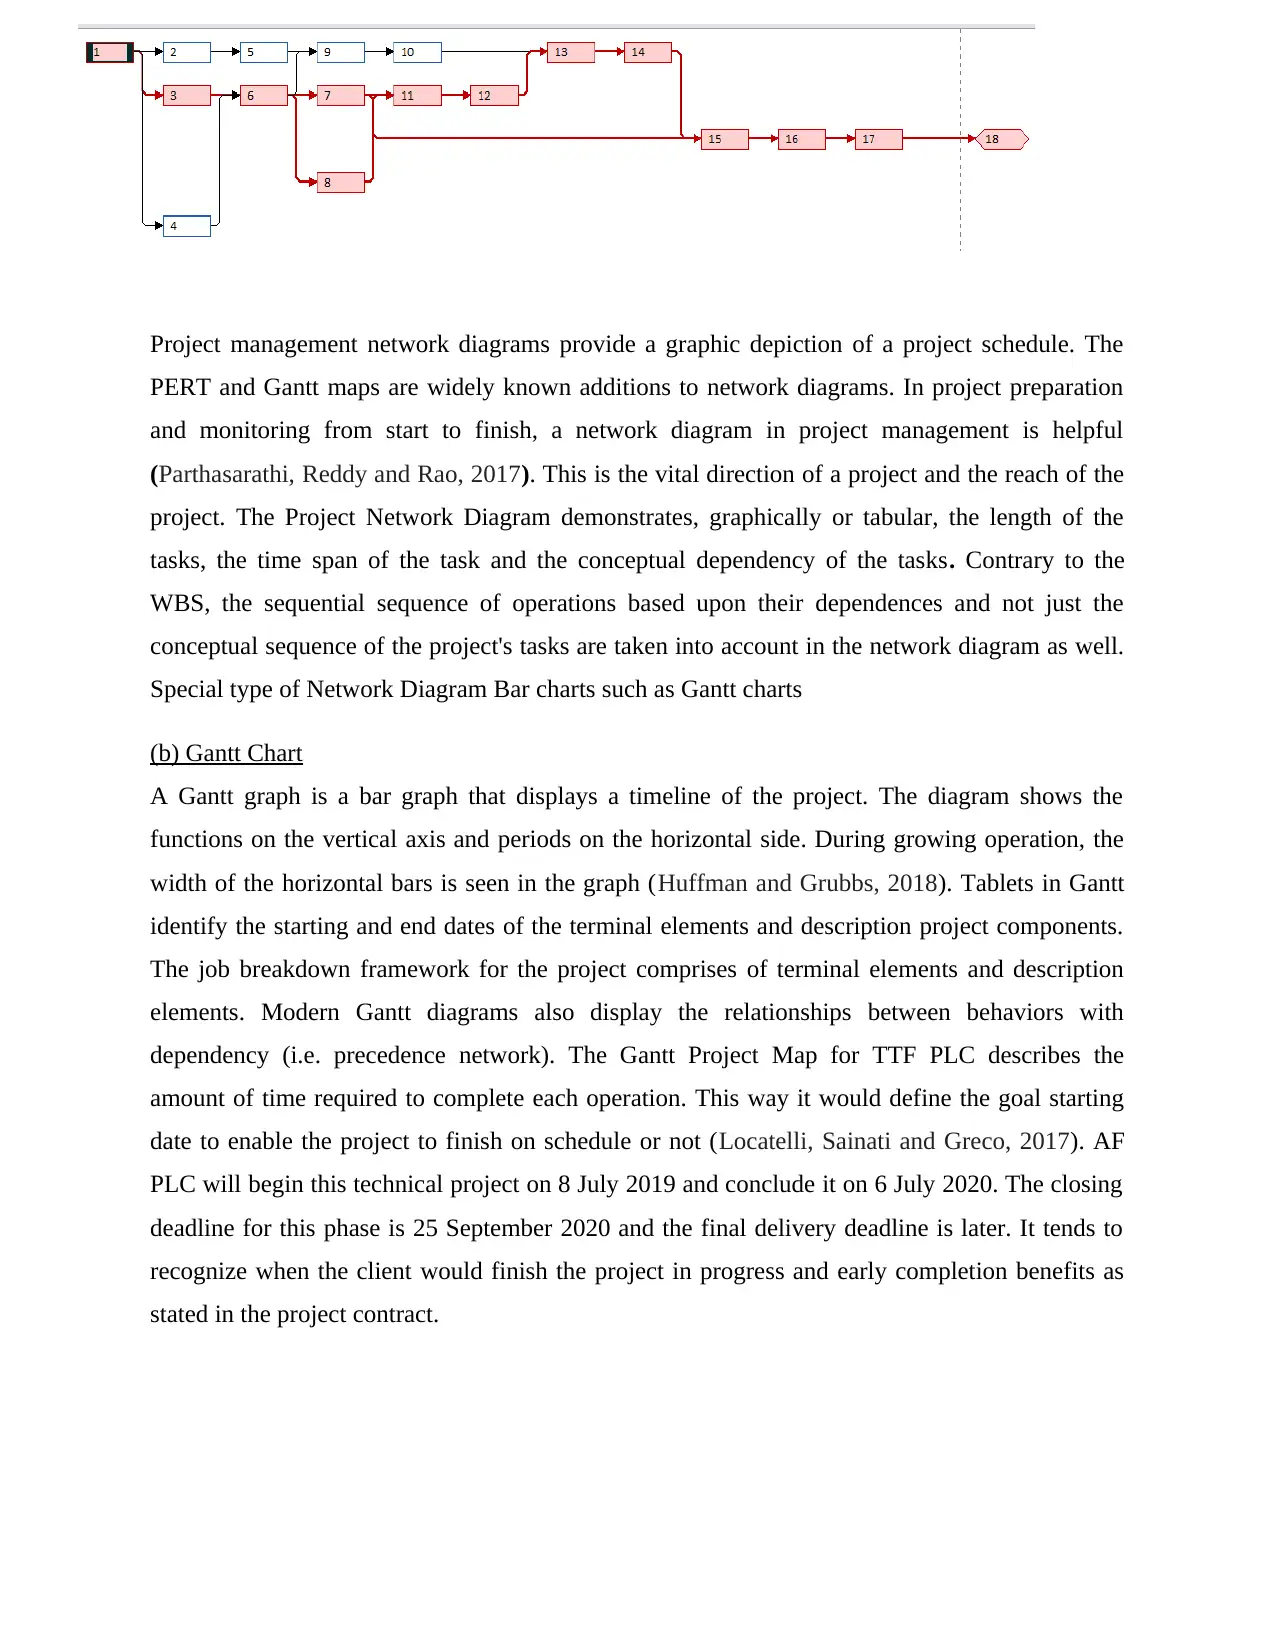
Project management network diagrams provide a graphic depiction of a project schedule. The
PERT and Gantt maps are widely known additions to network diagrams. In project preparation
and monitoring from start to finish, a network diagram in project management is helpful
(Parthasarathi, Reddy and Rao, 2017). This is the vital direction of a project and the reach of the
project. The Project Network Diagram demonstrates, graphically or tabular, the length of the
tasks, the time span of the task and the conceptual dependency of the tasks. Contrary to the
WBS, the sequential sequence of operations based upon their dependences and not just the
conceptual sequence of the project's tasks are taken into account in the network diagram as well.
Special type of Network Diagram Bar charts such as Gantt charts
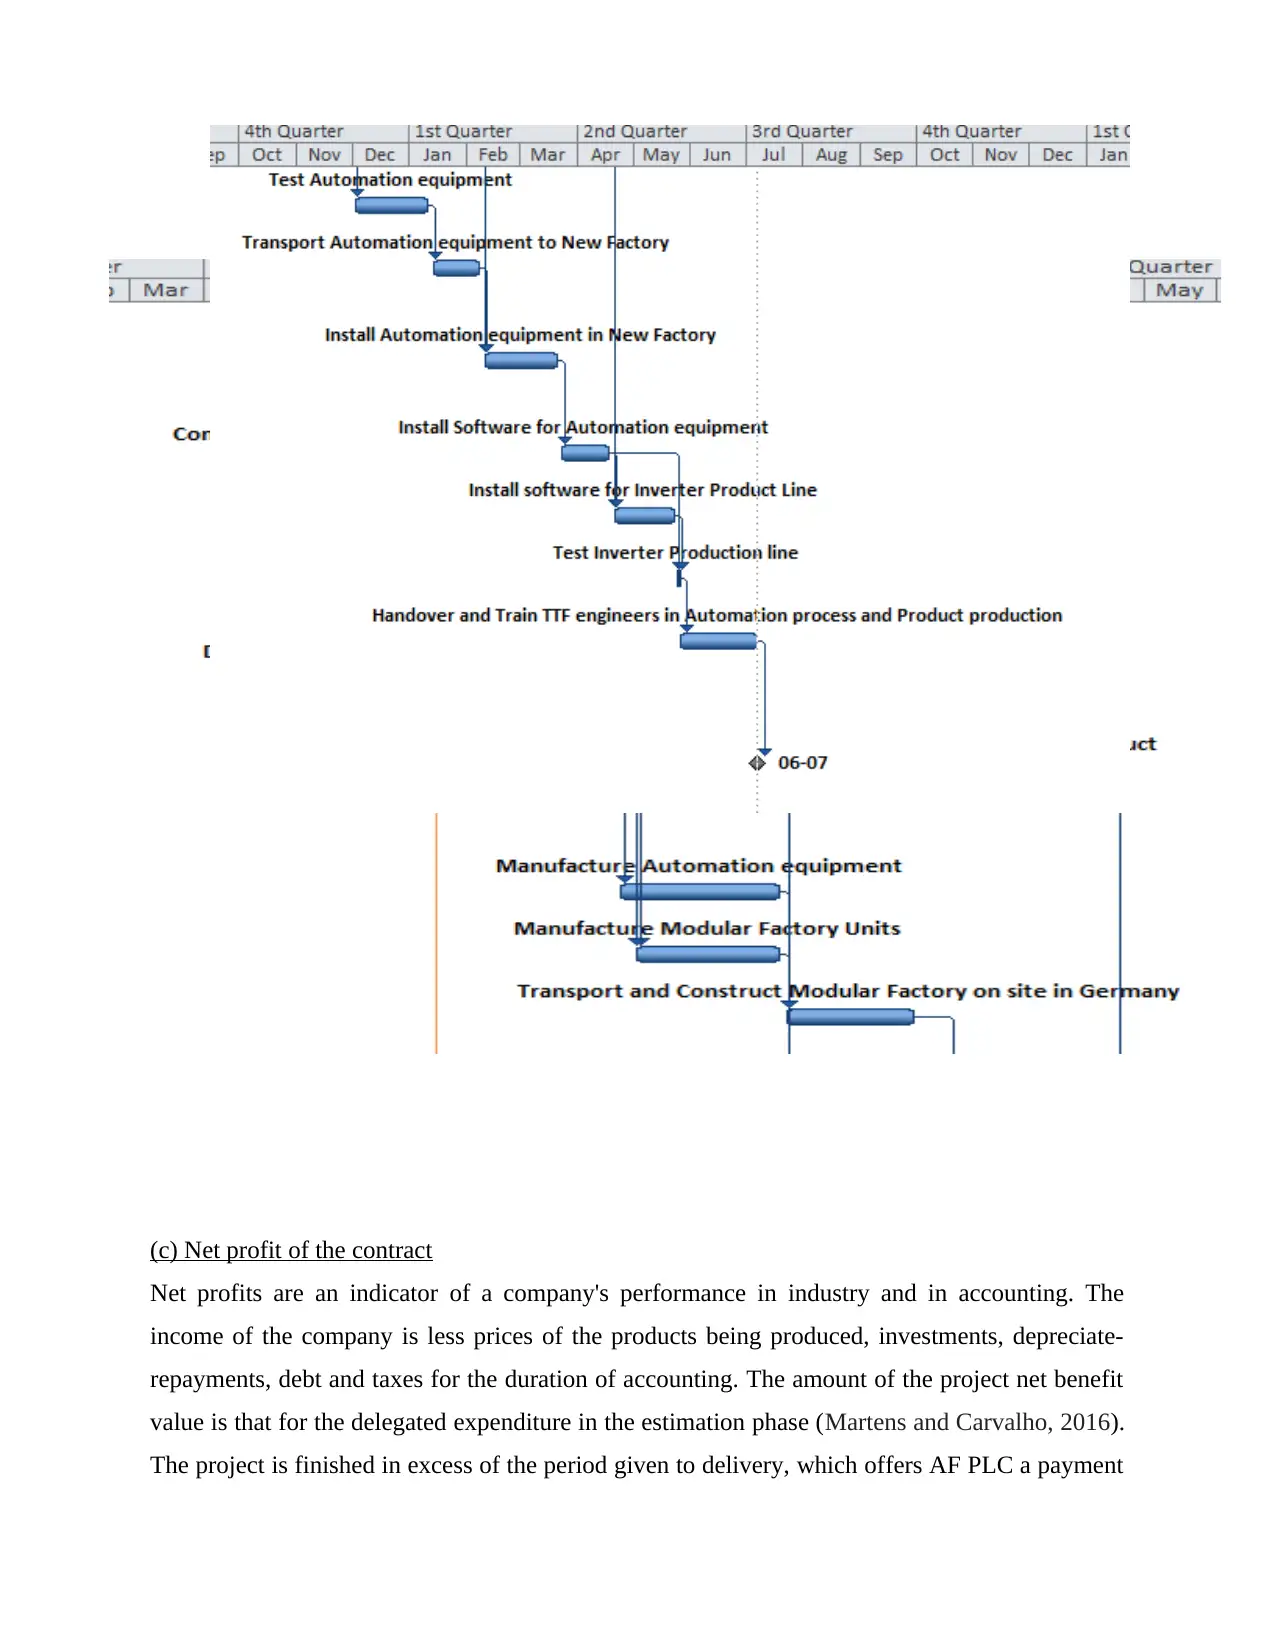
(b) Gantt Chart
A Gantt graph is a bar graph that displays a timeline of the project. The diagram shows the
functions on the vertical axis and periods on the horizontal side. During growing operation, the
width of the horizontal bars is seen in the graph (Huffman and Grubbs, 2018). Tablets in Gantt
identify the starting and end dates of the terminal elements and description project components.
The job breakdown framework for the project comprises of terminal elements and description
elements. Modern Gantt diagrams also display the relationships between behaviors with
dependency (i.e. precedence network). The Gantt Project Map for TTF PLC describes the
amount of time required to complete each operation. This way it would define the goal starting
date to enable the project to finish on schedule or not (Locatelli, Sainati and Greco, 2017). AF
PLC will begin this technical project on 8 July 2019 and conclude it on 6 July 2020. The closing
deadline for this phase is 25 September 2020 and the final delivery deadline is later. It tends to
recognize when the client would finish the project in progress and early completion benefits as
stated in the project contract.
PERT and Gantt maps are widely known additions to network diagrams. In project preparation
and monitoring from start to finish, a network diagram in project management is helpful
(Parthasarathi, Reddy and Rao, 2017). This is the vital direction of a project and the reach of the
project. The Project Network Diagram demonstrates, graphically or tabular, the length of the
tasks, the time span of the task and the conceptual dependency of the tasks. Contrary to the
WBS, the sequential sequence of operations based upon their dependences and not just the
conceptual sequence of the project's tasks are taken into account in the network diagram as well.
Special type of Network Diagram Bar charts such as Gantt charts
(b) Gantt Chart
A Gantt graph is a bar graph that displays a timeline of the project. The diagram shows the
functions on the vertical axis and periods on the horizontal side. During growing operation, the
width of the horizontal bars is seen in the graph (Huffman and Grubbs, 2018). Tablets in Gantt
identify the starting and end dates of the terminal elements and description project components.
The job breakdown framework for the project comprises of terminal elements and description
elements. Modern Gantt diagrams also display the relationships between behaviors with
dependency (i.e. precedence network). The Gantt Project Map for TTF PLC describes the
amount of time required to complete each operation. This way it would define the goal starting
date to enable the project to finish on schedule or not (Locatelli, Sainati and Greco, 2017). AF
PLC will begin this technical project on 8 July 2019 and conclude it on 6 July 2020. The closing
deadline for this phase is 25 September 2020 and the final delivery deadline is later. It tends to
recognize when the client would finish the project in progress and early completion benefits as
stated in the project contract.
(c) Net profit of the contract
Net profits are an indicator of a company's performance in industry and in accounting. The
income of the company is less prices of the products being produced, investments, depreciate-
repayments, debt and taxes for the duration of accounting. The amount of the project net benefit
value is that for the delegated expenditure in the estimation phase (Martens and Carvalho, 2016).
The project is finished in excess of the period given to delivery, which offers AF PLC a payment
⊘ This is a preview!⊘
Do you want full access?
Subscribe today to unlock all pages.
Trusted by 1+ million students worldwide
1 out of 26
Related Documents


Your All-in-One AI-Powered Toolkit for Academic Success.
+13062052269
info@desklib.com
Available 24*7 on WhatsApp / Email
![[object Object]](/_next/static/media/star-bottom.7253800d.svg)
Unlock your academic potential
Copyright © 2020–2026 A2Z Services. All Rights Reserved. Developed and managed by ZUCOL.