Comprehensive Review: Performance Measures of Plant Automation Systems
VerifiedAdded on 2021/06/07
|3
|2101
|71
Report
AI Summary
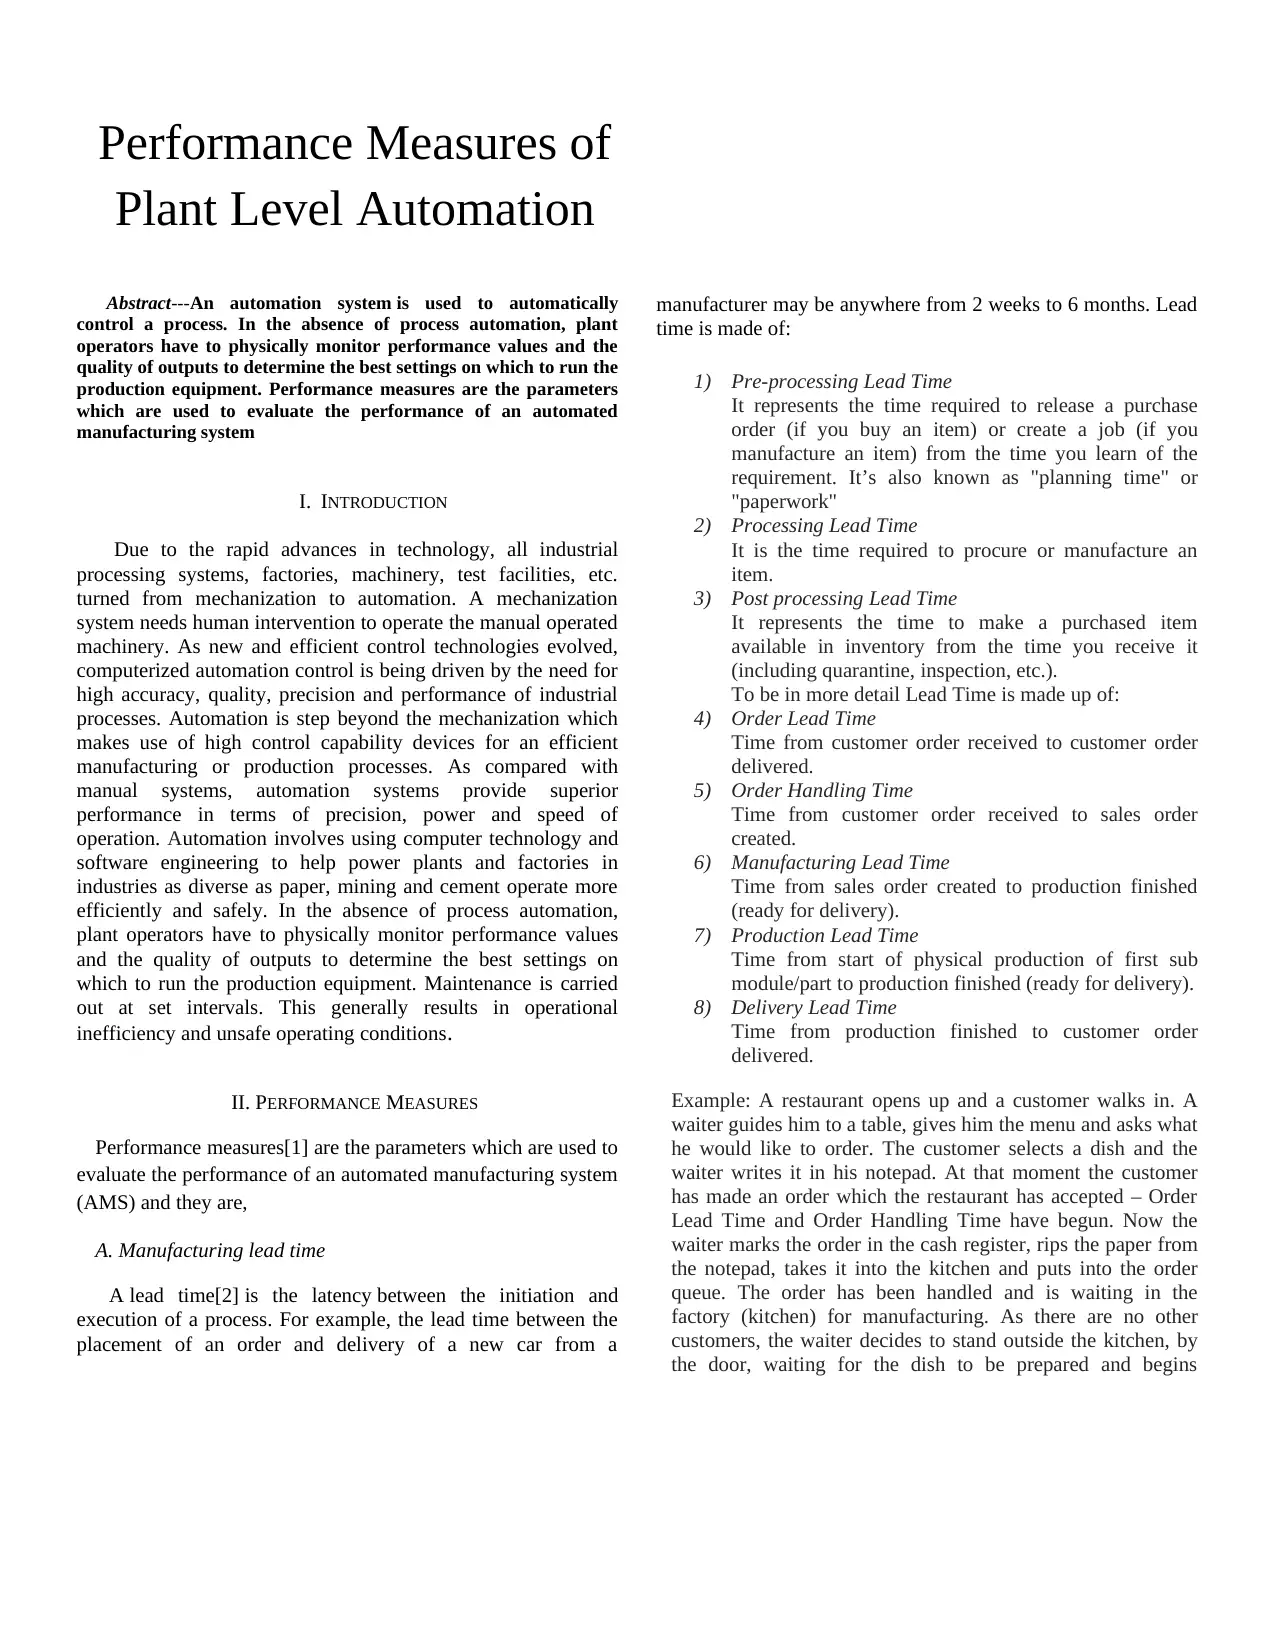
This report provides a comprehensive overview of performance measures in plant-level automation. It begins by defining automation and its advantages over mechanization, emphasizing the need for high accuracy and efficiency. The core of the report focuses on key performance indicators (KPIs) used to evaluate automated manufacturing systems. These include manufacturing lead time, broken down into pre-processing, processing, and post-processing phases, and work in progress (WIP). The report further explains throughput, capacity planning strategies (lead, lag, and match), machine utilization, flexibility, performability (combining performance and dependability), and quality control, including the Six Sigma methodology. Each measure is defined, and examples are provided to illustrate their practical application. The report concludes by emphasizing the interrelated nature of these performance measures and their importance in decision-making within automated manufacturing environments.

Performance Measures of
Plant Level Automation
Abstract---An automation system is used to automatically
control a process. In the absence of process automation, plant
operators have to physically monitor performance values and the
quality of outputs to determine the best settings on which to run the
production equipment. Performance measures are the parameters
which are used to evaluate the performance of an automated
manufacturing system
I. INTRODUCTION
Due to the rapid advances in technology, all industrial
processing systems, factories, machinery, test facilities, etc.
turned from mechanization to automation. A mechanization
system needs human intervention to operate the manual operated
machinery. As new and efficient control technologies evolved,
computerized automation control is being driven by the need for
high accuracy, quality, precision and performance of industrial
processes. Automation is step beyond the mechanization which
makes use of high control capability devices for an efficient
manufacturing or production processes. As compared with
manual systems, automation systems provide superior
performance in terms of precision, power and speed of
operation. Automation involves using computer technology and
software engineering to help power plants and factories in
industries as diverse as paper, mining and cement operate more
efficiently and safely. In the absence of process automation,
plant operators have to physically monitor performance values
and the quality of outputs to determine the best settings on
which to run the production equipment. Maintenance is carried
out at set intervals. This generally results in operational
inefficiency and unsafe operating conditions.
II. PERFORMANCE MEASURES
Performance measures[1] are the parameters which are used to
evaluate the performance of an automated manufacturing system
(AMS) and they are,
A. Manufacturing lead time
A lead time[2] is the latency between the initiation and
execution of a process. For example, the lead time between the
placement of an order and delivery of a new car from a
manufacturer may be anywhere from 2 weeks to 6 months. Lead
time is made of:
1) Pre-processing Lead Time
It represents the time required to release a purchase
order (if you buy an item) or create a job (if you
manufacture an item) from the time you learn of the
requirement. It’s also known as "planning time" or
"paperwork"
2) Processing Lead Time
It is the time required to procure or manufacture an
item.
3) Post processing Lead Time
It represents the time to make a purchased item
available in inventory from the time you receive it
(including quarantine, inspection, etc.).
To be in more detail Lead Time is made up of:
4) Order Lead Time
Time from customer order received to customer order
delivered.
5) Order Handling Time
Time from customer order received to sales order
created.
6) Manufacturing Lead Time
Time from sales order created to production finished
(ready for delivery).
7) Production Lead Time
Time from start of physical production of first sub
module/part to production finished (ready for delivery).
8) Delivery Lead Time
Time from production finished to customer order
delivered.
Example: A restaurant opens up and a customer walks in. A
waiter guides him to a table, gives him the menu and asks what
he would like to order. The customer selects a dish and the
waiter writes it in his notepad. At that moment the customer
has made an order which the restaurant has accepted – Order
Lead Time and Order Handling Time have begun. Now the
waiter marks the order in the cash register, rips the paper from
the notepad, takes it into the kitchen and puts into the order
queue. The order has been handled and is waiting in the
factory (kitchen) for manufacturing. As there are no other
customers, the waiter decides to stand outside the kitchen, by
the door, waiting for the dish to be prepared and begins
Paraphrase This Document
Need a fresh take? Get an instant paraphrase of this document with our AI Paraphraser

calculating Manufacturing Lead Time. Meanwhile, the chef
finishes what he was doing, takes the order from the queue,
starts his clock as a mark for the start of Production Lead Time
and begins cooking. The chef chops the vegetables, fries the
meat and boils the pasta. When the dish is ready, the chef rings
a bell and stops his clock. At the same time the waiter stops
calculating Manufacturing Lead Time and rushes through the
kitchen door to get the food while it is hot. When he picks it
up, begins counting of Delivery Lead Time that ends when the
dish is served to the customer, who can now happily say that
the Order Lead Time was shorter than he had expected.
Fig.1. Manufacturing lead time
B. Work in progress
Work in progress (WIP), also called work in process, is
inventory that has begun the manufacturing process and is no
longer included in raw materials inventory, but is not yet a
completed product. So they are company's partially finished
goods waiting for completion. WIP excludes inventory
of raw materials at the start of the production cycle and
finished products inventory at the end of the production
cycle.
Example: let's assume Company XYZ manufactures widgets.
It takes two weeks to make a widget. On the last day of the
month, when Company XYZ "closes the books,” the
company counts its inventory and sees that it has 10,000
widgets. It also has 4,000 partially completed widgets. These
4,000 partially completed widgets are recorded as work in
process.
C. Throughput
Throughput is the rate of production or the rate at which
something can be processed.
Throughput time = (move time+ Process time + Inspection
time) + Queue time
1) Move time. This is the time required to move items into
and out of the manufacturing area, as well as between
workstations within the production area.
2) Processing time. This is the time spent transforming
raw materials into finished goods.
3) Inspection time. This is the time spent inspecting raw
materials, work-in-process, and finished goods,
possibly at multiple stages of the production process.
4) Queue time. This is the time spent waiting prior to the
processing, inspection, and move activities.
D. Capacity
Volume of products that can be generated by
a production plant or enterprise in a given period by using
current resources is called capacity. There are three primary
strategies companies use to perform capacity planning. Each
comes with its own set of advantages and drawbacks,
1) Lead Strategy – The Lead Strategy is the most aggressive
of the three approaches to capacity planning. Here, the
company increases its production capacity in advance of
anticipated increases in demand. Some companies use the
Lead Strategy as a way to lure customers away from
competitors, especially if a competitor is vulnerable to
inventory shortages when demand skyrockets. The big risk
with the Lead Strategy is that the anticipated increase in
demand never materializes and you are stuck with excess
inventory.
2) Lag Strategy – The Lag Strategy is much more
conservative than the Lead Strategy. Instead of increasing
capacity in anticipation of suspected increases in demand,
the Lag Strategy responds to actual increases in demand by
boosting capacity after the operation is running at full
steam. Although you won't accumulate excess inventory,
the time it takes to ramp up production can result in the
loss of customers to the competition.
3) Match Strategy – The Match Strategy is the middle road
between the Lead and Lag Strategies. Rather than
substantially boosting capacity based on expected or actual
increases in demand, the Match Strategy emphasizes small,
incremental modifications to capacity based on changing
conditions in the marketplace. Even though this strategy
takes more effort and is harder to accomplish, it is much
more risk-averse than other capacity planning options.

E. Machine Utilization
The proportion of the available time (expressed usually as a
percentage) that a piece of equipment or a system is operating.
Machine utilization is given by,
Operating hours x 100 ÷ available hours
F. Flexibility
Flexibility covers the system's ability that allows the system
to react in case of changes, whether predicted or unpredicted.
Flexibility in manufacturing means the ability to deal with
slightly or greatly mixed parts, to allow variation in parts
assembly and variations in process sequence, change the
production volume and change the design of certain product
being manufactured.
Example: a mobile phone manufacture have an average ability to
produce 50000 units of a specific model for sale on the initial
release week they get 75000 pre orders for the next week. So in
these circumstances the company must be flexible to increase its
production for 100% to 150%. Also after few months the
demand for the same decreases the company must also be
flexible to reduce the production of the same.
G. Performability
Performability, at first impression, appears to be simply
some measure of performance. "The ability to perform," one
may think. In actuality, performance makes up only half of a
performability[3] evaluation. Performability is a composite
measure a system's performance and its dependability. This
measure is the vital evaluation method for degradable systems
- highly dependable systems which can undergo a graceful
degradation of performance in the presence of faults
(malfunctions) allowing continued "normal" operation.
In the past, most modelling work kept performance and
dependability separate. Initially, the dependability of the system
might have been satisfied, then the performance optimised and
this lead to systems having good performance when the system
was fully functional but a drastic decline in performance when,
inevitably failure occurred. Basically, the system was either 'on'
and running perfectly or 'off' when it crashed. Improvements on
this lead to the design of degradable systems. Because
degradable systems are designed to continue their operation
even in the presence of component failures their performance
cannot be accurately evaluated without taking into account the
impact of the structural change.
Example: a spacecraft control system containing three CPUs. A
failure in this system would be catasrophic, possibly resulting in
loss of life. Thus, the system is designed to degrade upon failure
of CPU "1" which was working on 50% load, i.e. CPUs "2" and
"3" will drop their lower priority works of 25 % each in order to
complete high priority work that the failed CPU would have
done
H. Quality
Quality of a product or service refers to the perception of
the degree to which the product or service meets the customer's
expectations personnel may measure quality in the degree that a
product is reliable, maintainable, or sustainable. A quality item
has the ability to perform satisfactorily in service and is suitable
for its intended purpose. Six Sigma is a set of techniques and
tools for process improvement. The central idea behind Six
Sigma is that if you can measure how many 'defects' you have in
a process, you can systematically figure out how to eliminate
them and get as close to 'zero defects' as possible. To achieve
Six Sigma Quality, a process must produce no more than 3.4
defects per million opportunities.
III. CONCLUSION
Performance measures are the parameters which are
used to evaluate the performance of an automated manufacturing
system (AMS). Using performance modelling one can compute
these measures of performance for a given system and use it in
decision making. Performance measures are quite interrelated
and each assumes increased importance in a particular context.
X. REFERENCES
[1] Performance Modeling of Automated Manufacturing
Systems, N. Viswanadham and Y. Narahari, Prentice-Hall,
Englewood Cliffs, U.S.A., 1992.
[2] https://en.wikipedia.org/wiki/Lead_time
[3]http://www.doc.ic.ac.uk/~nd/surprise_95/journal/vol4/eaj2/
report.html
⊘ This is a preview!⊘
Do you want full access?
Subscribe today to unlock all pages.

Trusted by 1+ million students worldwide
1 out of 3
Related Documents

Your All-in-One AI-Powered Toolkit for Academic Success.
+13062052269
info@desklib.com
Available 24*7 on WhatsApp / Email
Unlock your academic potential
Copyright © 2020–2025 A2Z Services. All Rights Reserved. Developed and managed by ZUCOL.