Project: Automobile Production Optimization and Sensitivity Report
VerifiedAdded on  2020/05/11
|9
|1309
|56
Project
AI Summary
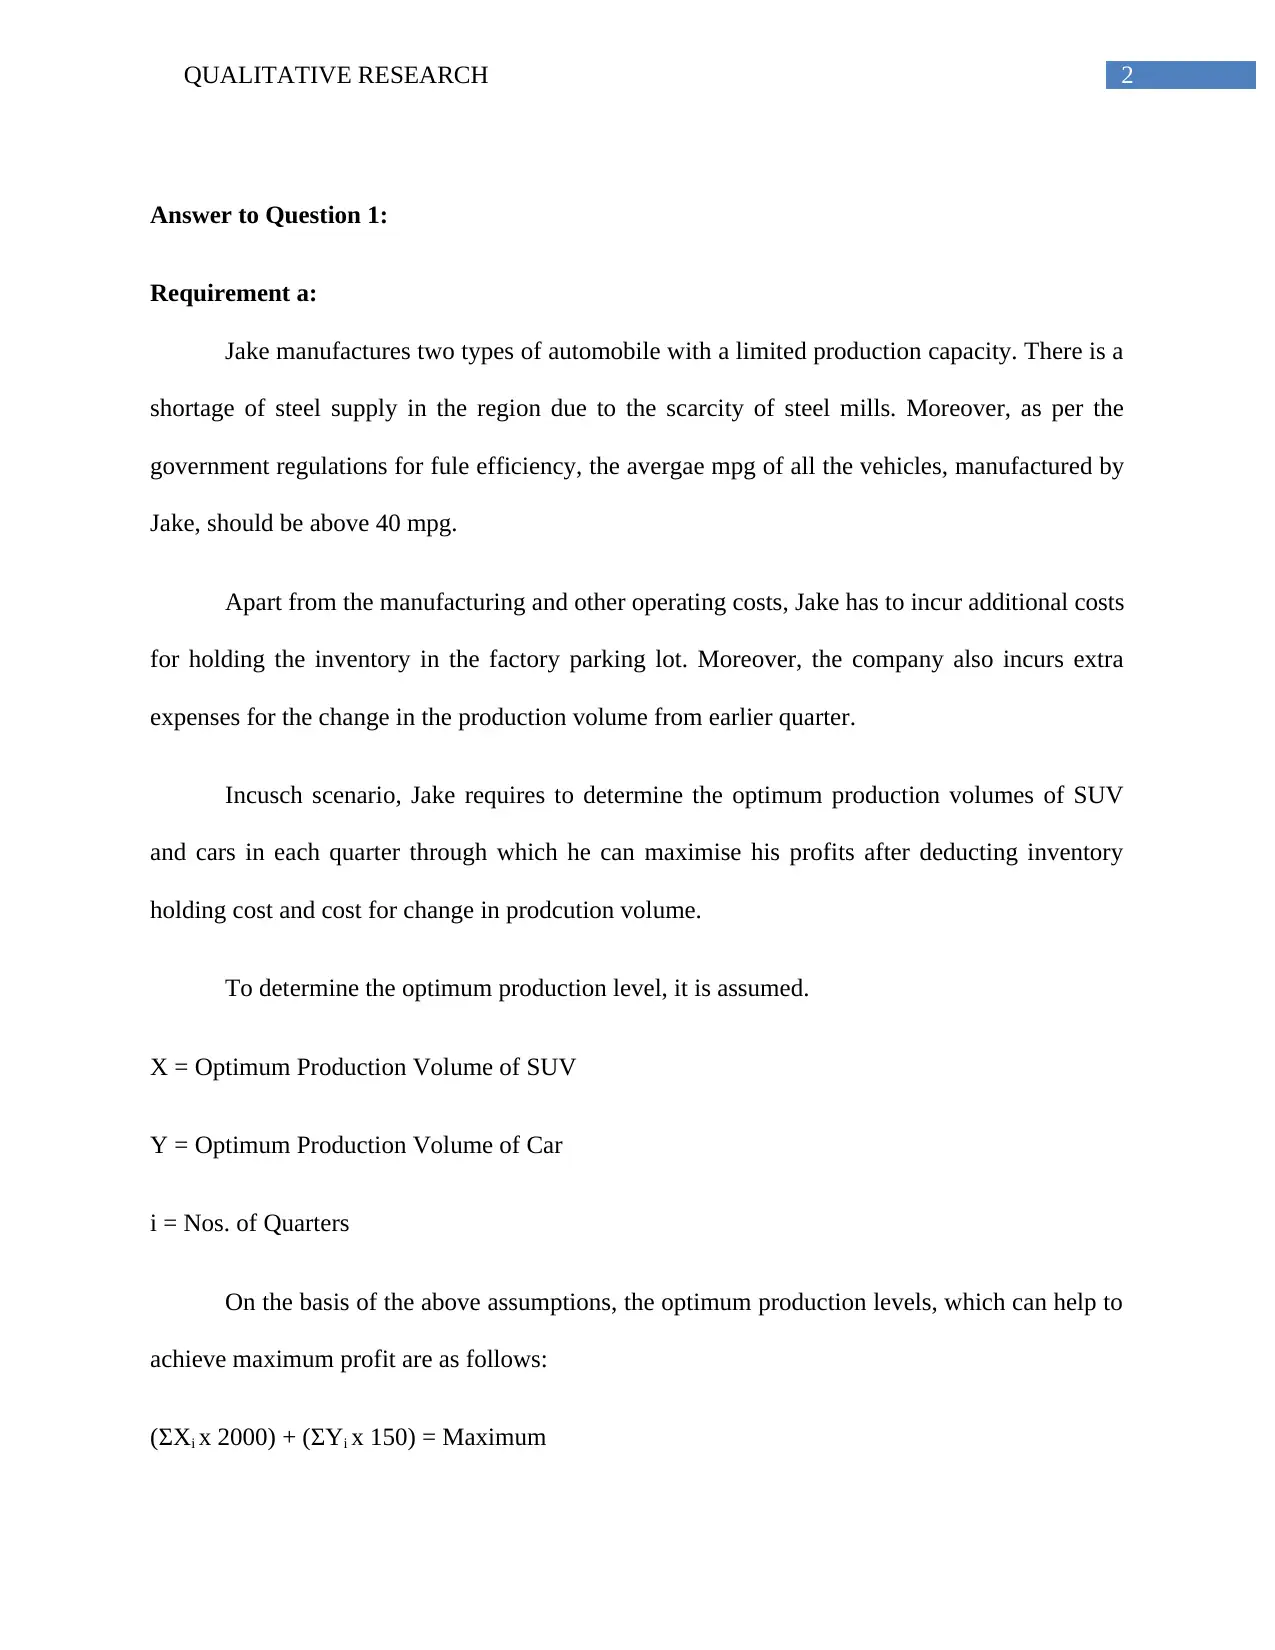
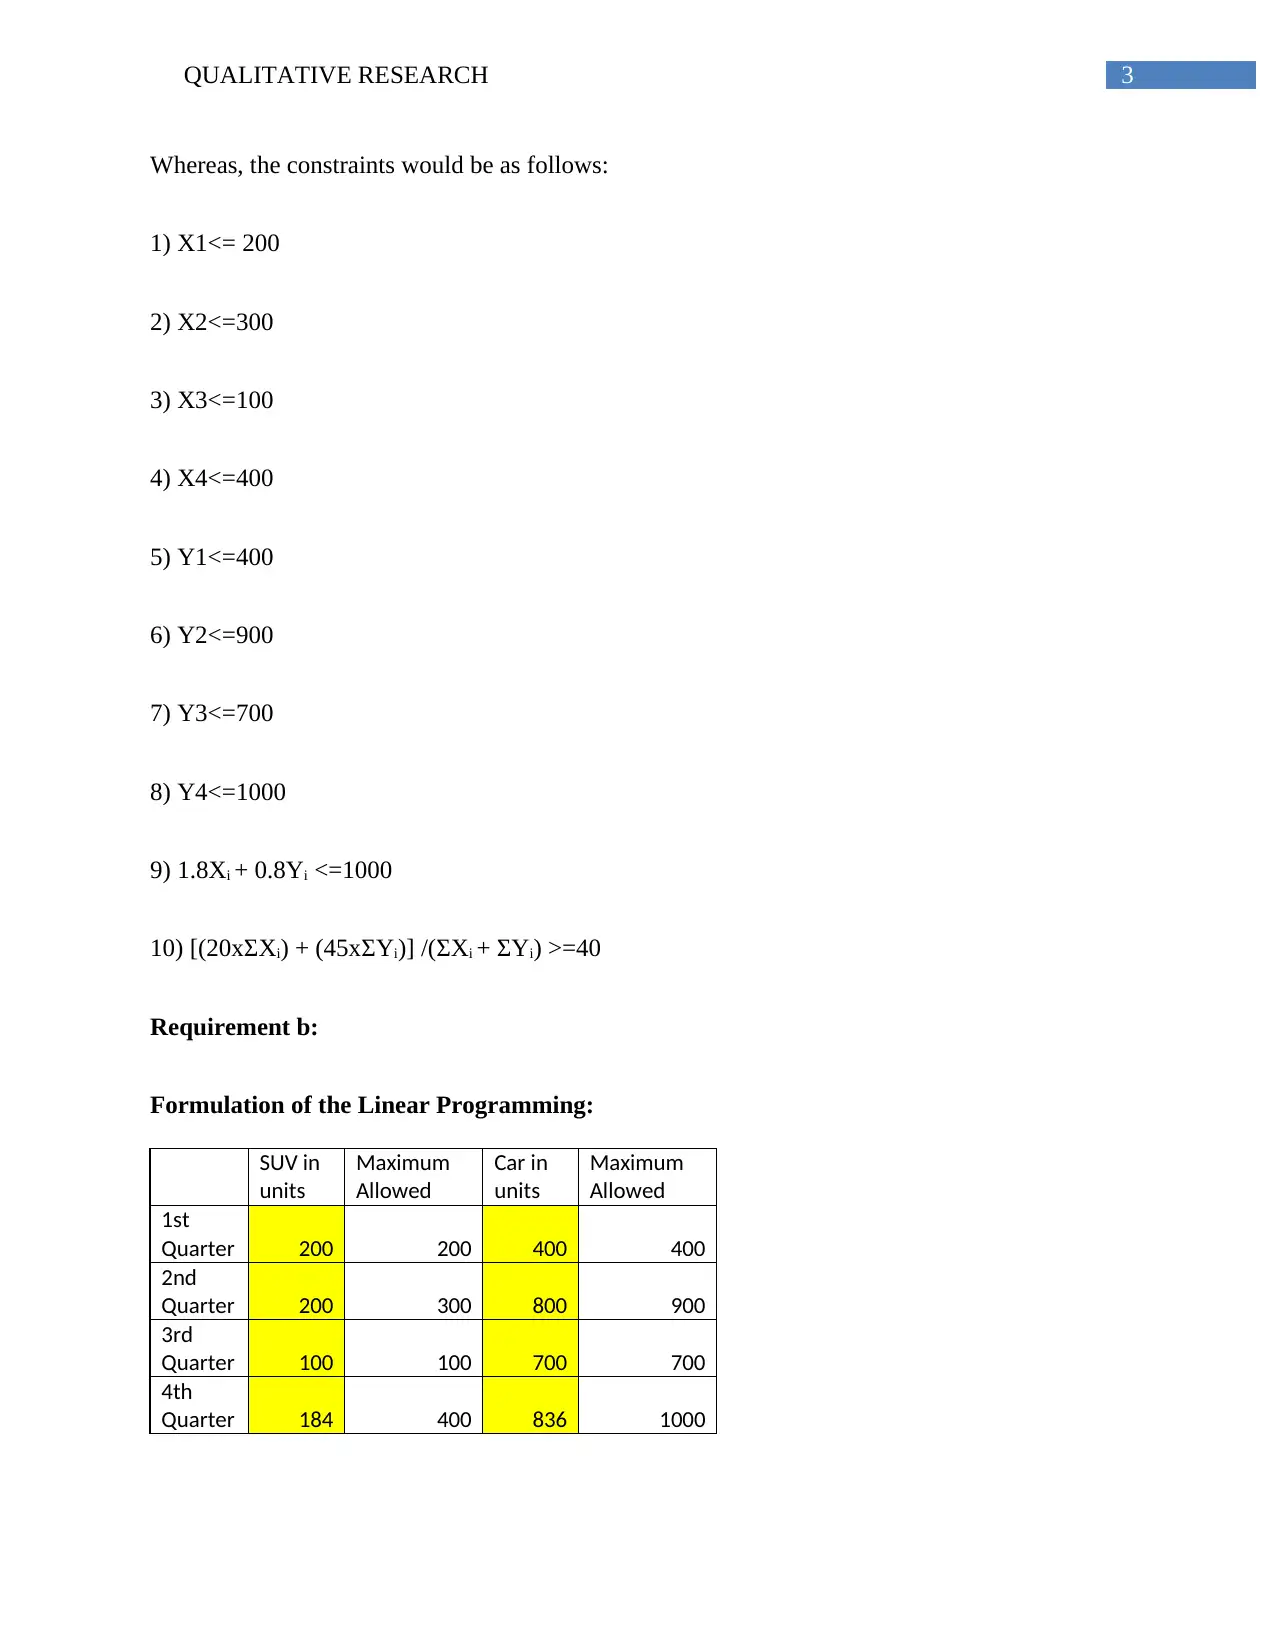
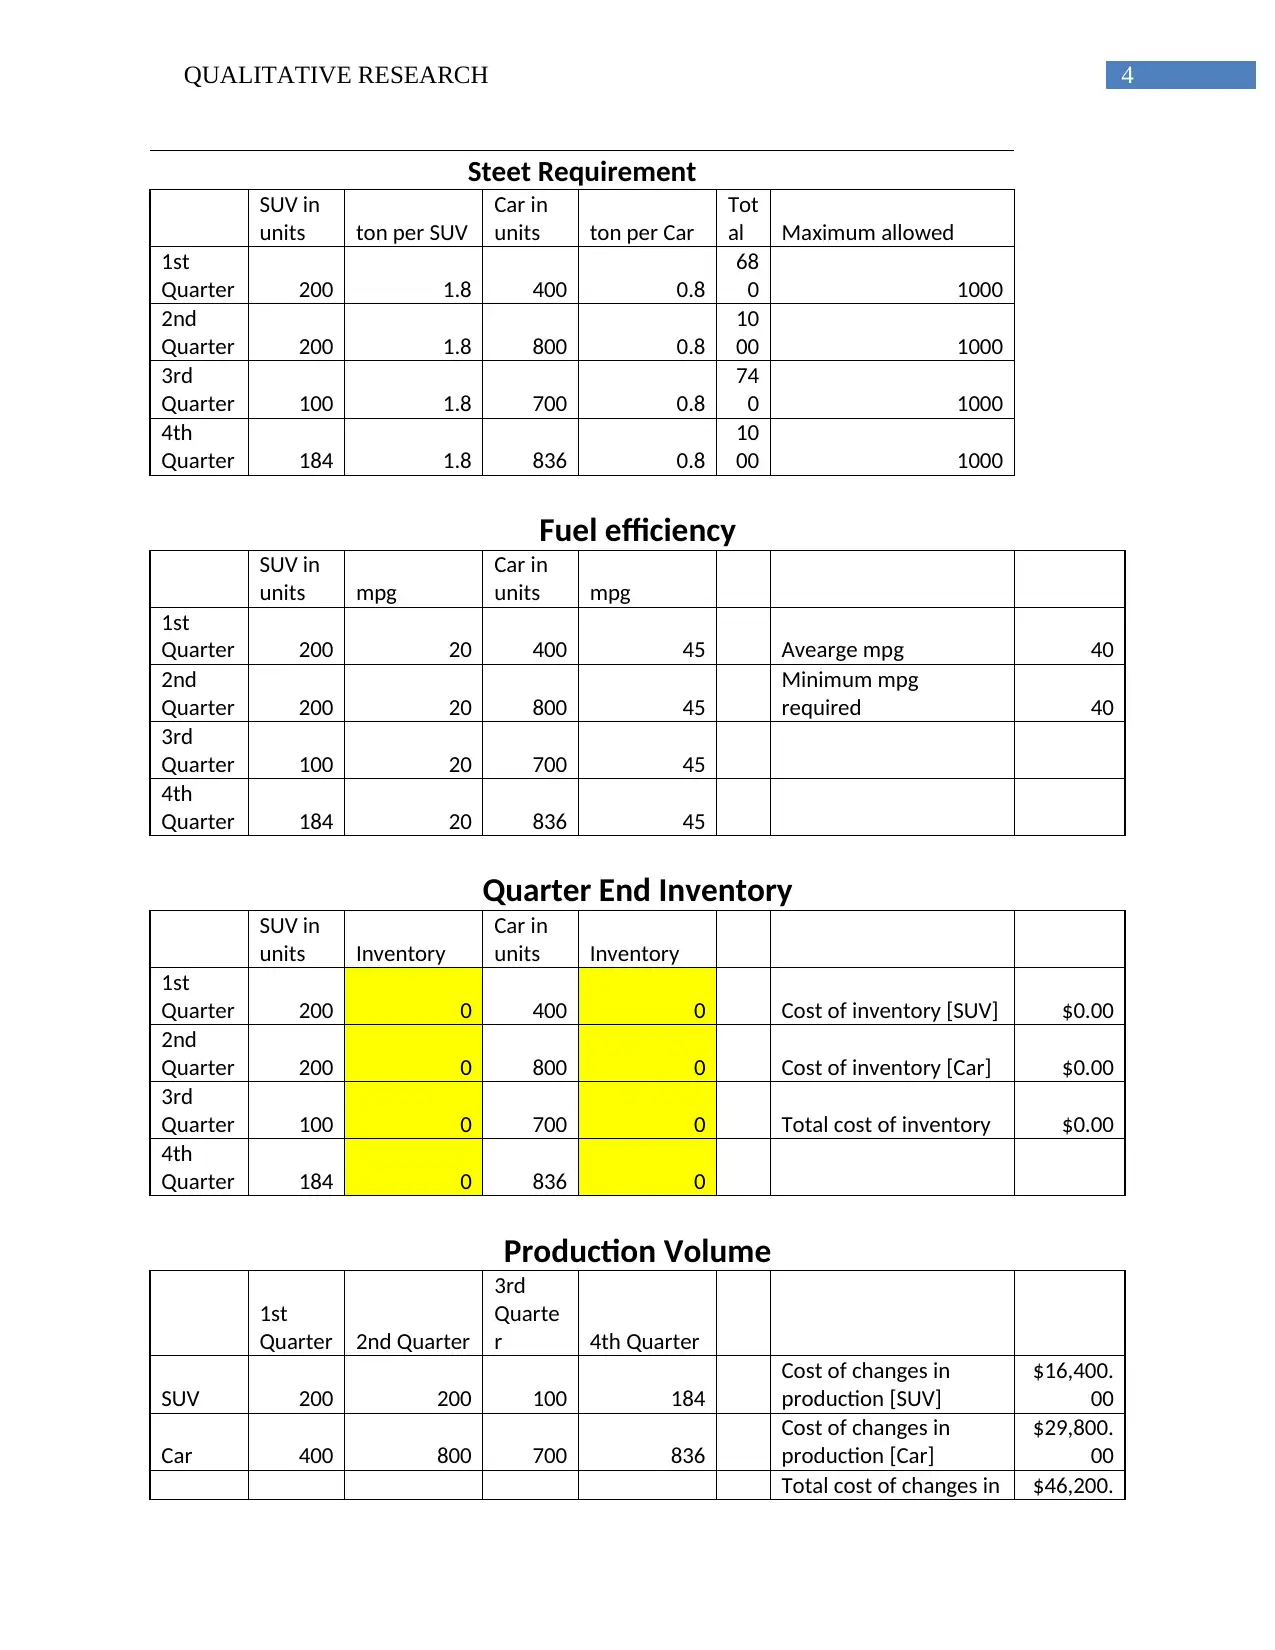
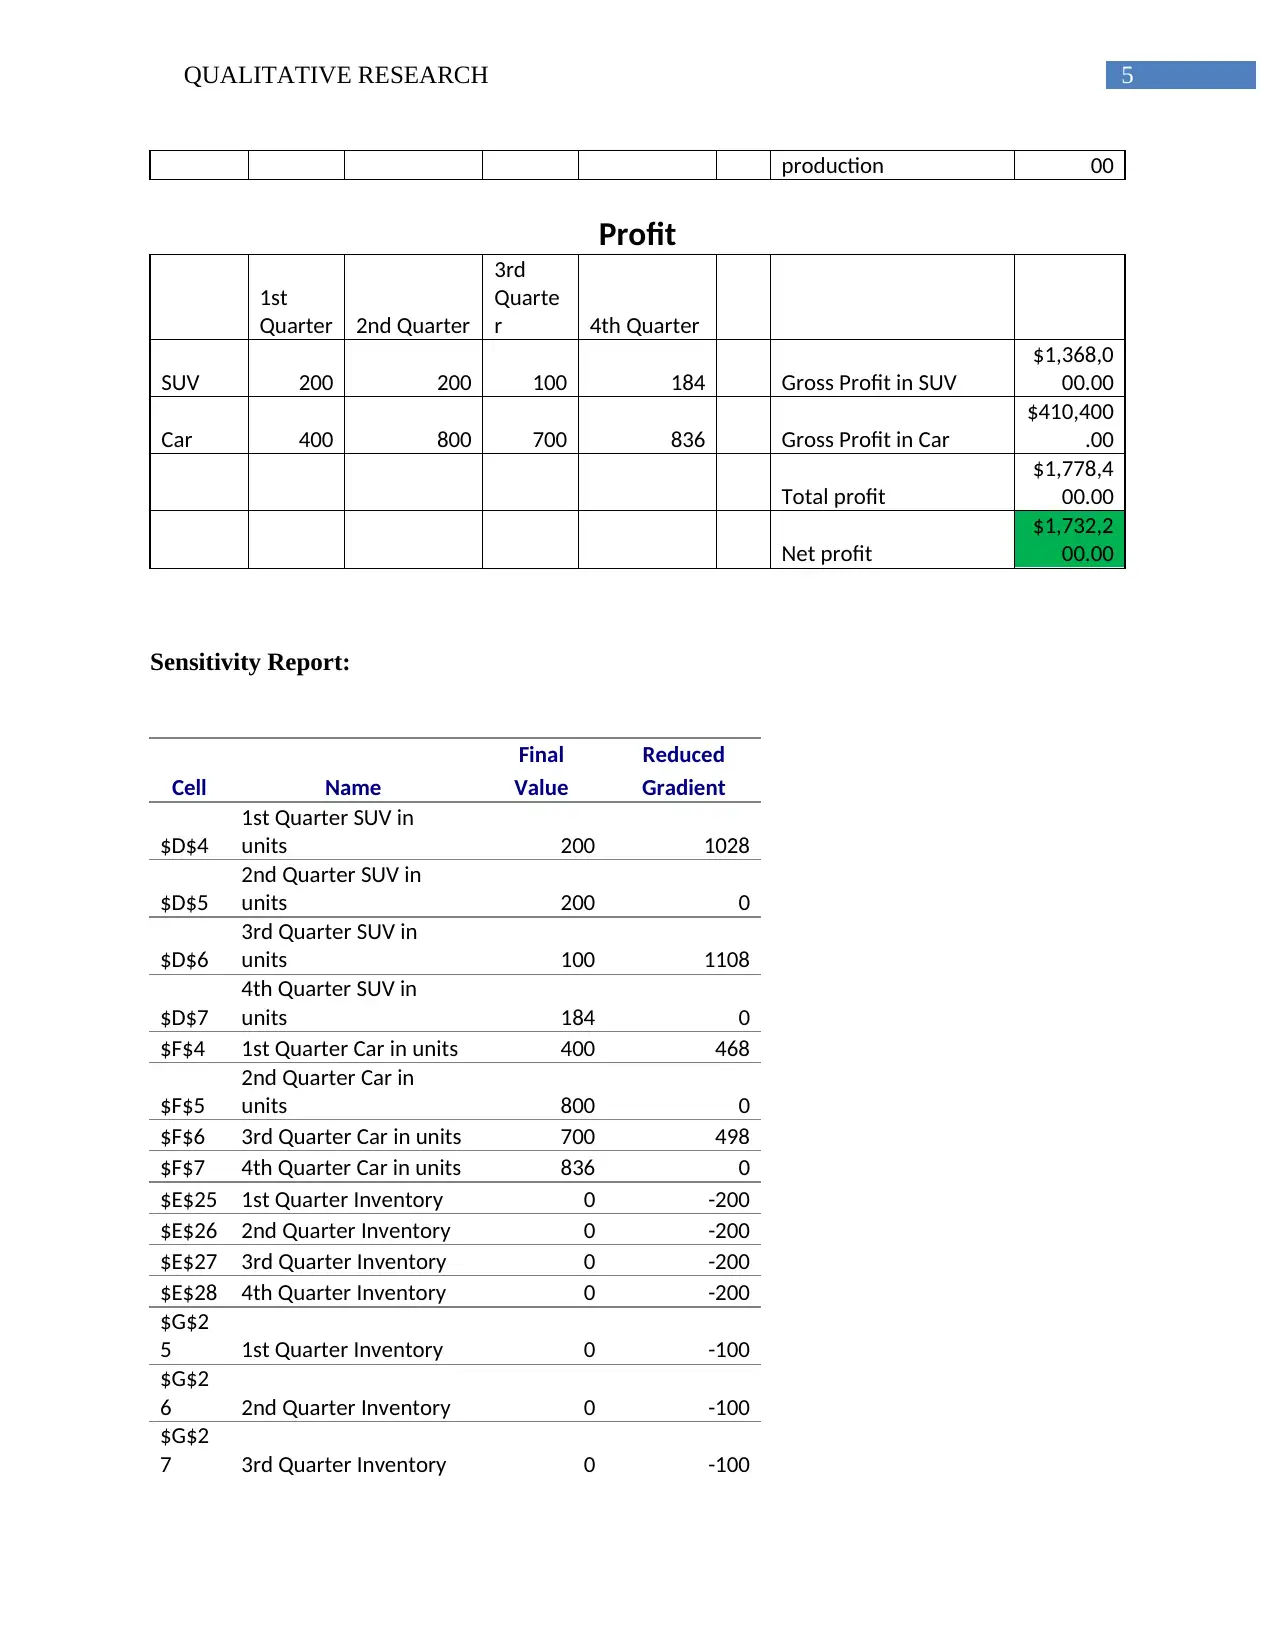
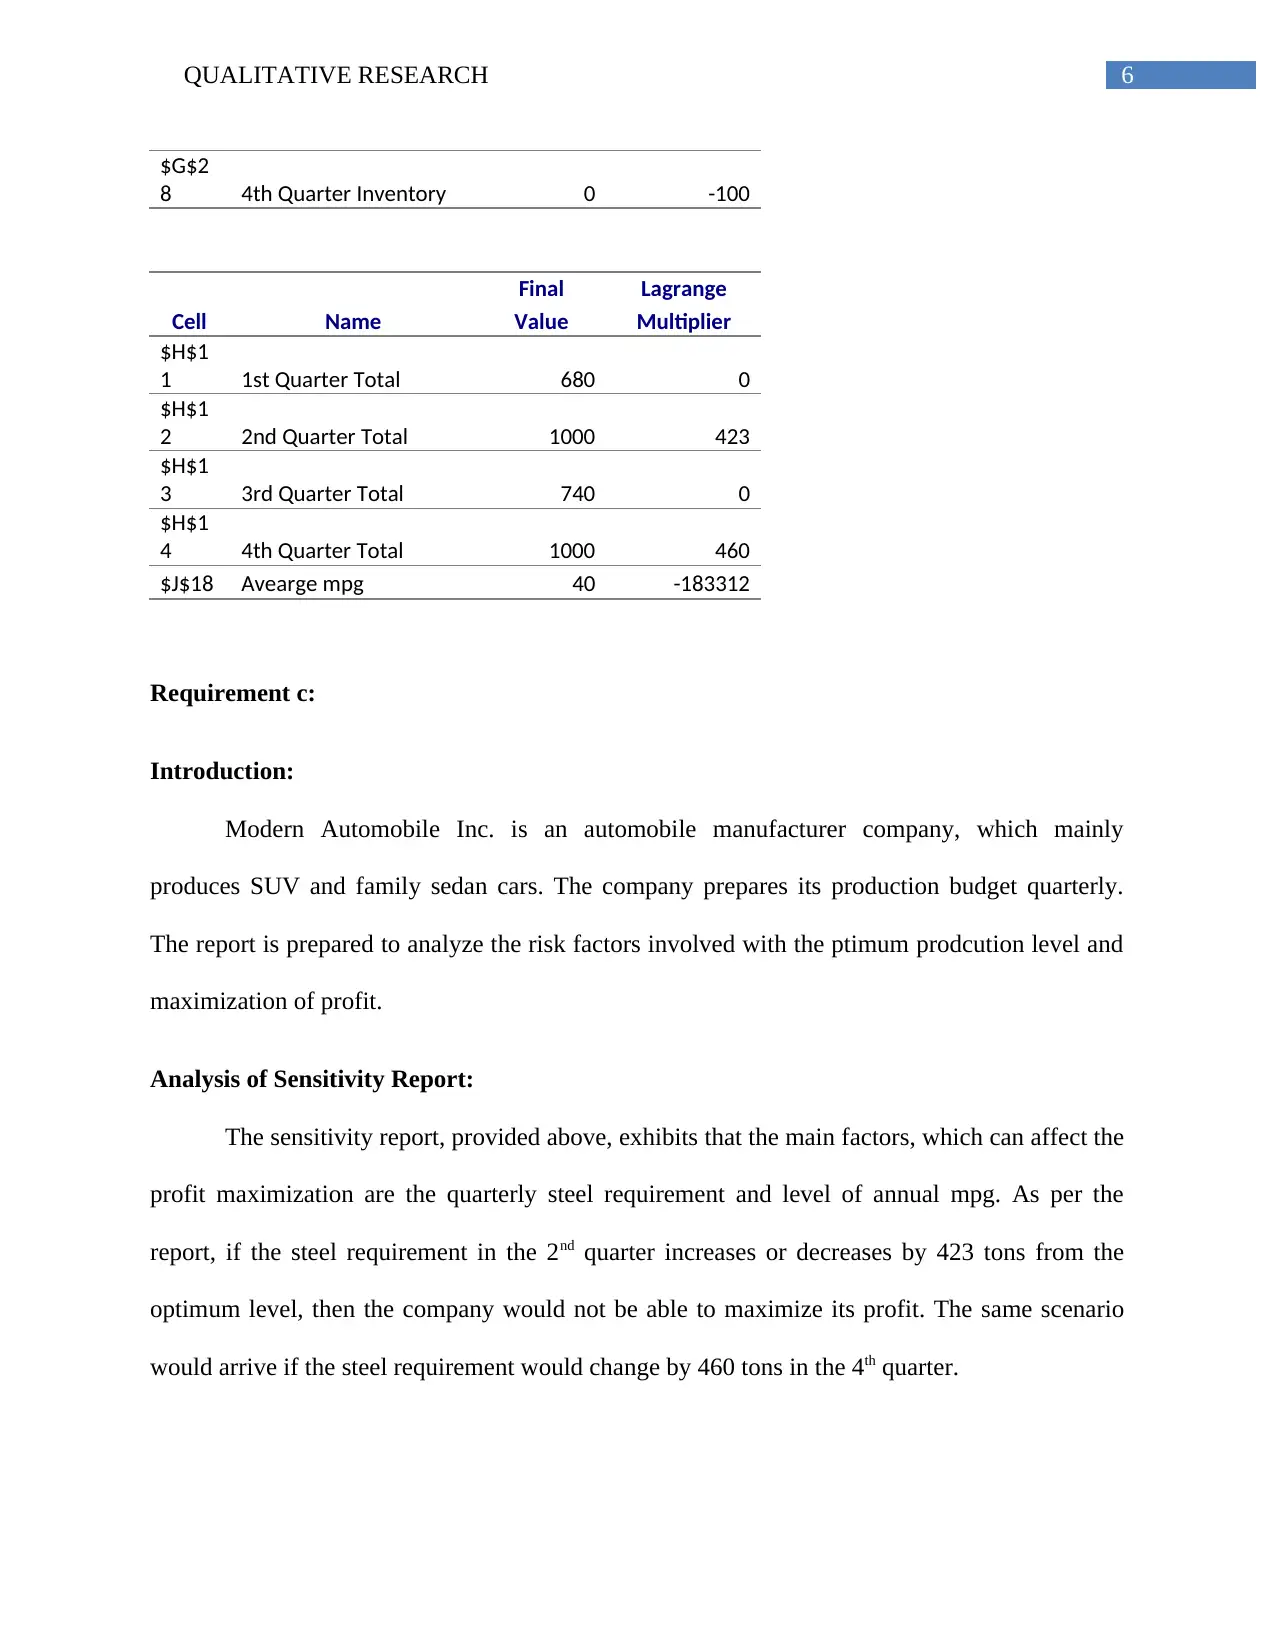
This project report analyzes the production optimization of an automobile manufacturing company, Modern Automobile Inc., focusing on maximizing profits through efficient production planning. The report addresses the constraints of steel supply, fuel efficiency regulations, inventory holding costs, and production volume changes. It formulates a linear programming model to determine the optimal production volumes of SUVs and cars across four quarters, considering factors like steel requirements, fuel efficiency, and inventory costs. The analysis includes a detailed sensitivity report, identifying key factors affecting profit maximization, such as quarterly steel requirements and annual average MPG. The report concludes by highlighting the importance of inventory management and suggests incorporating average inventory levels for more effective results, while also acknowledging the limitations of the model in not accounting for inventory holding costs.
Contribute Materials
Your contribution can guide someone’s learning journey. Share your
documents today.

Running head: QUALITATIVE RESEARCH
Qualitative Research
Name of the Student:
Name of the University:
Author’s Note:
Qualitative Research
Name of the Student:
Name of the University:
Author’s Note:
Secure Best Marks with AI Grader
Need help grading? Try our AI Grader for instant feedback on your assignments.

1QUALITATIVE RESEARCH
Table of Contents
Answer to Question 1:.....................................................................................................................2
Requirement a:.............................................................................................................................2
Requirement b:.............................................................................................................................3
Formulation of the Linear Programming:................................................................................3
Sensitivity Report:...................................................................................................................5
Requirement c:.............................................................................................................................6
Introduction:............................................................................................................................6
Analysis of Sensitivity Report:................................................................................................6
Conclusion:..............................................................................................................................6
Bibliography:...................................................................................................................................8

2QUALITATIVE RESEARCH
Answer to Question 1:
Requirement a:
Jake manufactures two types of automobile with a limited production capacity. There is a
shortage of steel supply in the region due to the scarcity of steel mills. Moreover, as per the
government regulations for fule efficiency, the avergae mpg of all the vehicles, manufactured by
Jake, should be above 40 mpg.
Apart from the manufacturing and other operating costs, Jake has to incur additional costs
for holding the inventory in the factory parking lot. Moreover, the company also incurs extra
expenses for the change in the production volume from earlier quarter.
Incusch scenario, Jake requires to determine the optimum production volumes of SUV
and cars in each quarter through which he can maximise his profits after deducting inventory
holding cost and cost for change in prodcution volume.
To determine the optimum production level, it is assumed.
X = Optimum Production Volume of SUV
Y = Optimum Production Volume of Car
i = Nos. of Quarters
On the basis of the above assumptions, the optimum production levels, which can help to
achieve maximum profit are as follows:
(ΣXi x 2000) + (ΣYi x 150) = Maximum

3QUALITATIVE RESEARCH
Whereas, the constraints would be as follows:
1) X1<= 200
2) X2<=300
3) X3<=100
4) X4<=400
5) Y1<=400
6) Y2<=900
7) Y3<=700
8) Y4<=1000
9) 1.8Xi + 0.8Yi <=1000
10) [(20xΣXi) + (45xΣYi)] /(ΣXi + ΣYi) >=40
Requirement b:
Formulation of the Linear Programming:
SUV in
units
Maximum
Allowed
Car in
units
Maximum
Allowed
1st
Quarter 200 200 400 400
2nd
Quarter 200 300 800 900
3rd
Quarter 100 100 700 700
4th
Quarter 184 400 836 1000
Secure Best Marks with AI Grader
Need help grading? Try our AI Grader for instant feedback on your assignments.

4QUALITATIVE RESEARCH
Steet Requirement
SUV in
units ton per SUV
Car in
units ton per Car
Tot
al Maximum allowed
1st
Quarter 200 1.8 400 0.8
68
0 1000
2nd
Quarter 200 1.8 800 0.8
10
00 1000
3rd
Quarter 100 1.8 700 0.8
74
0 1000
4th
Quarter 184 1.8 836 0.8
10
00 1000
Fuel efficiency
SUV in
units mpg
Car in
units mpg
1st
Quarter 200 20 400 45 Avearge mpg 40
2nd
Quarter 200 20 800 45
Minimum mpg
required 40
3rd
Quarter 100 20 700 45
4th
Quarter 184 20 836 45
Quarter End Inventory
SUV in
units Inventory
Car in
units Inventory
1st
Quarter 200 0 400 0 Cost of inventory [SUV] $0.00
2nd
Quarter 200 0 800 0 Cost of inventory [Car] $0.00
3rd
Quarter 100 0 700 0 Total cost of inventory $0.00
4th
Quarter 184 0 836 0
Production Volume
1st
Quarter 2nd Quarter
3rd
Quarte
r 4th Quarter
SUV 200 200 100 184
Cost of changes in
production [SUV]
$16,400.
00
Car 400 800 700 836
Cost of changes in
production [Car]
$29,800.
00
Total cost of changes in $46,200.

5QUALITATIVE RESEARCH
production 00
Profit
1st
Quarter 2nd Quarter
3rd
Quarte
r 4th Quarter
SUV 200 200 100 184 Gross Profit in SUV
$1,368,0
00.00
Car 400 800 700 836 Gross Profit in Car
$410,400
.00
Total profit
$1,778,4
00.00
Net profit
$1,732,2
00.00
Sensitivity Report:
Final Reduced
Cell Name Value Gradient
$D$4
1st Quarter SUV in
units 200 1028
$D$5
2nd Quarter SUV in
units 200 0
$D$6
3rd Quarter SUV in
units 100 1108
$D$7
4th Quarter SUV in
units 184 0
$F$4 1st Quarter Car in units 400 468
$F$5
2nd Quarter Car in
units 800 0
$F$6 3rd Quarter Car in units 700 498
$F$7 4th Quarter Car in units 836 0
$E$25 1st Quarter Inventory 0 -200
$E$26 2nd Quarter Inventory 0 -200
$E$27 3rd Quarter Inventory 0 -200
$E$28 4th Quarter Inventory 0 -200
$G$2
5 1st Quarter Inventory 0 -100
$G$2
6 2nd Quarter Inventory 0 -100
$G$2
7 3rd Quarter Inventory 0 -100

6QUALITATIVE RESEARCH
$G$2
8 4th Quarter Inventory 0 -100
Final Lagrange
Cell Name Value Multiplier
$H$1
1 1st Quarter Total 680 0
$H$1
2 2nd Quarter Total 1000 423
$H$1
3 3rd Quarter Total 740 0
$H$1
4 4th Quarter Total 1000 460
$J$18 Avearge mpg 40 -183312
Requirement c:
Introduction:
Modern Automobile Inc. is an automobile manufacturer company, which mainly
produces SUV and family sedan cars. The company prepares its production budget quarterly.
The report is prepared to analyze the risk factors involved with the ptimum prodcution level and
maximization of profit.
Analysis of Sensitivity Report:
The sensitivity report, provided above, exhibits that the main factors, which can affect the
profit maximization are the quarterly steel requirement and level of annual mpg. As per the
report, if the steel requirement in the 2nd quarter increases or decreases by 423 tons from the
optimum level, then the company would not be able to maximize its profit. The same scenario
would arrive if the steel requirement would change by 460 tons in the 4th quarter.
Paraphrase This Document
Need a fresh take? Get an instant paraphrase of this document with our AI Paraphraser

7QUALITATIVE RESEARCH
The annual average mpg at the stated prodcution level would be 40, whereas, the
Lagrange Multiplier is -183312. It indicates though the annual average mpg level is a sigficant
factor for determining the production level, the profit level would not be affected highly for any
slight changes in the annual average mpg.
Conclusion:
The sensitivity report has helped to identify the significant factors, which can affect the
profit levels. However, it has not included the factors, like, optimum inventory holding level, as
there is no such condition, provided for this factor. As per the program, the company can achieve
the maximum profit only if the inventory, held at factory parking, would be nil. Such condition is
not practically feasible. Hence, the management should determine the avergae level of
inventories, which are stored in the parking lot at the end of the quarter. Then, the linear
program, prepared above, would provide more effective results.

8QUALITATIVE RESEARCH
Bibliography:
Chaffey, D., & White, G. (2010). Business information management: Improving performance
using information systems. Pearson Education.
Galliers, R. D., & Leidner, D. E. (Eds.). (2014). Strategic information management: challenges
and strategies in managing information systems. Routledge.
Pearlson, K. E., Saunders, C. S., & Galletta, D. F. (2016). Managing and Using Information
Systems, Binder Ready Version: A Strategic Approach. John Wiley & Sons.
Peppard, J., & Ward, J. (2016). The strategic management of information systems: Building a
digital strategy. John Wiley & Sons.
1 out of 9

Your All-in-One AI-Powered Toolkit for Academic Success.
 +13062052269
info@desklib.com
Available 24*7 on WhatsApp / Email
Unlock your academic potential
© 2024  |  Zucol Services PVT LTD  |  All rights reserved.