Autonomous Renewable Energy System Design for Balfour Hospital
VerifiedAdded on 2023/01/23
|26
|5006
|94
Report
AI Summary
This report presents the design and feasibility study of an autonomous renewable energy system for Balfour General Hospital in Orkney Island, Scotland. The study explores the integration of solar PV, wind energy, and a backup diesel generator to provide a reliable power supply. The report includes a detailed analysis of the hospital's load demand, climatic conditions, and the availability of renewable energy sources. The design considerations involve the selection of appropriate equipment such as solar panels, inverters, and wind turbines, along with an assessment of their performance characteristics. The feasibility study covers wind and solar energy potential at the site, including wind speed analysis and sunshine hours. The report also discusses the selection of inverters and the simulation of the solar PV system using PSIM software. The study concludes with an assessment of the potential of the hybrid system to meet the hospital's energy needs and highlights the benefits of renewable energy integration in remote locations.

Group members
1.
Instructor
Autonomous Energy System
Date
1.
Instructor
Autonomous Energy System
Date
Paraphrase This Document
Need a fresh take? Get an instant paraphrase of this document with our AI Paraphraser

INTRODUCTION.
With increasing demand of green energy, various technologies has evolved to address the deficit.
Green sources of energy can be integrated in a hybrid system to provide useful energy and reduce
over-reliance on the organic form of energy such as fossil fuels. The Orkney Island in the Scotland is
a populated subcontinent landmass surrounded with water of the Atlantic Ocean and North Sea. Most
regions of the Island is marginalized with less population connected to the grid. Economically,
traversing oceanic water with transmission lines with endeavor of supplying energy to less dense
populated island is very expensive on the scale of expenses and returns. With evolving technology in
the field of green renewable energy, stand-alone micro-grids have proven to be reliable in
rejuvenating such remotely accessible area with electrical energy. For instance, Orkney Island has
become globally popular for embracing technology in renewable sources of energy. Most of the
renewable energy harnessed in this island come from wind, tidal energy and solar insolation
integrated systems [1]
This report entails designing of the autonomous renewable energy for the Balfour general hospital.
The location of the hospital is suitable for installation of a stand-alone solar PV energy integrated with
wind and back up diesel generator. Feasibility study of the hospital and the surrounding vicinity was
carried out to determining designing factors of the hybrid system. Load analysis of the hospital was
also carried out with my weight on heavy hospital electrical equipment.
FEASIBILITY STUDY.
The study sort to find factors that could enhance quality and quality of power harnessed from the
location of installation. The hybrid system to be designed includes wind power, solar PV system
power, battery storage bank and back-up diesel generator. The process was split into three major
categories as mentioned below.
I. Wind power
II. Solar Energy
III. Diesel generator.
For the design considerations, the main primary electricity units are wind and solar energy. The main
function of the generator in the network is to offer back-up when there is peak load demand or and
when the primary sources incur faults and require repair and maintenance.
Analyzing availability of power on the site
Availability of natural sources of energy in the sight was studied. The GIS location of Balfour
general hospital is located at latitude 58o26’N and longitude 305’39”W as shown in the map below.
Fig 1: The GIS location of Balfour Hospital in Westray Orkney Island, Scotland.
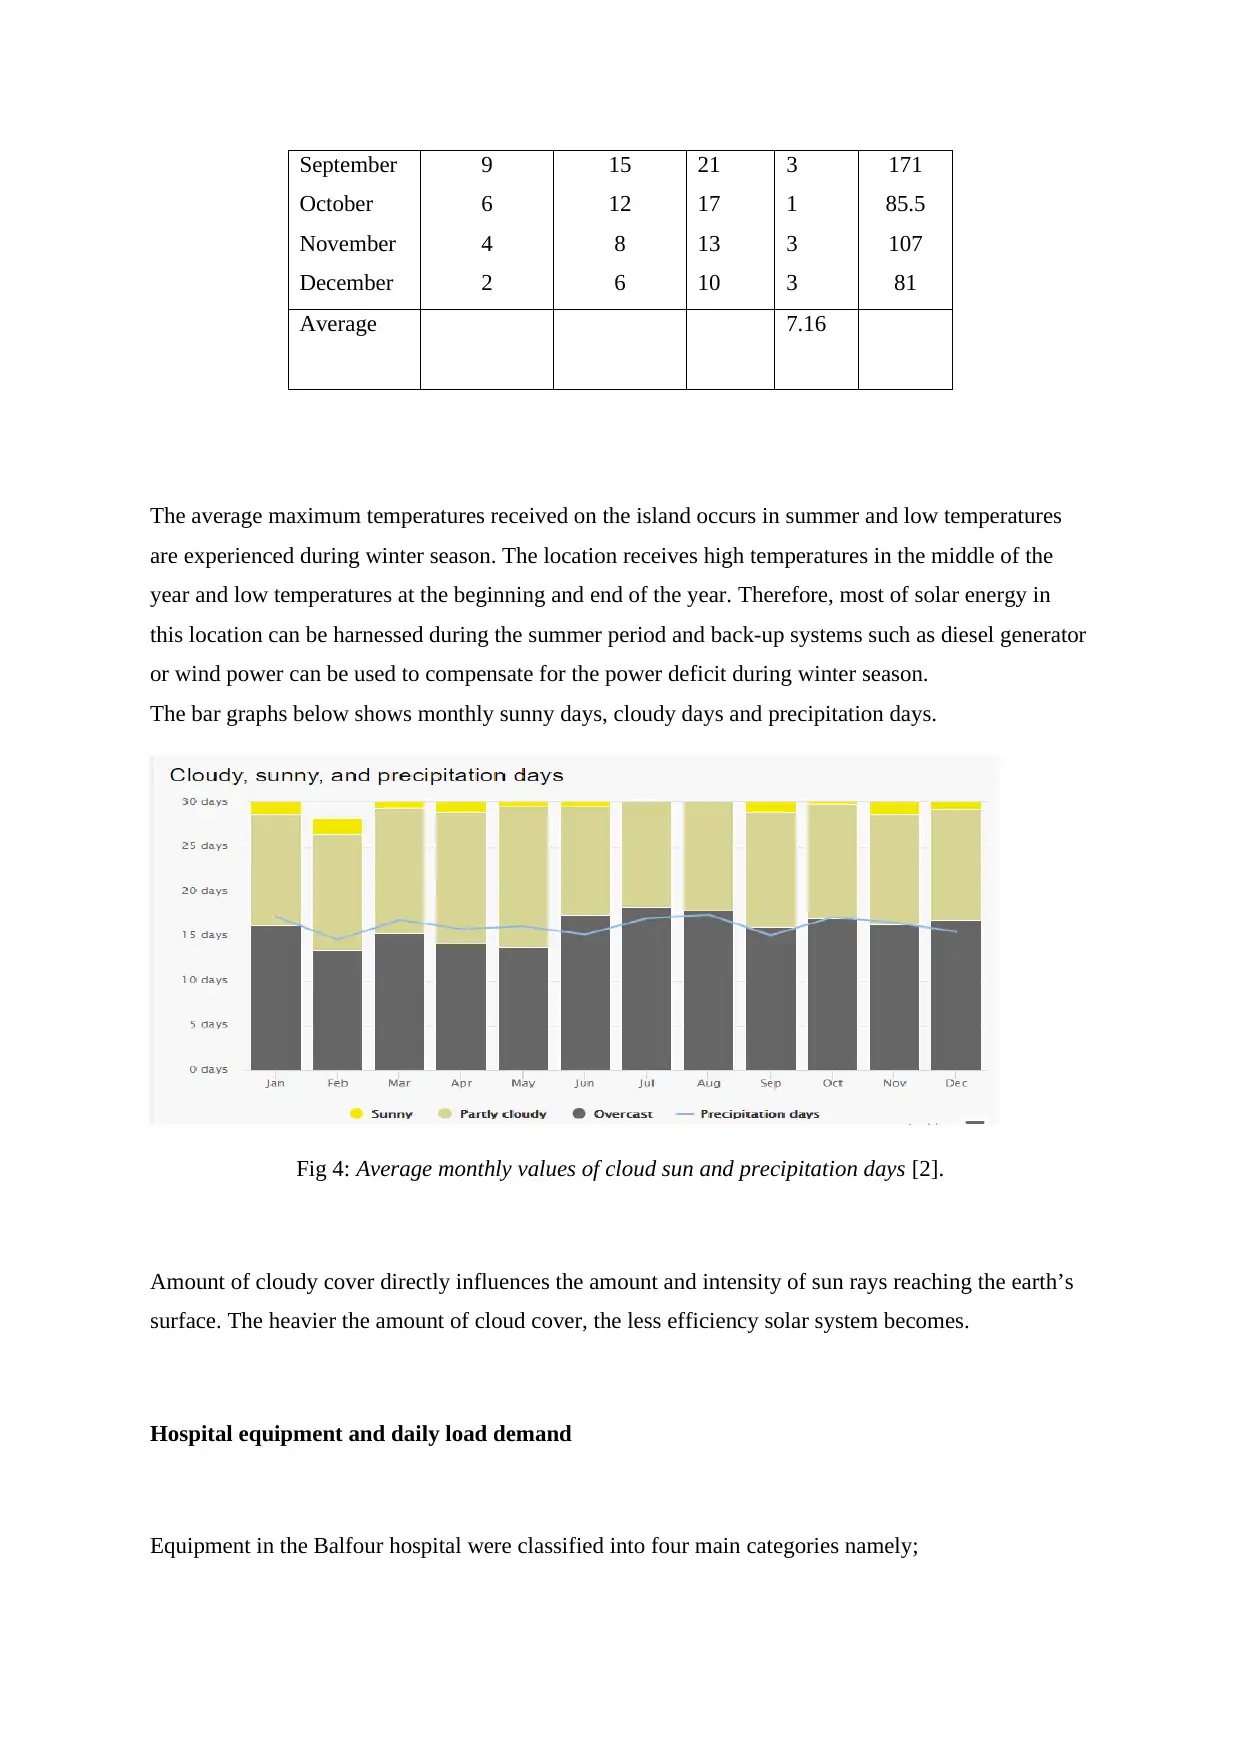
Climatic conditions were retrieved from the meteorological data. Sun hours recorded from the year
2009 to 2018 as retrieved from the database is shown below [2].
Fig 2: Hours of sunshine in Westray Orkney Island for a decade [2].
The pattern shows a trend of intermittent behavior of daily sunshine hours, a correlation which is vital
when determining the capacity of solar PV system. Average temperature profile of the Westray
Orkney as retrieved from meteorological data is shown below [2].
general hospital is located at latitude 58o26’N and longitude 305’39”W as shown in the map below.
Fig 1: The GIS location of Balfour Hospital in Westray Orkney Island, Scotland.
Climatic conditions were retrieved from the meteorological data. Sun hours recorded from the year
2009 to 2018 as retrieved from the database is shown below [2].
Fig 2: Hours of sunshine in Westray Orkney Island for a decade [2].
The pattern shows a trend of intermittent behavior of daily sunshine hours, a correlation which is vital
when determining the capacity of solar PV system. Average temperature profile of the Westray
Orkney as retrieved from meteorological data is shown below [2].
⊘ This is a preview!⊘
Do you want full access?
Subscribe today to unlock all pages.
Trusted by 1+ million students worldwide

Fig 3: Average temperature and precipitation of Westray Orkney Island [2].
The following data was extracted from the above bar and line graphs.
Table 1: Extracted Values of Temperature and Sun days in Westray Orkney Island.
Month Minimum
temperature
in 0C
Maximum
temperature
0C
Hot
day
0C
Sun
days
(2018)
Total
sun
hours
per
year
January
February
March
April
May
June
July
August
1
1
2
4
6
8
10
10
6
7
8
10
13
15
17
17
10
11
14
17
20
22
23
23
6
8
4
9
18
16
9
6
96.6
113
99
216
246.3
301
240
212
Paraphrase This Document
Need a fresh take? Get an instant paraphrase of this document with our AI Paraphraser
September
October
November
December
9
6
4
2
15
12
8
6
21
17
13
10
3
1
3
3
171
85.5
107
81
Average 7.16
The average maximum temperatures received on the island occurs in summer and low temperatures
are experienced during winter season. The location receives high temperatures in the middle of the
year and low temperatures at the beginning and end of the year. Therefore, most of solar energy in
this location can be harnessed during the summer period and back-up systems such as diesel generator
or wind power can be used to compensate for the power deficit during winter season.
The bar graphs below shows monthly sunny days, cloudy days and precipitation days.
Fig 4: Average monthly values of cloud sun and precipitation days [2].
Amount of cloudy cover directly influences the amount and intensity of sun rays reaching the earth’s
surface. The heavier the amount of cloud cover, the less efficiency solar system becomes.
Hospital equipment and daily load demand
Equipment in the Balfour hospital were classified into four main categories namely;

I. Medical electrical equipment
II. Structural equipment
III. Computer and telecom equipment.
Medical electrical equipment further classified into heavy and light electrical equipment depending on
the wattage rating. Structural equipment has system that operates Heat Ventilation Air Conditioner
(HVAC) and lighting system. Balfour General hospital accommodate a capacity of 68 inpatients. It
has 20 medical beds, 42 beds for surgical operations and 6 beds located in the midwifery unit. It is a
24-hour operational hospital.
The hospital has numerous devices that runs on the electric power. However, this report analyzed
major hospital equipment that consumes high wattage as shown below.
Table 2: Hospital Electrical Pilot Loads and Operation hours.
Item
Number
Equipment Quantity Electrical
specification
Wattag
e
Operation
hours
Total kWh
1 X-ray 1 250V A 5kW 5.6 28
2 Operating theatre
light
1 120V 2kW 10 20
3 Gastro scope 1 250V 10kW 3 30
4 Electrocardiograph 1 250V 6kW 4 24
5 Electro-surgical
unit
1 120V 3kW 9 27
6 Defibrillator 1 120V 5kW 6 30
7 ICU (patient
monitor)
4 250V 6kW 3 18
8 Oxygen
Concentrator
1 120V 0.5kW 20 10
9 Analyzer
Hematology
1 120V 3kW 5 15
10 Incubator
laboratory
1 250V 4kW 10 40
11 Refrigerator 1 120V 5kW 7 35
12 CT-Scanner 1 250V 4kW 7 28
13 Cardiotocograph 1 250V 3kW 11 33
14 Nebulizer 1 250V 1kW 10 10
⊘ This is a preview!⊘
Do you want full access?
Subscribe today to unlock all pages.
Trusted by 1+ million students worldwide

15 Infant Warmer 1 250V 4kW 13 52
TOTAL 1 80kW 400kWh
The total average daily demand of the Balfour hospital was found as 400kWh which is equivalent to
12000kWh per month. The wattage demand of the equipment was found as 80Kw.
Solar PV energy.
The feasibility study in this stage was incredibly insightful in determining the amount of solar power
that can be harnessed as well the rating of the network equipment. Various profiles and orientations of
roof tops on various selected buildings and other structures were critically studied. Both surface area
and inclination angles of the rooftops were measured and calculated to determine availability of space
and possible azimuth angle of the panel arrays. Possibility of roof shading by nearest structures and
trees was also dealt with. Following the above criteria, establishment of the exact spot of solar panel
mounting was determined aided by various engineering tools. Putting into consideration of the factor
determined above, solar panels with each having 175kWp and efficiency of 40% was selected for this
project. The V-I and load characteristics of the PV module was simulated in PSIM software as shown
below
Paraphrase This Document
Need a fresh take? Get an instant paraphrase of this document with our AI Paraphraser
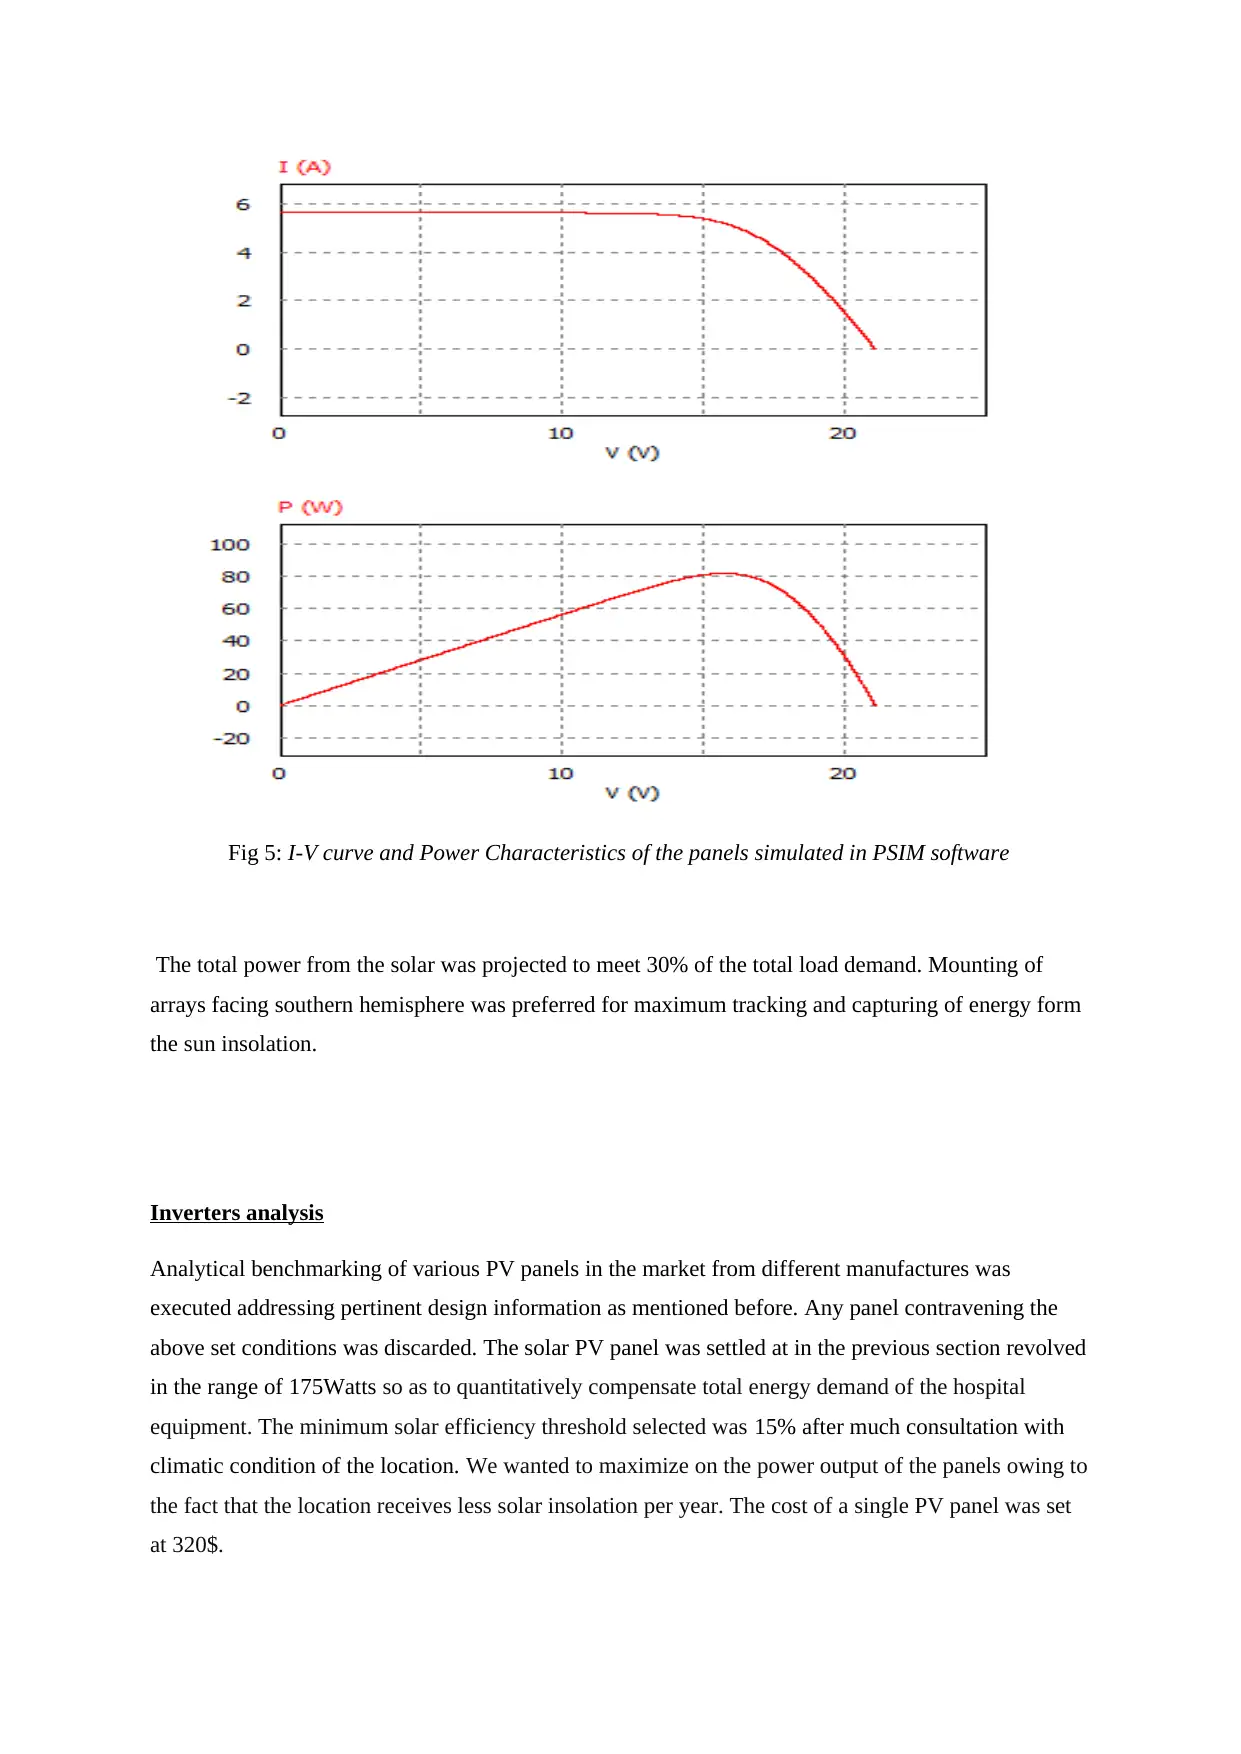
Fig 5: I-V curve and Power Characteristics of the panels simulated in PSIM software
The total power from the solar was projected to meet 30% of the total load demand. Mounting of
arrays facing southern hemisphere was preferred for maximum tracking and capturing of energy form
the sun insolation.
Inverters analysis
Analytical benchmarking of various PV panels in the market from different manufactures was
executed addressing pertinent design information as mentioned before. Any panel contravening the
above set conditions was discarded. The solar PV panel was settled at in the previous section revolved
in the range of 175Watts so as to quantitatively compensate total energy demand of the hospital
equipment. The minimum solar efficiency threshold selected was 15% after much consultation with
climatic condition of the location. We wanted to maximize on the power output of the panels owing to
the fact that the location receives less solar insolation per year. The cost of a single PV panel was set
at 320$.

Most inverters suitable for the load magnitude range between 3kW-7kW output and in commercial
range of 100kW. It will require more than one low rate pairs of inverters for these system. Low rated
inverters are economically cheaper. Using many small range inverter in sync is very essential
especially during breakdown of one of the inverter, the other inverters will continuous supply power
into the network. However, power supply is not reliable when only one largely rated single inverter is
feeding micro-grid. In case of failure, there is a complete freezing of the micro-grid network. The size
of inverter chosen for these application is in range of 7 kW with efficiency of 85% and it costs 2,590$.
Feasibility study of wind energy generation.
Speed of wind is determined pressure difference between high atmospheric pressure zones to low
atmospheric pressure zone. Maximum energy of the upstream wind in wind turbine can be determined
using Betz law which states that the power extracted by rotor from wind is directly proportional to the
velocity of wind speed multiplied by the wind pressure drop across the rotor. Orkney has highest
number of installed micro wind turbine, over 500 domestic scale, and several larger wind turbines
since area has rich wind energy resources.
Wind abundancy region and ever growing wind energy, Orkney became major exporter of wind
energy in the year 2013/2014. From reliable data sources such as OREF Micro-generator Database, it
has quantified how wind turbines in Orkney produces a lot of electricity during winter, saving over
50,000 tonnes of carbon dioxide emissions to date.
Site assessment for wind power
Wind availability in the location of interest was retrieved from online sources of retrieved
meteorological data is as shown below.
Strong wind experienced in the location is as a result of monsoon wind popular in the months of April
to December and still wind occurs from June to October.
⊘ This is a preview!⊘
Do you want full access?
Subscribe today to unlock all pages.
Trusted by 1+ million students worldwide
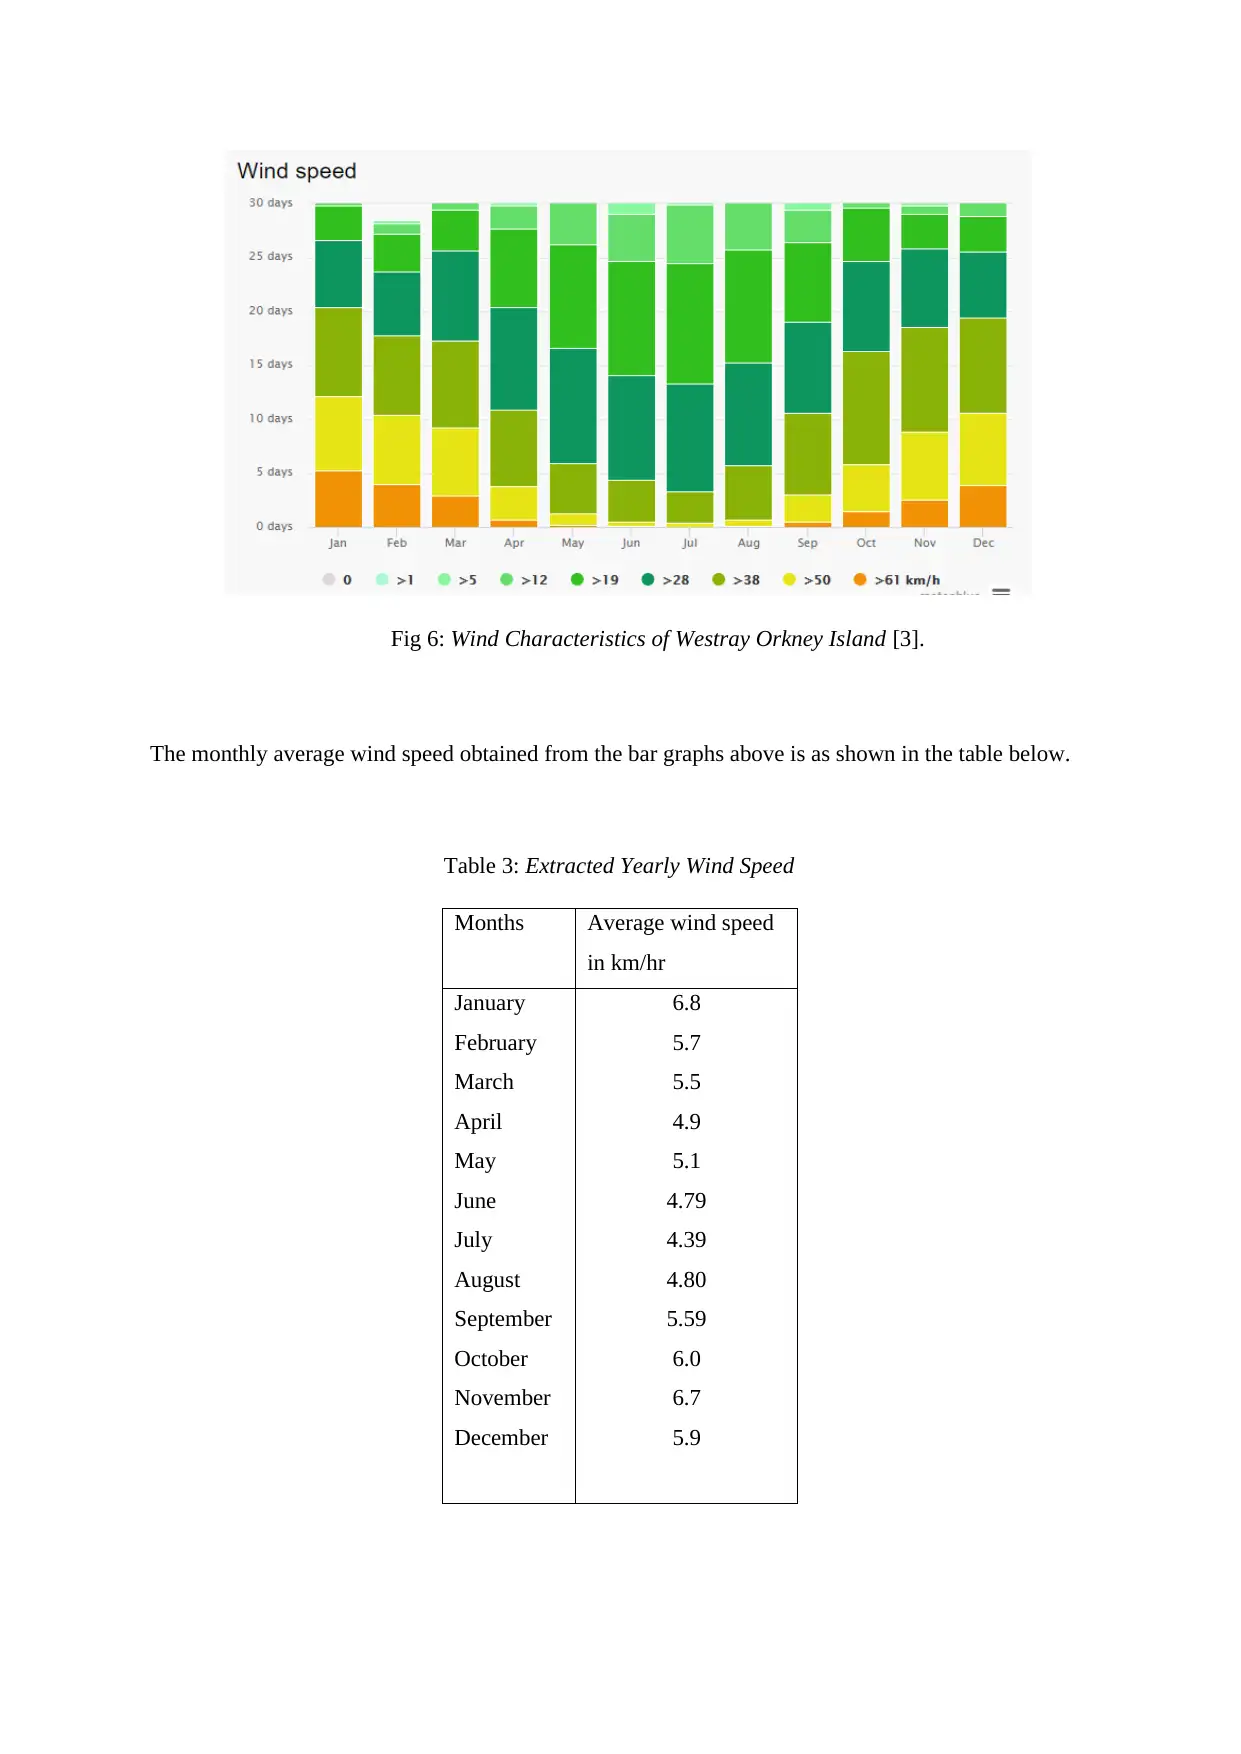
Fig 6: Wind Characteristics of Westray Orkney Island [3].
The monthly average wind speed obtained from the bar graphs above is as shown in the table below.
Table 3: Extracted Yearly Wind Speed
Months Average wind speed
in km/hr
January
February
March
April
May
June
July
August
September
October
November
December
6.8
5.7
5.5
4.9
5.1
4.79
4.39
4.80
5.59
6.0
6.7
5.9
Paraphrase This Document
Need a fresh take? Get an instant paraphrase of this document with our AI Paraphraser

Velocities of wind in Westray Orkney Island shows a strong correlation trend. Seemingly not
adversely affected, there is availability of wind throughout the year.
Wind energy is utilized either directly by the load connected to the grid and excess energy is used to
charge the battery storage system. Wind energy in this micro-grid design is under the category of
primary electricity generating unit such that at any point of time, is supplies electricity into the grid.
Renewable energy comes in unsteady form thus requires voltage limiter and inverter when interfacing
to the micro-grid. It is converted to DC voltage first and a uniform rectified version is fed into the
grid.
Wind rose was of the place was also analyzed, guiding us through graphical representation of the
distribution and direction of wind with velocity of the location. The representation can be used to
analyze wind phenomenon trend in Westray Orkney region where the Balfour hospital is located. The
figure below shows wind rose of the location as retrieved from meteorological data.
Fig 7: Wind rose of Westray Orkney [3].

Total days of wind flowing in the same direction for the location of turbine installation can be
calculated from the wind rose. By doing so, it becomes easy to determine wind turbine orientation and
height of elevation from the ground.
The average power demand in the hospital was calculated as 400kWh/days. Wind energy is required
to compensate 70% of the total demand since it is in plenty as compared to the solar energy. The
landscape of the installation location is strategically position to enable maximum extraction of wind
power from the monsoon wind.
Average daily wind power=70 % ×400 kWh=280 kWh
Wind turbine generator of 60 kW was preferred for this application. General power efficiency (Cp)
of the wind turbine system is a function of ratio of upstream wind speed to downstream wind speed.
This wind turbine averagely costs 20,130$.
The installation ground of wind turbine towers was located behind the left wing building of the
hospital. Velocity of wind at the selected location was recorded the highest average speed with no
obstructions. Tower’s height ideal to capture enough power from the upstream wind was found to be 4
meters.
Feasibility study of the diesel generator.
The AC generator for this design has the capacity to handle total load demand when there is no supply
from battery banks and primary sources of energy. The diesel generator should therefore be rated as
60kW. The initial purchase cost of the generator is 40,440and replacement cost is 30,000$. The
operation and maintenance cost of the generator is 5000$. It is has a life expectance of 20000
operating hours and it consumes $10,000 per year. The generator comes into operation when the load
demand exceed the power generated by primary sources of energy.
SYSTEM DESIGN
The system was modelled and circuit diagram drawn using PSIM software as shown below.
⊘ This is a preview!⊘
Do you want full access?
Subscribe today to unlock all pages.
Trusted by 1+ million students worldwide
1 out of 26
Related Documents


Your All-in-One AI-Powered Toolkit for Academic Success.
+13062052269
info@desklib.com
Available 24*7 on WhatsApp / Email
![[object Object]](/_next/static/media/star-bottom.7253800d.svg)
Unlock your academic potential
Copyright © 2020–2026 A2Z Services. All Rights Reserved. Developed and managed by ZUCOL.