Aviation Management: Impact of Clean Air Act on Pollutant Levels

Verified

Added on  2023/05/29

|8
|1159
|375
Report
AI Summary
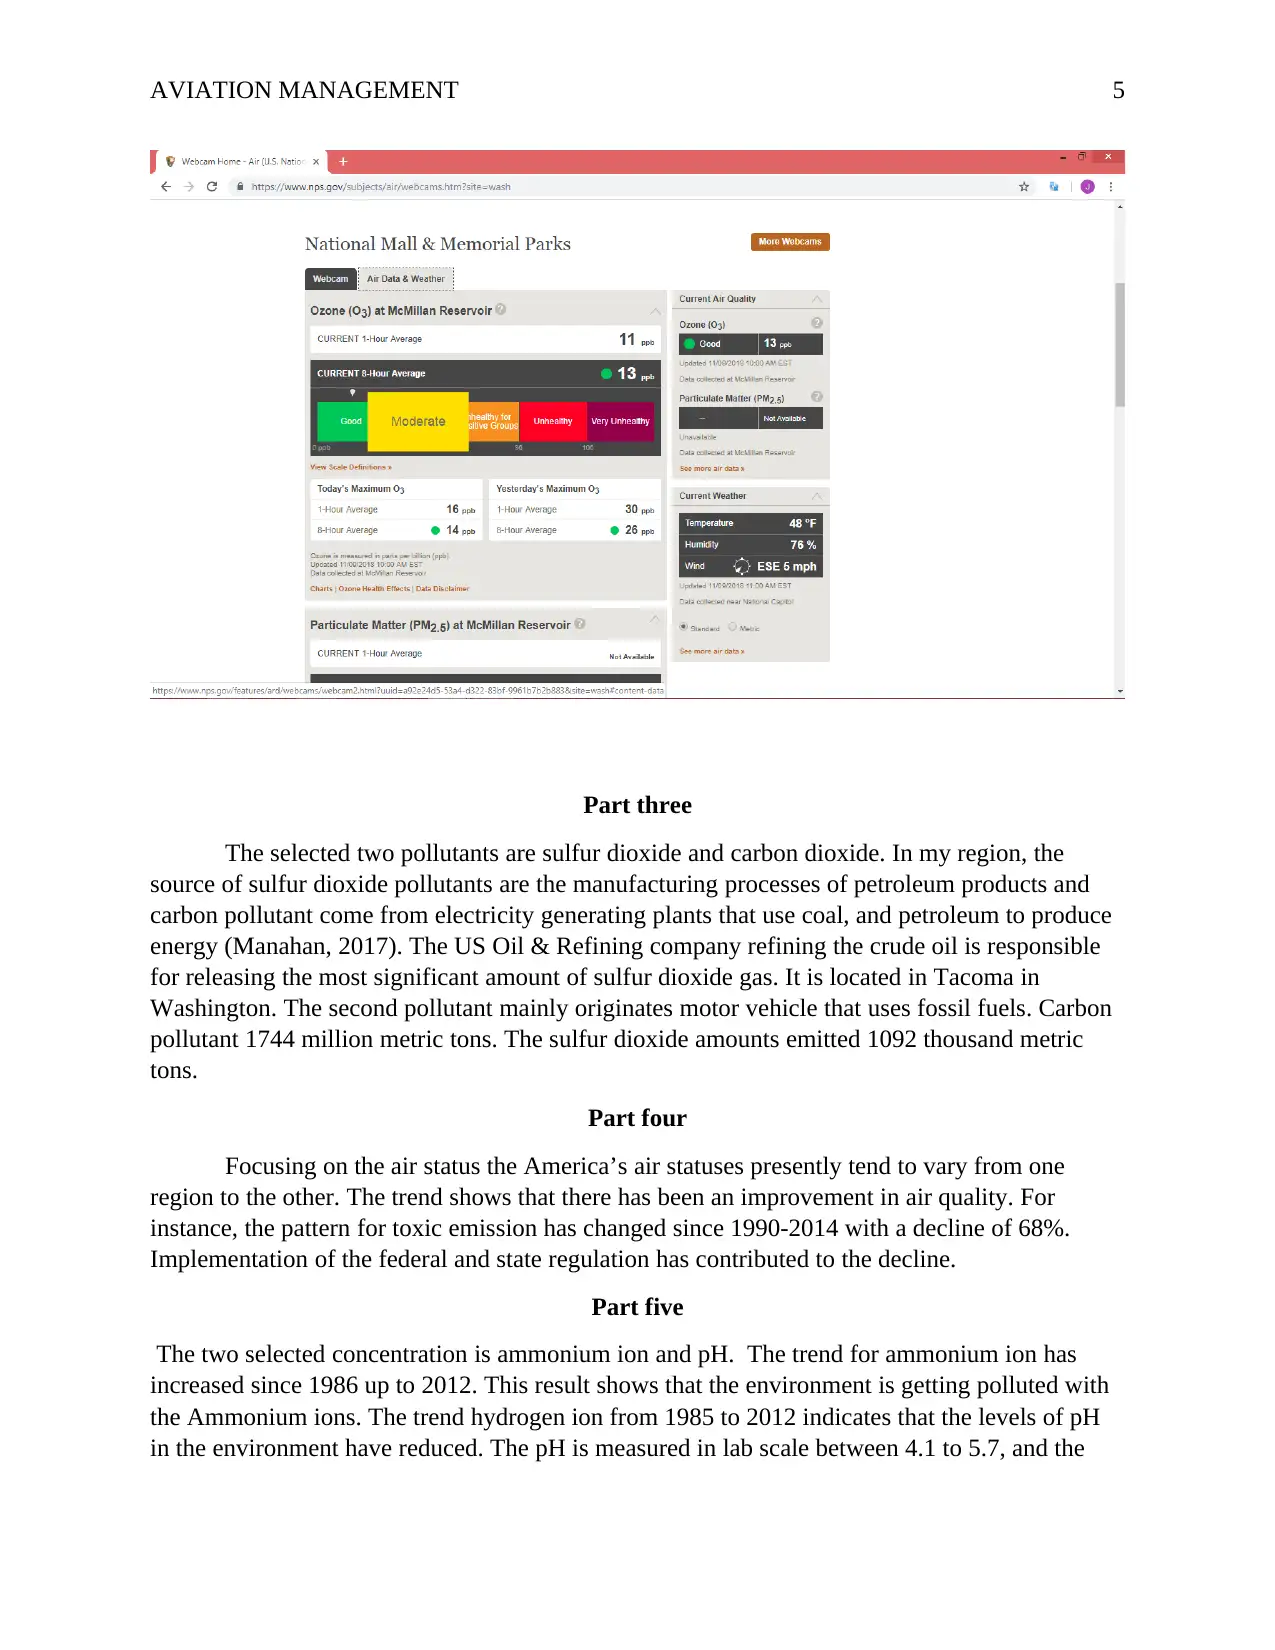
This aviation management report provides an overview of the Clean Air Act and its impact on air quality, focusing on criteria pollutants such as ozone, sulfur dioxide, lead, carbon monoxide, nitrogen dioxide, and particulate matter. The report identifies sources of sulfur dioxide and carbon pollutants in the author's region, highlighting specific companies and motor vehicles as major contributors. It assesses current air quality in various locations, including New York City, and examines trends in toxic emissions, ammonium ion concentrations, and pH levels. The analysis indicates improvements in air quality due to federal and state regulations, while also noting increasing ammonium ion levels and stabilizing pH levels in previously acidic regions. Desklib offers more solved assignments and study resources for students.
Document Page
Running Head: AVIATION MANAGEMENT 1
Aviation Management
Student Name
Institution Affiliations
Date
tabler-icon-diamond-filled.svg

Paraphrase This Document

Need a fresh take? Get an instant paraphrase of this document with our AI Paraphraser
Document Page
AVIATION MANAGEMENT 2
Part one Summary
In 1970, the Congress established the basic framework of the “Clean air act.” In 1977 and
1990 some section of the act got revised (United State Environmental Protection Agency, n.d).
According to United State Environmental Protection Agency (n.d), revisions that followed were
as a result of the need to improve the effectiveness and the focus to solve the then newly
identified environmental problems such as the occurrence of acid rains and the ruined
stratosphere or the deteriorated O-zone layer.
According “America’s Children and the Environment“ (2015), there are six critical
environmental pollutants known as the “criteria pollutant.” Criteria pollutants includes: Ozone,
Sulfur dioxide, lead, Carbon monoxide, nitrogen dioxide, and the particulate matter or particle
found in the air. According to “Idaho Department of Environmental Quality” (n.d), these
pollutants can get sourced from various points. Lead, is found naturally occurring on the earth
surface, also from manufactured goods (Manahan, 2017). Carbon monoxide source is from the
burning of coal or charcoal in an inadequately ventilated room. Manahan, (2017) argues that
ozone gas comes from the atmosphere when a three-atom molecule made of Oxygen. The
Nitrogen dioxide emanates from burning of fossil fuel. Sulfur dioxide comes from burning or the
processing of sulfur, from fossil fuels, metal smelting and coal burning (Manahan, 2017).
Particulate matter comes from dust, fogs and smoke from industries (Chang et.al 2016).
The emerging issues that the law targeted to address emanated from the hazardous or
highly toxic contaminant to the air. Such pollutant includes the carcinogenic compounds and
heavy metals. The issue of acidic rains that adversely affected the aquatic ecosystem, corroded
forest covers, and other properties (Percival et.al, 2017). The laws also aimed at regulating the
chemical emission as fumes reached the stratosphere and depleted the Ozone layer. Lastly, the
Document Page
AVIATION MANAGEMENT 3
rules were targeted to address the effects of regional haze characterized by blurred vision in the
recreational places and conservation parks.
The selected two pollutants are sulfur dioxide and carbon dioxide. In my region, the
source of sulfur dioxide pollutants are the manufacturing processes of petroleum products and
carbon pollutant come from electricity generating plants that use coal, and petroleum to produce
energy. The US Oil & Refining company refining the crude oil is responsible for releasing the
most significant amount of sulfur dioxide gas. It is located in Tacoma in Washington. The
second pollutants mainly originate from motor vehicle that uses fossil fuels. Carbon pollutant
1744 million metric tons. The sulfur dioxide amounts emitted 1092 thousand metric tons.
Part two
According to the AirNow website under the legend tab, the current air quality falls under
Ozone, PM 2.5, and PM 10 scales. In this case, regions such as Bend-pump station, the Ukiah
Library, Oakland west region, another area Downtown Sacramento-T Street and San Pablo-
Rumrill region. The current status in Seattle regions is evaluated green, and some part is yellow.
Therefore, my residence place is healthy for a living unless for extremely sensitive cases. In the
future, I would like to work and stay in New York City. The current situation at New York city
indicates a healthy air quality. For instance, the air condition at the Upper Hudson Valley area in
New-York city, the weather records a PM2.5 value of 33 thus good quality. Focusting the air
conditions of New York City, the status displays green color that translates into healthy or
excellent quality of air in the region.
Document Page
AVIATION MANAGEMENT 4
Figure 1
tabler-icon-diamond-filled.svg

Paraphrase This Document

Need a fresh take? Get an instant paraphrase of this document with our AI Paraphraser
Document Page
AVIATION MANAGEMENT 5
Part three
The selected two pollutants are sulfur dioxide and carbon dioxide. In my region, the
source of sulfur dioxide pollutants are the manufacturing processes of petroleum products and
carbon pollutant come from electricity generating plants that use coal, and petroleum to produce
energy (Manahan, 2017). The US Oil & Refining company refining the crude oil is responsible
for releasing the most significant amount of sulfur dioxide gas. It is located in Tacoma in
Washington. The second pollutant mainly originates motor vehicle that uses fossil fuels. Carbon
pollutant 1744 million metric tons. The sulfur dioxide amounts emitted 1092 thousand metric
tons.
Part four
Focusing on the air status the America’s air statuses presently tend to vary from one
region to the other. The trend shows that there has been an improvement in air quality. For
instance, the pattern for toxic emission has changed since 1990-2014 with a decline of 68%.
Implementation of the federal and state regulation has contributed to the decline.
Part five
The two selected concentration is ammonium ion and pH. The trend for ammonium ion has
increased since 1986 up to 2012. This result shows that the environment is getting polluted with
the Ammonium ions. The trend hydrogen ion from 1985 to 2012 indicates that the levels of pH
in the environment have reduced. The pH is measured in lab scale between 4.1 to 5.7, and the
Document Page
AVIATION MANAGEMENT 6
result shows that the regions which had the very acidic condition are stabilizing and approaching
neutral levels.
Document Page
AVIATION MANAGEMENT 7
References
America’s Children and the Environment(Ed), (2015). Criteria air pollutants. Retrieved from
https://scholar.google.com/scholar?hl=en&as_sdt=0%2C5&as_ylo=2014&q=https%3A
%2F%2Fwww.epa.gov%2Fsites%2Fproduction%2Ffiles%2F2015-10%2Fdocuments
%2Face3_criteria_air_pollutants.pdf&btnG=
Chang, T., Graff Zivin, J., Gross, T., & Neidell, M. (2016). Particulate pollution and the
productivity of pear packers. American Economic Journal: Economic Policy, 8(3), 141-
69.
Idaho Department of Environmental Quality (n.d.). Retrieved from
http://www.deq.idaho.gov/air-quality/air-pollutants/criteria-pollutants/
Manahan, S. (2017). Environmental chemistry. CRC press.
Percival, R. V., Schroeder, C. H., Miller, A. S., & Leape, J. P. (2017). Environmental regulation:
Law, science, and policy. Wolters Kluwer Law & Business.
United State Environmental Protection Agency EPA, (n.d.) Clean air requirements and history.
Retrieved from https://www.epa.gov/clean-air-act-overview/clean-air-act-requirements-
and-history
tabler-icon-diamond-filled.svg

Paraphrase This Document

Need a fresh take? Get an instant paraphrase of this document with our AI Paraphraser
Document Page
AVIATION MANAGEMENT 8
chevron_up_icon
1 out of 8
circle_padding
hide_on_mobile
zoom_out_icon
[object Object]