E-Booking Alert Smart App: Project for Aviation Industry
VerifiedAdded on 2023/06/07
|11
|2105
|269
Project
AI Summary
This project focuses on the development of an E-Booking Alert Smart App, designed to address the problem of overbooking in the aviation and hospitality industries, specifically within the UAE. The app aims to serve both customers and airlines, with a primary focus on the UAE aviation sector, including major airlines like Etihad and Emirates. The project includes a market analysis, competitive context, startup capital and expenses, and detailed financial projections over a five-year period. The financial plan encompasses profit and loss statements, balance sheets, and cash flow projections, along with a break-even analysis, demonstrating the app's potential in the UAE market, which is a part of an 80 billion dollar industry. The project also considers key assumptions, including revenue, cost of goods sold, and operational expenses, to assess the financial viability of the E-Booking Alert Smart App.

E-Booking Alert Smart
App NAME OF THE CLASS
NAME(S) OF THE STUDENT
NAME OF THE UNIVERSITY
ADSM STUDENT ID NUMBERS
App NAME OF THE CLASS
NAME(S) OF THE STUDENT
NAME OF THE UNIVERSITY
ADSM STUDENT ID NUMBERS
Paraphrase This Document
Need a fresh take? Get an instant paraphrase of this document with our AI Paraphraser
Summary
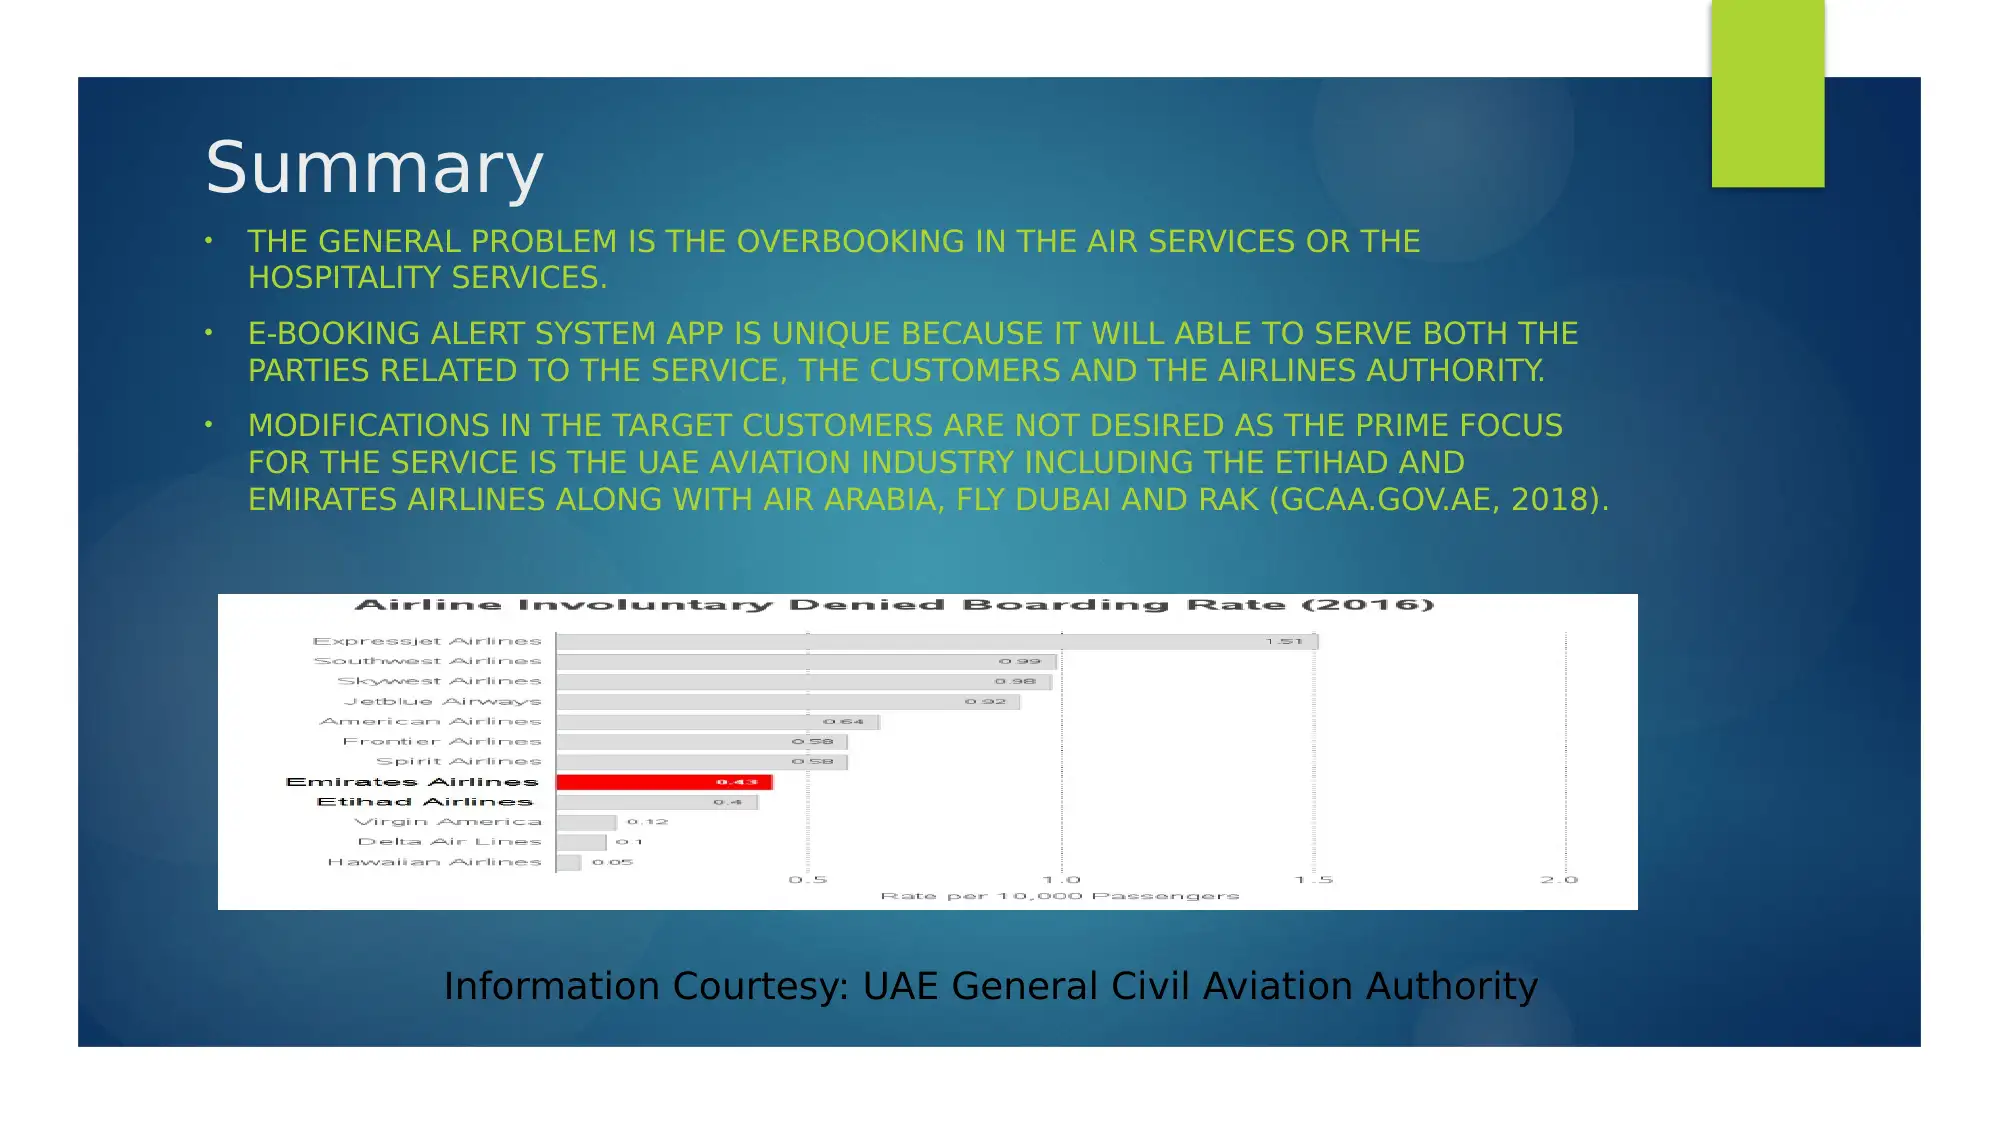
• THE GENERAL PROBLEM IS THE OVERBOOKING IN THE AIR SERVICES OR THE
HOSPITALITY SERVICES.
• E-BOOKING ALERT SYSTEM APP IS UNIQUE BECAUSE IT WILL ABLE TO SERVE BOTH THE
PARTIES RELATED TO THE SERVICE, THE CUSTOMERS AND THE AIRLINES AUTHORITY.
• MODIFICATIONS IN THE TARGET CUSTOMERS ARE NOT DESIRED AS THE PRIME FOCUS
FOR THE SERVICE IS THE UAE AVIATION INDUSTRY INCLUDING THE ETIHAD AND
EMIRATES AIRLINES ALONG WITH AIR ARABIA, FLY DUBAI AND RAK (GCAA.GOV.AE, 2018).
Information Courtesy: UAE General Civil Aviation Authority
Summary(Continued)
• THE GENERAL END USERS WILL BE THE PEOPLE OF UAE
• AS THE APPLICATION IS SOFTWARE BASED, THE AVAILABILITY OF THE
ORGANIZATIONS PROGRAMMING THESE SORT OF APPLICATION WILL
BE IMMENSE AND THE PRODUCT WILL FACE CONSIDERABLE MARKET
COMPETITION.
• THE AIR DENIAL RATES SIGNIFICANTLY DESCRIBES THE IMPACT OF THE
OVERBOOKING ISSUE ON THE SERVICE OF THE AIRLINE INDUSTRY.
• THE PRODUCT WILL GET CONSIDERABLE AMOUNT OF MARKET
LIMELIGHT UNDER THE MENTIONED CIRCUMSTANCES IN UAE.
• THE PRODUCT WILL BE A PART OF 80 BILLION US DOLLAR INDUSTRY
AND THE FACT THAT THE AMOUNT IS 15 PERCENT OF THE TOTAL GDP
OF UAE WILL MAKE SURE THAT THE PRODUCT HAS A SIGNIFICANT
MARKET IN UAE.
⊘ This is a preview!⊘
Do you want full access?
Subscribe today to unlock all pages.
Trusted by 1+ million students worldwide
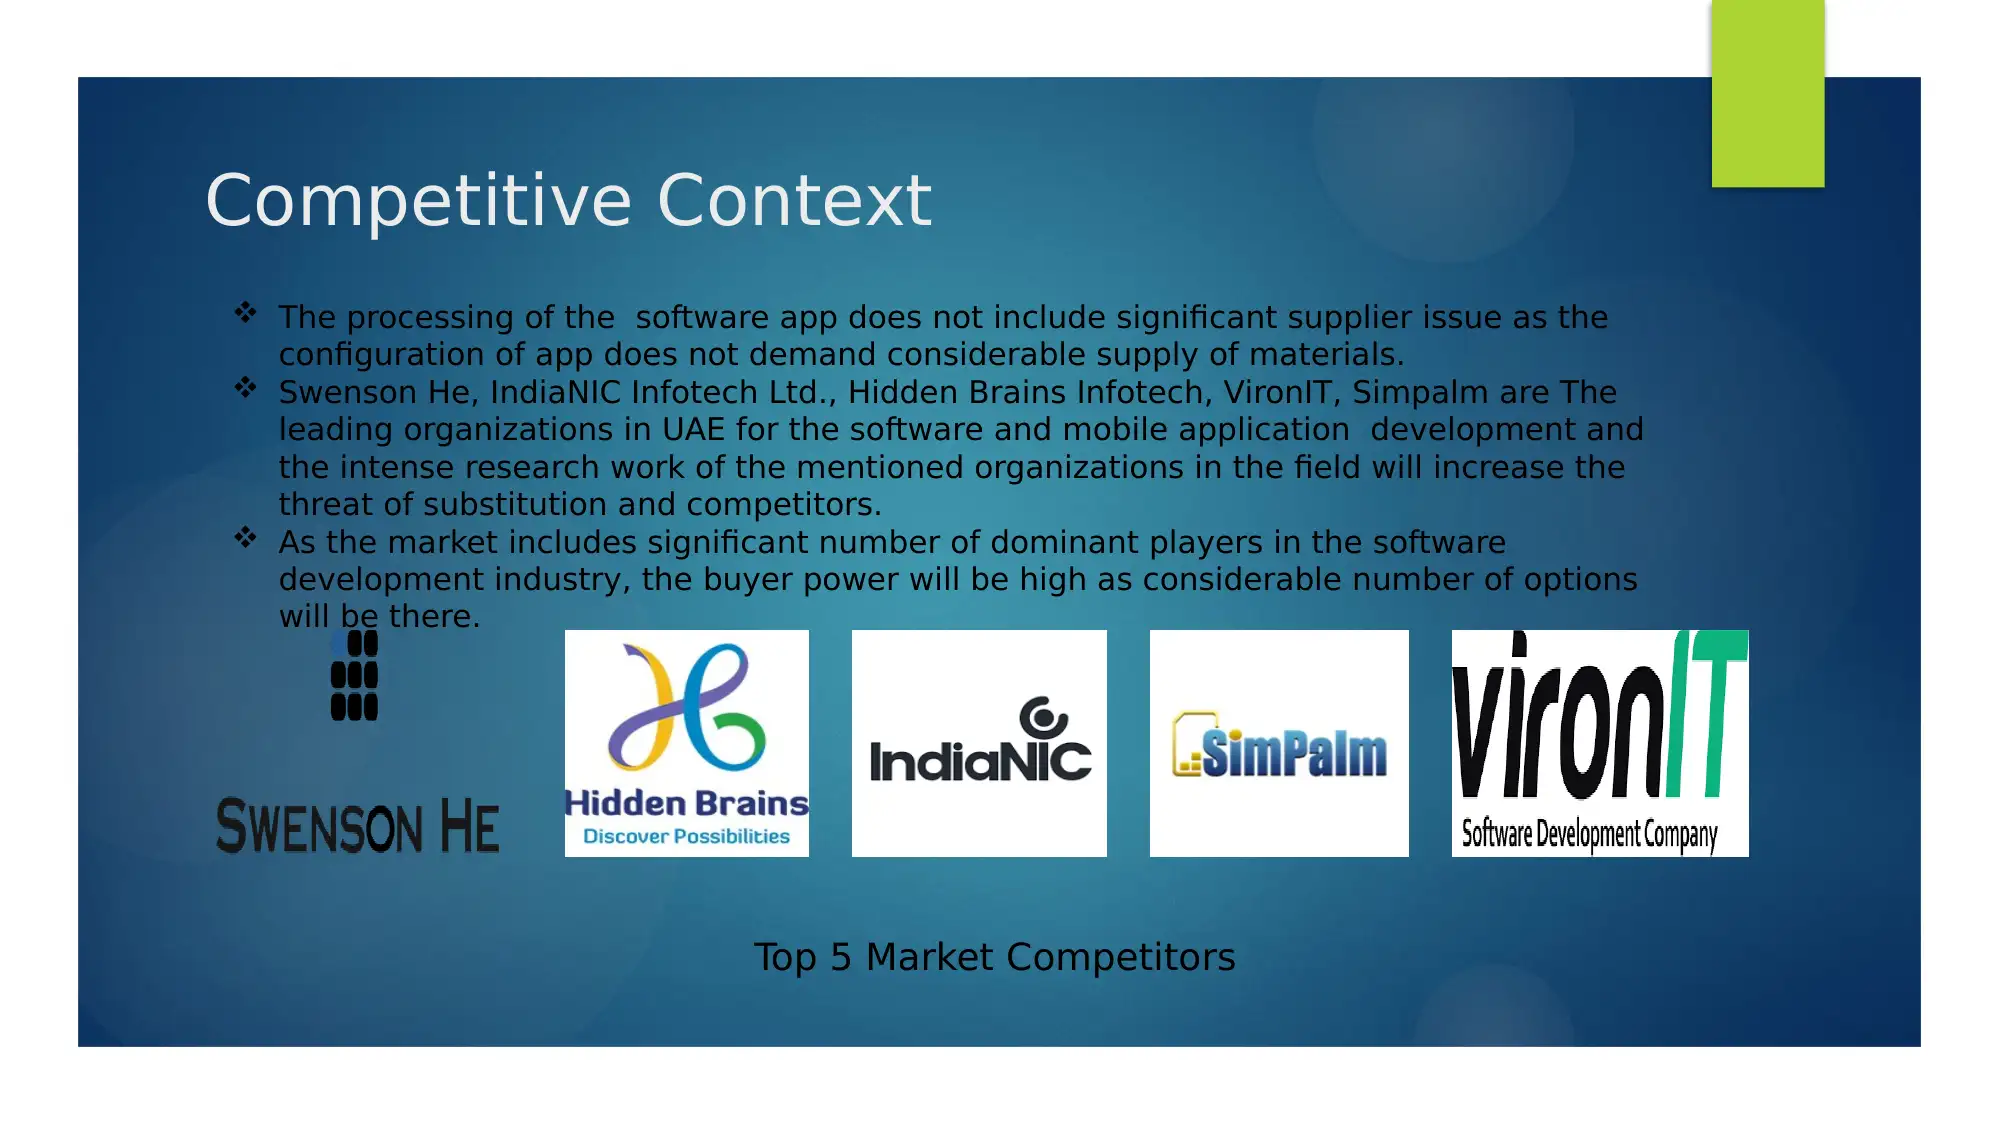
Competitive Context
The processing of the software app does not include significant supplier issue as the
configuration of app does not demand considerable supply of materials.
Swenson He, IndiaNIC Infotech Ltd., Hidden Brains Infotech, VironIT, Simpalm are The
leading organizations in UAE for the software and mobile application development and
the intense research work of the mentioned organizations in the field will increase the
threat of substitution and competitors.
As the market includes significant number of dominant players in the software
development industry, the buyer power will be high as considerable number of options
will be there.
Top 5 Market Competitors
Paraphrase This Document
Need a fresh take? Get an instant paraphrase of this document with our AI Paraphraser
Start up Capital and Expenses
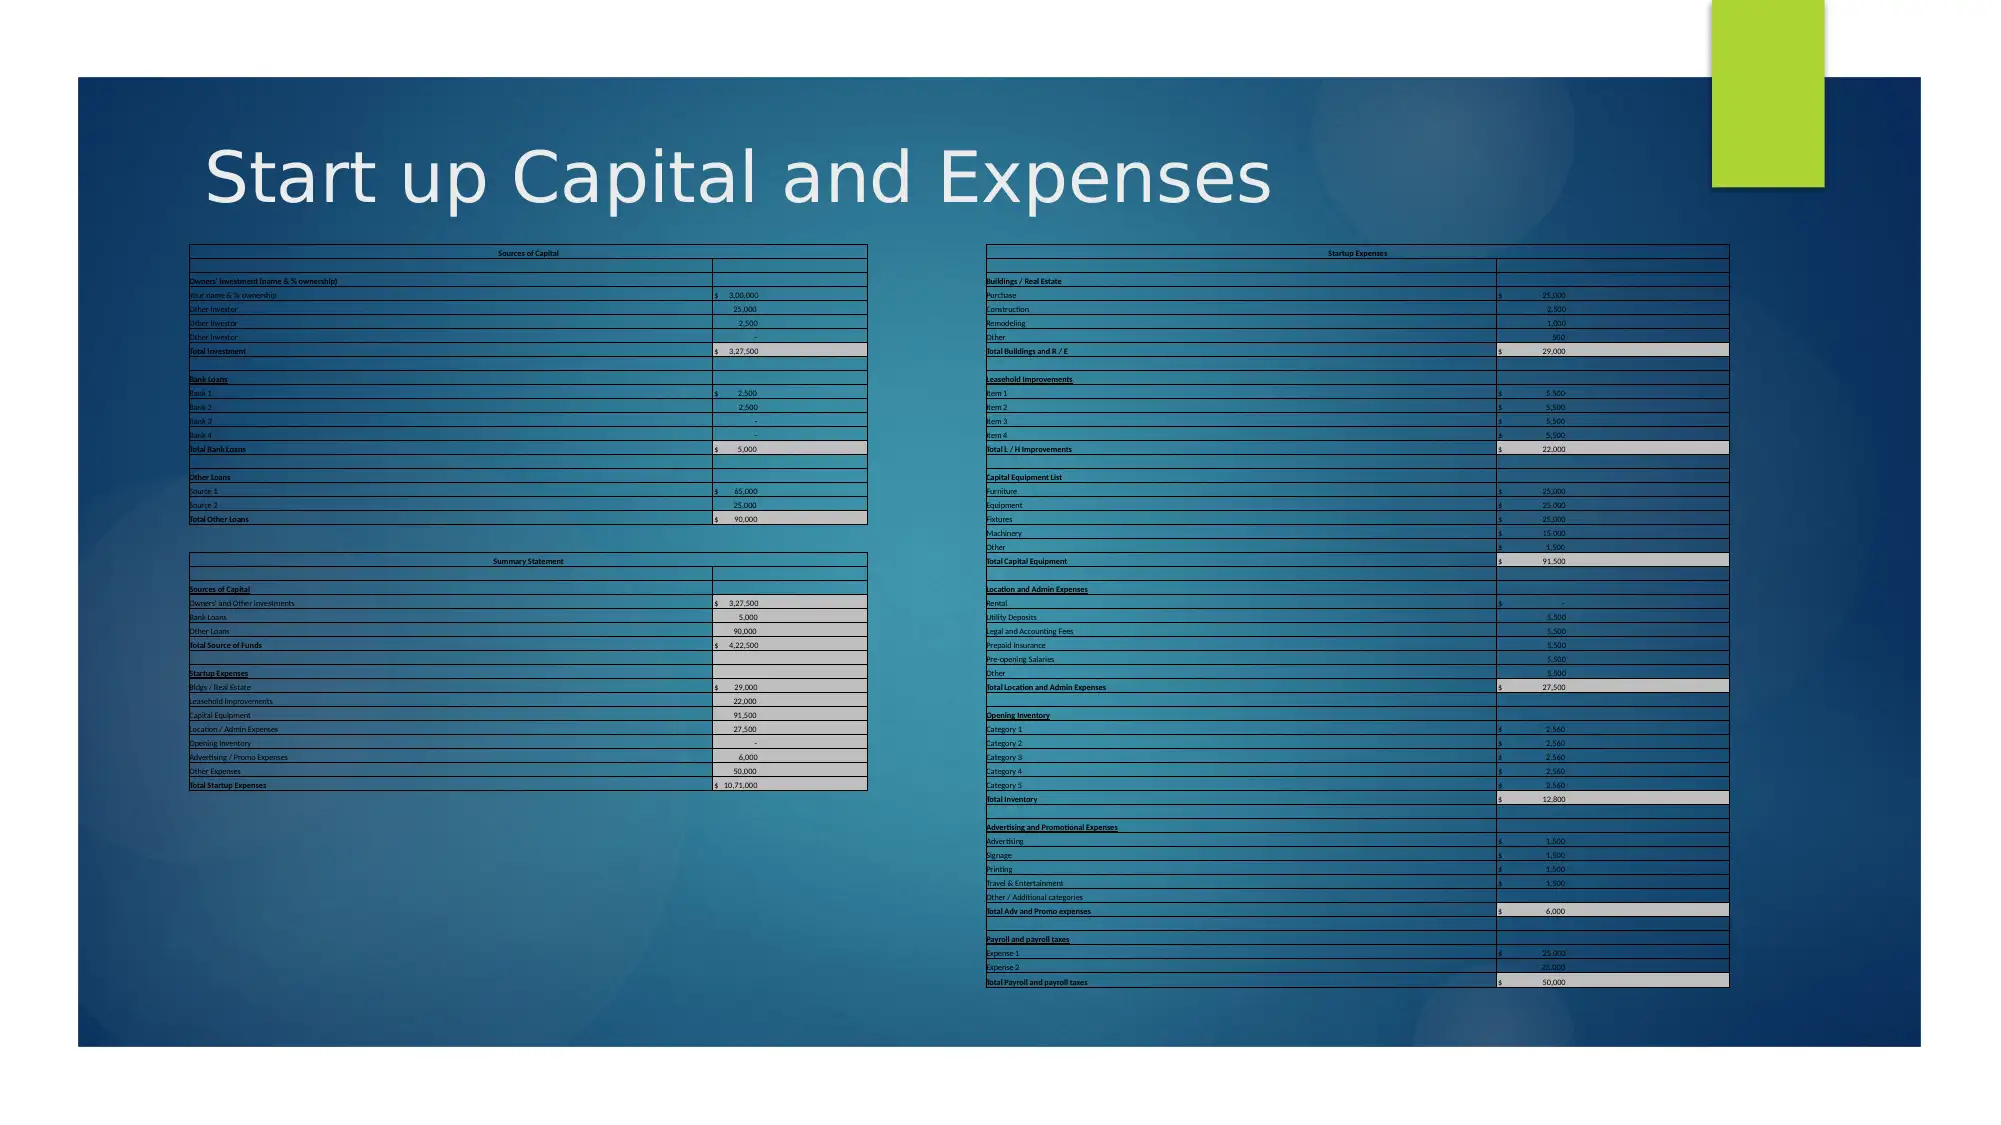
Sources of Capital Startup Expenses
Owners' Investment (name & % ownership) Buildings / Real Estate
Your name & % ownership $ 3,00,000 Purchase $ 25,000
Other Investor 25,000 Construction 2,500
Other Investor 2,500 Remodeling 1,000
Other Investor - Other 500
Total Investment $ 3,27,500 Total Buildings and R / E $ 29,000
Bank Loans Leasehold Improvements
Bank 1 $ 2,500 Item 1 $ 5,500
Bank 2 2,500 Item 2 $ 5,500
Bank 3 - Item 3 $ 5,500
Bank 4 - Item 4 $ 5,500
Total Bank Loans $ 5,000 Total L / H Improvements $ 22,000
Other Loans Capital Equipment List
Source 1 $ 65,000 Furniture $ 25,000
Source 2 25,000 Equipment $ 25,000
Total Other Loans $ 90,000 Fixtures $ 25,000
Machinery $ 15,000
Other $ 1,500
Summary Statement Total Capital Equipment $ 91,500
Sources of Capital Location and Admin Expenses
Owners' and Other Investments $ 3,27,500 Rental $ -
Bank Loans 5,000 Utility Deposits 5,500
Other Loans 90,000 Legal and Accounting Fees 5,500
Total Source of Funds $ 4,22,500 Prepaid Insurance 5,500
Pre-opening Salaries 5,500
Startup Expenses Other 5,500
Bldgs / Real Estate $ 29,000 Total Location and Admin Expenses $ 27,500
Leasehold Improvements 22,000
Capital Equipment 91,500 Opening Inventory
Location / Admin Expenses 27,500 Category 1 $ 2,560
Opening Inventory - Category 2 $ 2,560
Advertising / Promo Expenses 6,000 Category 3 $ 2,560
Other Expenses 50,000 Category 4 $ 2,560
Total Startup Expenses $ 10,71,000 Category 5 $ 2,560
Total Inventory $ 12,800
Advertising and Promotional Expenses
Advertising $ 1,500
Signage $ 1,500
Printing $ 1,500
Travel & Entertainment $ 1,500
Other / Additional categories -
Total Adv and Promo expenses $ 6,000
Payroll and payroll taxes
Expense 1 $ 25,000
Expense 2 25,000
Total Payroll and payroll taxes $ 50,000
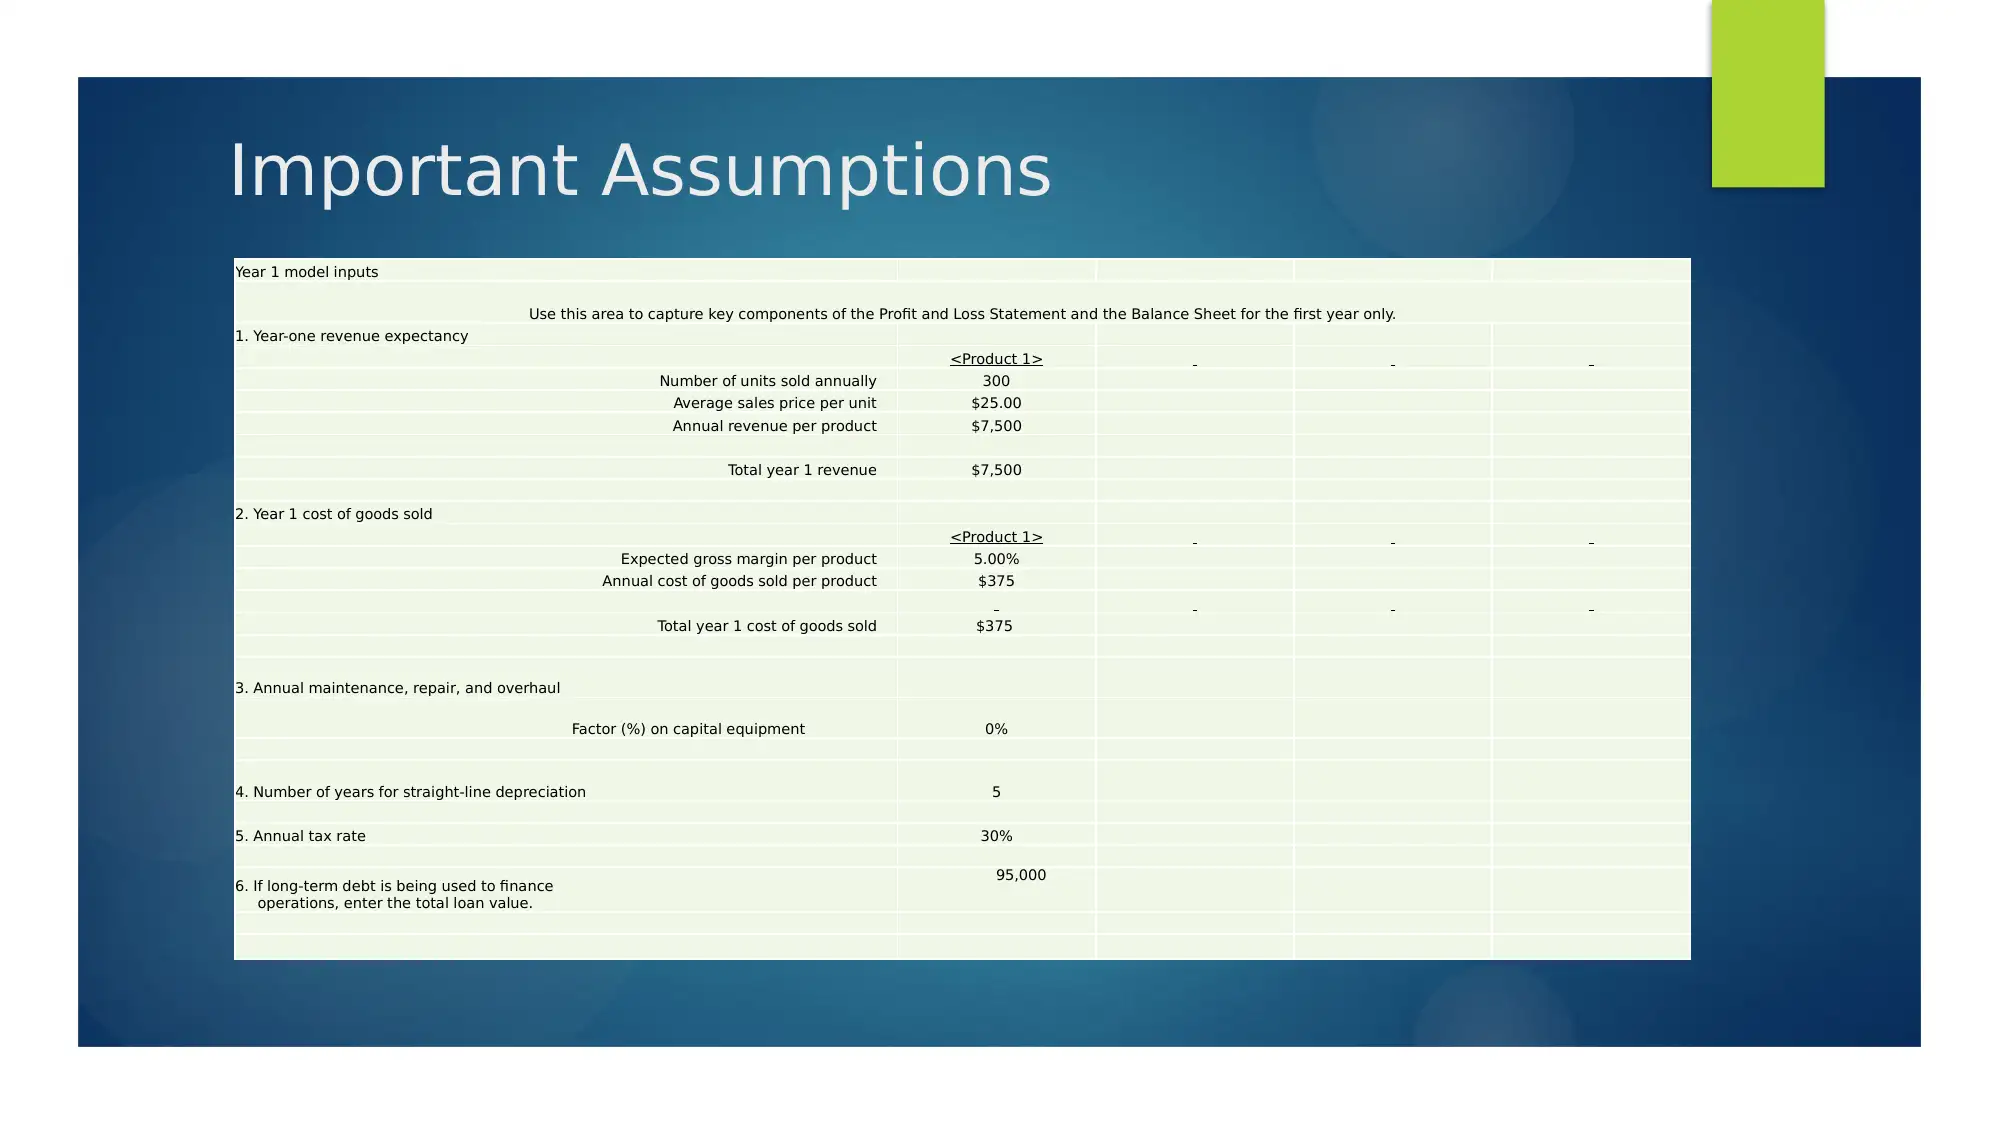
Important Assumptions
Year 1 model inputs
Use this area to capture key components of the Profit and Loss Statement and the Balance Sheet for the first year only.
1. Year-one revenue expectancy
<Product 1>
Number of units sold annually 300
Average sales price per unit $25.00
Annual revenue per product $7,500
Total year 1 revenue $7,500
2. Year 1 cost of goods sold
<Product 1>
Expected gross margin per product 5.00%
Annual cost of goods sold per product $375
Total year 1 cost of goods sold $375
3. Annual maintenance, repair, and overhaul
Factor (%) on capital equipment 0%
4. Number of years for straight-line depreciation 5
5. Annual tax rate 30%
6. If long-term debt is being used to finance
operations, enter the total loan value.
95,000
⊘ This is a preview!⊘
Do you want full access?
Subscribe today to unlock all pages.
Trusted by 1+ million students worldwide
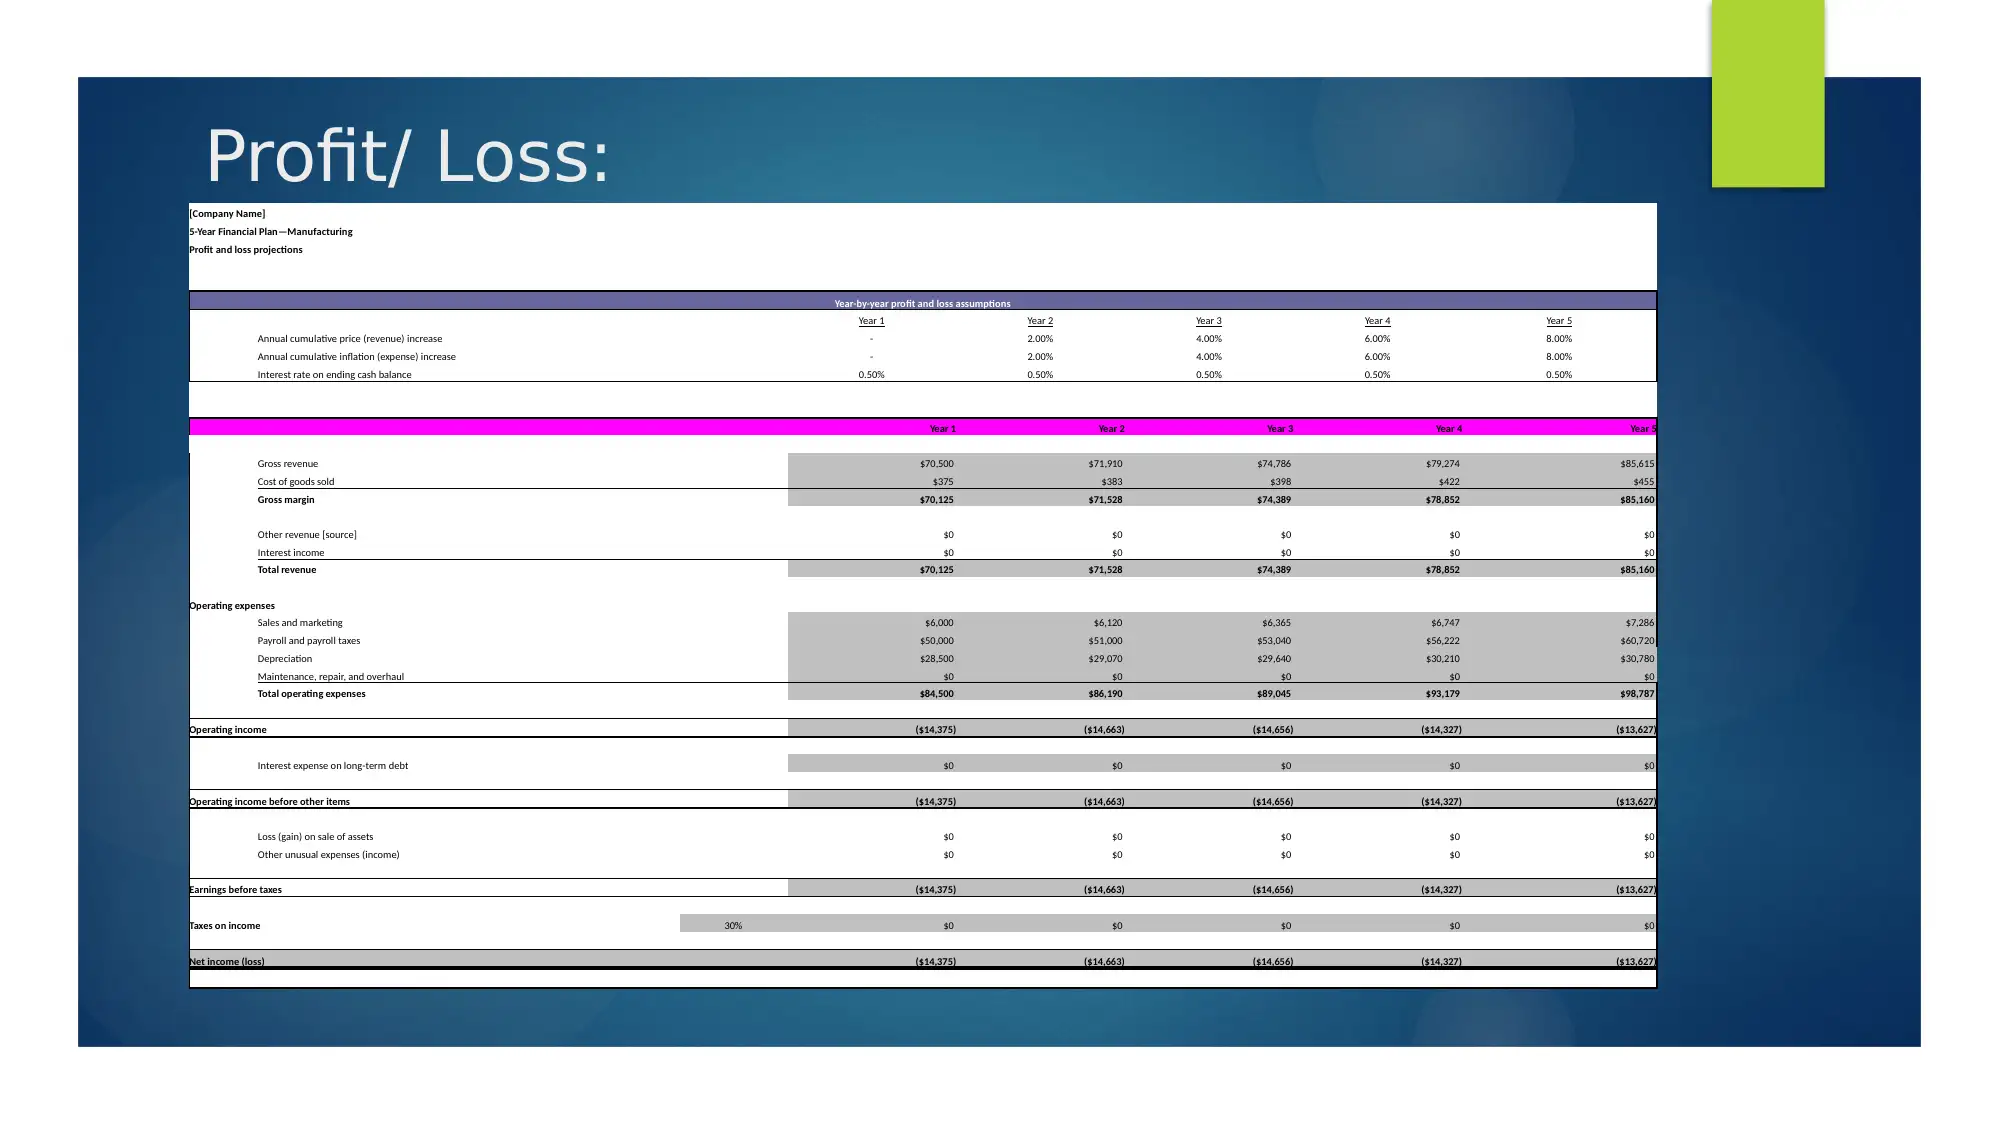
Profit/ Loss:
[Company Name]
5-Year Financial Plan—Manufacturing
Profit and loss projections
Year-by-year profit and loss assumptions
Year 1 Year 2 Year 3 Year 4 Year 5
Annual cumulative price (revenue) increase - 2.00% 4.00% 6.00% 8.00%
Annual cumulative inflation (expense) increase - 2.00% 4.00% 6.00% 8.00%
Interest rate on ending cash balance 0.50% 0.50% 0.50% 0.50% 0.50%
Year 1 Year 2 Year 3 Year 4 Year 5
Gross revenue $70,500 $71,910 $74,786 $79,274 $85,615
Cost of goods sold $375 $383 $398 $422 $455
Gross margin $70,125 $71,528 $74,389 $78,852 $85,160
Other revenue [source] $0 $0 $0 $0 $0
Interest income $0 $0 $0 $0 $0
Total revenue $70,125 $71,528 $74,389 $78,852 $85,160
Operating expenses
Sales and marketing $6,000 $6,120 $6,365 $6,747 $7,286
Payroll and payroll taxes $50,000 $51,000 $53,040 $56,222 $60,720
Depreciation $28,500 $29,070 $29,640 $30,210 $30,780
Maintenance, repair, and overhaul $0 $0 $0 $0 $0
Total operating expenses $84,500 $86,190 $89,045 $93,179 $98,787
Operating income ($14,375) ($14,663) ($14,656) ($14,327) ($13,627)
Interest expense on long-term debt $0 $0 $0 $0 $0
Operating income before other items ($14,375) ($14,663) ($14,656) ($14,327) ($13,627)
Loss (gain) on sale of assets $0 $0 $0 $0 $0
Other unusual expenses (income) $0 $0 $0 $0 $0
Earnings before taxes ($14,375) ($14,663) ($14,656) ($14,327) ($13,627)
Taxes on income 30% $0 $0 $0 $0 $0
Net income (loss) ($14,375) ($14,663) ($14,656) ($14,327) ($13,627)
Paraphrase This Document
Need a fresh take? Get an instant paraphrase of this document with our AI Paraphraser
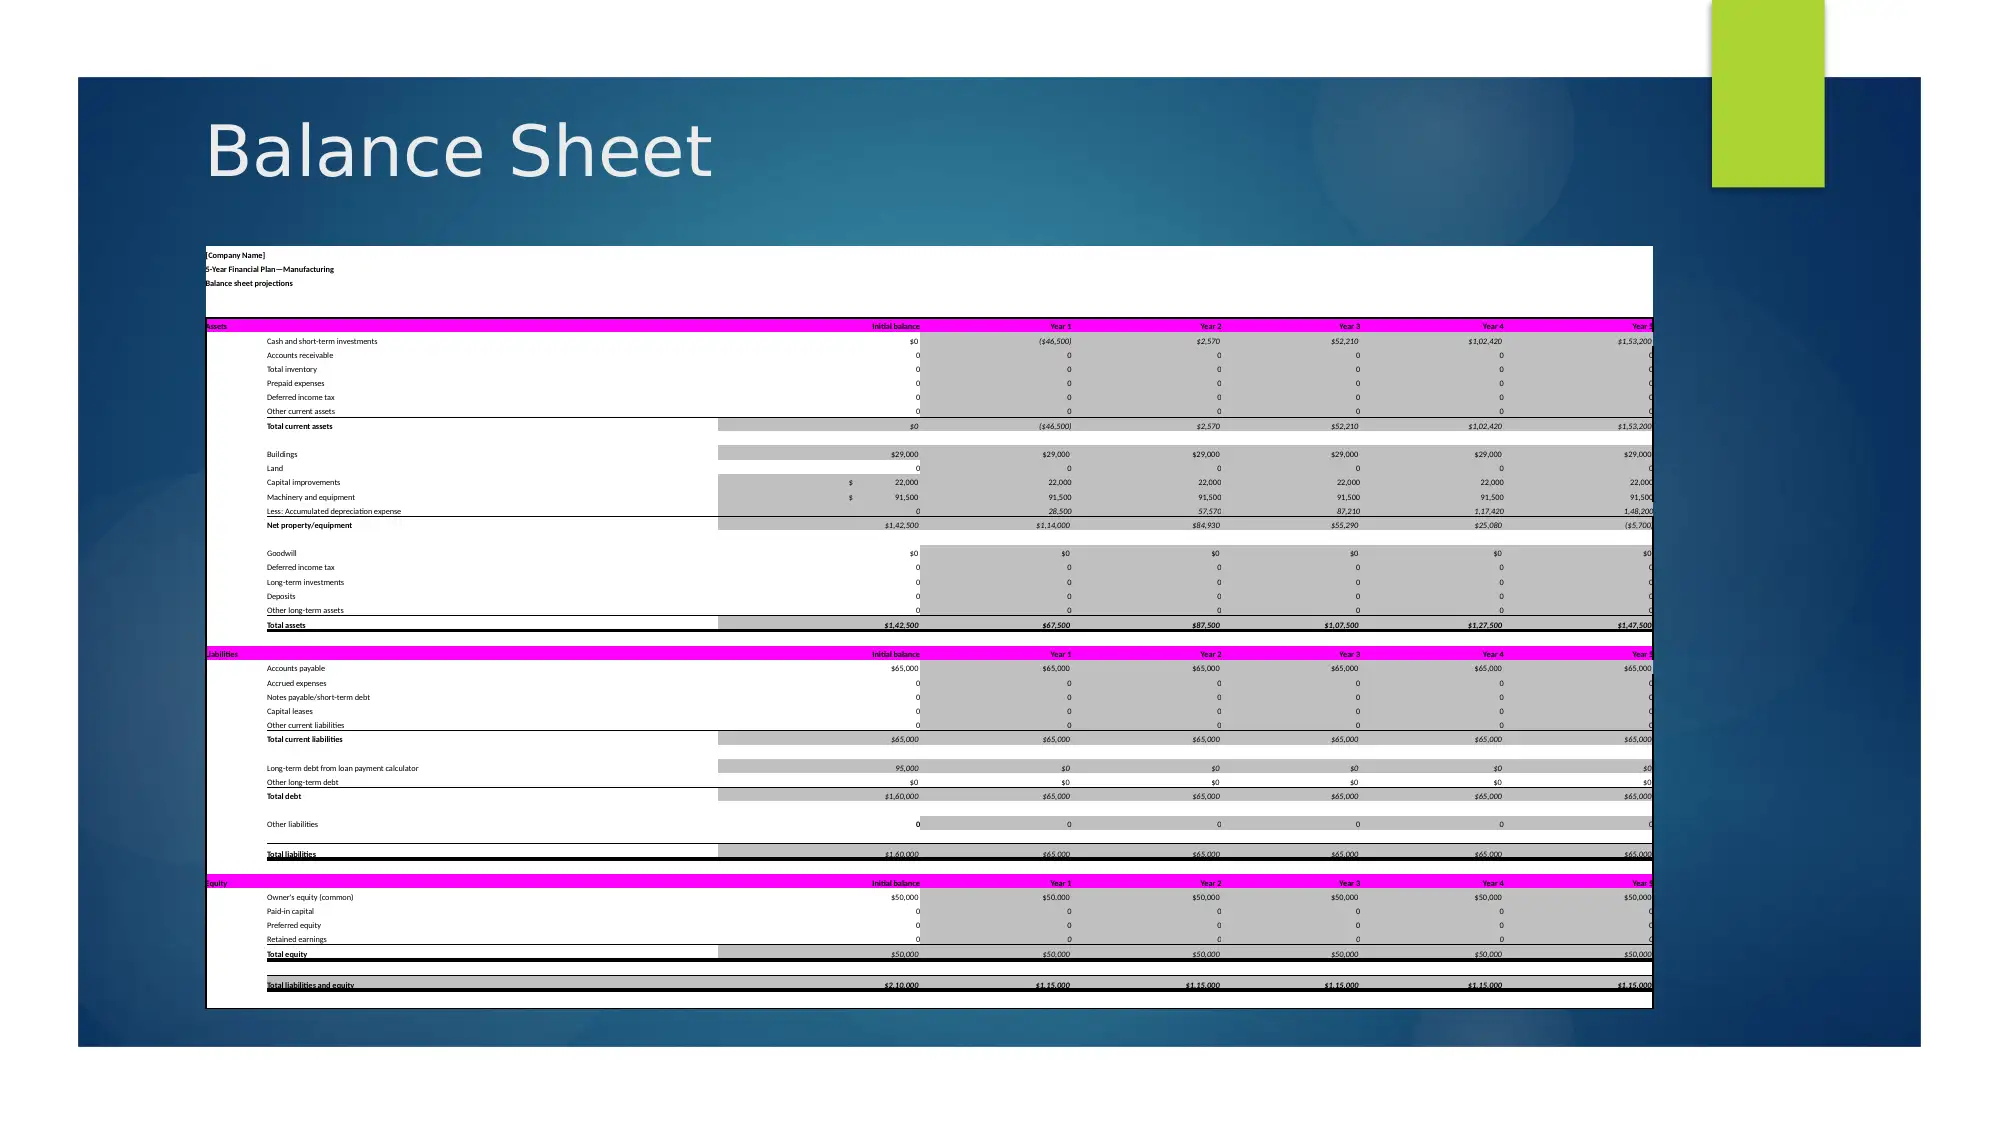
Balance Sheet
[Company Name]
5-Year Financial Plan—Manufacturing
Balance sheet projections
Assets Initial balance Year 1 Year 2 Year 3 Year 4 Year 5
Cash and short-term investments $0 ($46,500) $2,570 $52,210 $1,02,420 $1,53,200
Accounts receivable 0 0 0 0 0 0
Total inventory 0 0 0 0 0 0
Prepaid expenses 0 0 0 0 0 0
Deferred income tax 0 0 0 0 0 0
Other current assets 0 0 0 0 0 0
Total current assets $0 ($46,500) $2,570 $52,210 $1,02,420 $1,53,200
Buildings $29,000 $29,000 $29,000 $29,000 $29,000 $29,000
Land 0 0 0 0 0 0
Capital improvements $ 22,000 22,000 22,000 22,000 22,000 22,000
Machinery and equipment $ 91,500 91,500 91,500 91,500 91,500 91,500
Less: Accumulated depreciation expense 0 28,500 57,570 87,210 1,17,420 1,48,200
Net property/equipment $1,42,500 $1,14,000 $84,930 $55,290 $25,080 ($5,700)
Goodwill $0 $0 $0 $0 $0 $0
Deferred income tax 0 0 0 0 0 0
Long-term investments 0 0 0 0 0 0
Deposits 0 0 0 0 0 0
Other long-term assets 0 0 0 0 0 0
Total assets $1,42,500 $67,500 $87,500 $1,07,500 $1,27,500 $1,47,500
Liabilities Initial balance Year 1 Year 2 Year 3 Year 4 Year 5
Accounts payable $65,000 $65,000 $65,000 $65,000 $65,000 $65,000
Accrued expenses 0 0 0 0 0 0
Notes payable/short-term debt 0 0 0 0 0 0
Capital leases 0 0 0 0 0 0
Other current liabilities 0 0 0 0 0 0
Total current liabilities $65,000 $65,000 $65,000 $65,000 $65,000 $65,000
Long-term debt from loan payment calculator 95,000 $0 $0 $0 $0 $0
Other long-term debt $0 $0 $0 $0 $0 $0
Total debt $1,60,000 $65,000 $65,000 $65,000 $65,000 $65,000
Other liabilities 0 0 0 0 0 0
Total liabilities $1,60,000 $65,000 $65,000 $65,000 $65,000 $65,000
Equity Initial balance Year 1 Year 2 Year 3 Year 4 Year 5
Owner's equity (common) $50,000 $50,000 $50,000 $50,000 $50,000 $50,000
Paid-in capital 0 0 0 0 0 0
Preferred equity 0 0 0 0 0 0
Retained earnings 0 0 0 0 0 0
Total equity $50,000 $50,000 $50,000 $50,000 $50,000 $50,000
Total liabilities and equity $2,10,000 $1,15,000 $1,15,000 $1,15,000 $1,15,000 $1,15,000
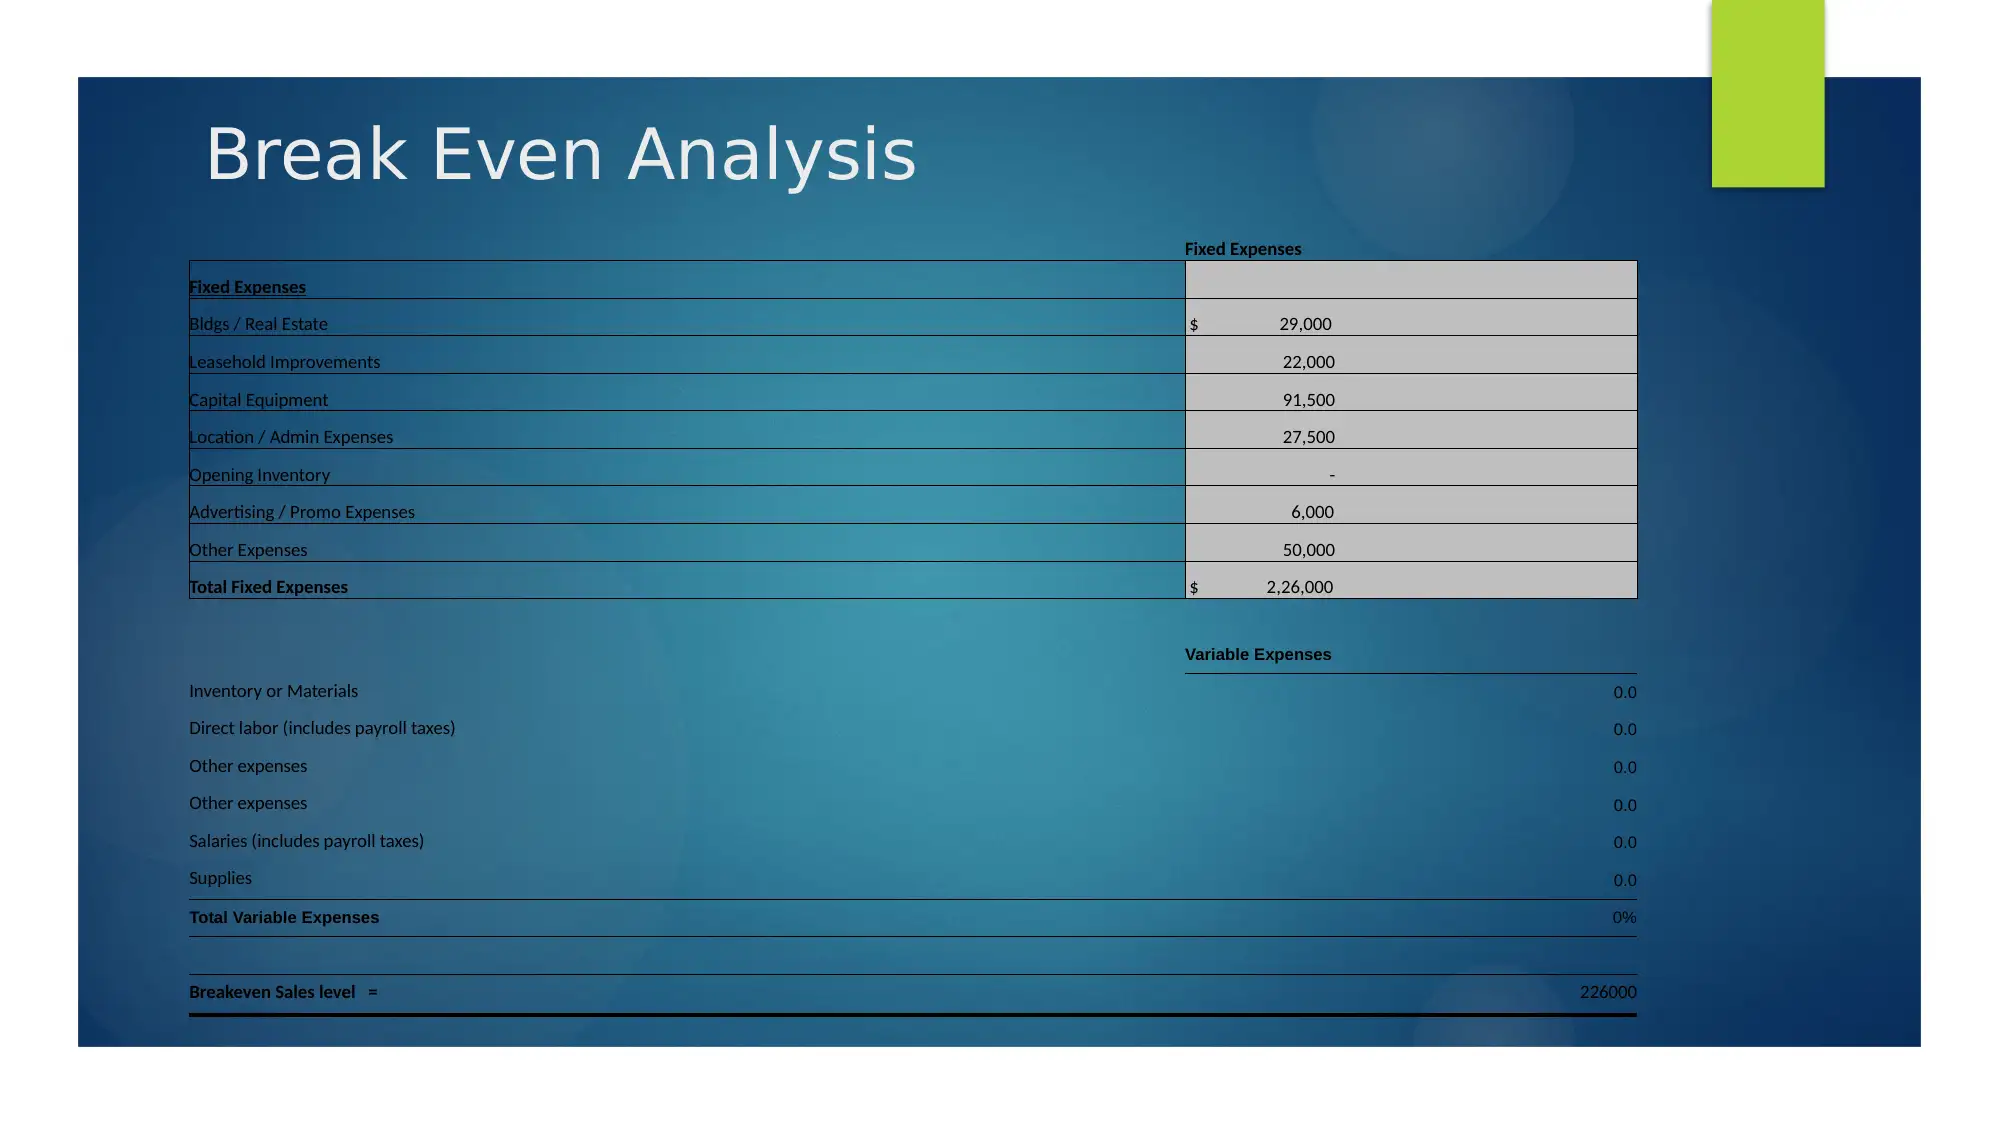
Break Even Analysis
Fixed Expenses
Fixed Expenses
Bldgs / Real Estate $ 29,000
Leasehold Improvements 22,000
Capital Equipment 91,500
Location / Admin Expenses 27,500
Opening Inventory -
Advertising / Promo Expenses 6,000
Other Expenses 50,000
Total Fixed Expenses $ 2,26,000
Variable Expenses
Inventory or Materials 0.0
Direct labor (includes payroll taxes) 0.0
Other expenses 0.0
Other expenses 0.0
Salaries (includes payroll taxes) 0.0
Supplies 0.0
Total Variable Expenses 0%
Breakeven Sales level = 226000
Fixed Expenses
Fixed Expenses
Bldgs / Real Estate $ 29,000
Leasehold Improvements 22,000
Capital Equipment 91,500
Location / Admin Expenses 27,500
Opening Inventory -
Advertising / Promo Expenses 6,000
Other Expenses 50,000
Total Fixed Expenses $ 2,26,000
Variable Expenses
Inventory or Materials 0.0
Direct labor (includes payroll taxes) 0.0
Other expenses 0.0
Other expenses 0.0
Salaries (includes payroll taxes) 0.0
Supplies 0.0
Total Variable Expenses 0%
Breakeven Sales level = 226000
⊘ This is a preview!⊘
Do you want full access?
Subscribe today to unlock all pages.
Trusted by 1+ million students worldwide
Cash Flow
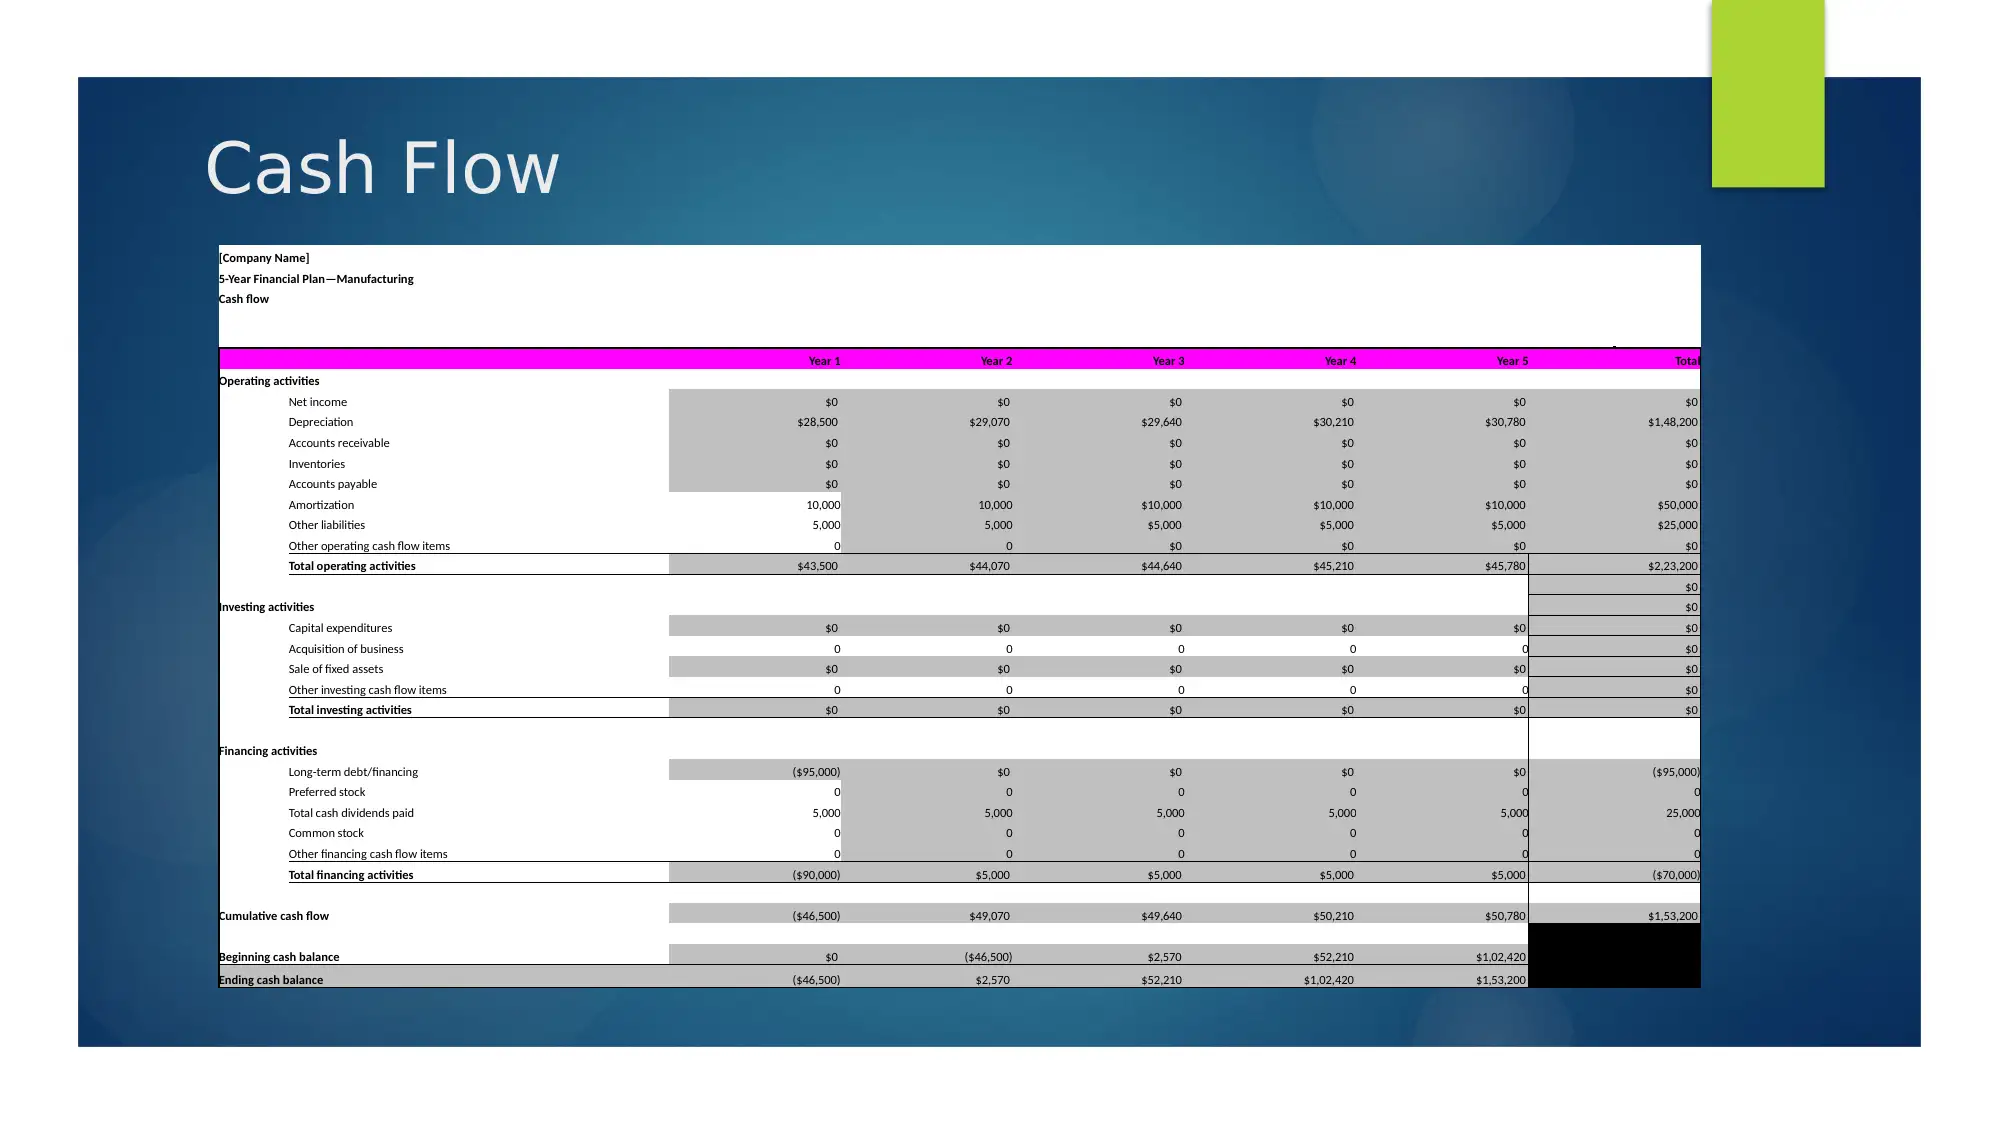
[Company Name]
5-Year Financial Plan—Manufacturing
Cash flow
Year 1 Year 2 Year 3 Year 4 Year 5 Total
Operating activities
Net income $0 $0 $0 $0 $0 $0
Depreciation $28,500 $29,070 $29,640 $30,210 $30,780 $1,48,200
Accounts receivable $0 $0 $0 $0 $0 $0
Inventories $0 $0 $0 $0 $0 $0
Accounts payable $0 $0 $0 $0 $0 $0
Amortization 10,000 10,000 $10,000 $10,000 $10,000 $50,000
Other liabilities 5,000 5,000 $5,000 $5,000 $5,000 $25,000
Other operating cash flow items 0 0 $0 $0 $0 $0
Total operating activities $43,500 $44,070 $44,640 $45,210 $45,780 $2,23,200
$0
Investing activities $0
Capital expenditures $0 $0 $0 $0 $0 $0
Acquisition of business 0 0 0 0 0 $0
Sale of fixed assets $0 $0 $0 $0 $0 $0
Other investing cash flow items 0 0 0 0 0 $0
Total investing activities $0 $0 $0 $0 $0 $0
Financing activities
Long-term debt/financing ($95,000) $0 $0 $0 $0 ($95,000)
Preferred stock 0 0 0 0 0 0
Total cash dividends paid 5,000 5,000 5,000 5,000 5,000 25,000
Common stock 0 0 0 0 0 0
Other financing cash flow items 0 0 0 0 0 0
Total financing activities ($90,000) $5,000 $5,000 $5,000 $5,000 ($70,000)
Cumulative cash flow ($46,500) $49,070 $49,640 $50,210 $50,780 $1,53,200
Beginning cash balance $0 ($46,500) $2,570 $52,210 $1,02,420
Ending cash balance ($46,500) $2,570 $52,210 $1,02,420 $1,53,200
Paraphrase This Document
Need a fresh take? Get an instant paraphrase of this document with our AI Paraphraser

References
Gcaa.gov.ae. (2018). Welcome to UAE General Civil Aviation Authority.
[online] Available at: https://www.gcaa.gov.ae/en/Pages/Default.aspx
Gcaa.gov.ae. (2018). Welcome to UAE General Civil Aviation Authority.
[online] Available at: https://www.gcaa.gov.ae/en/Pages/Default.aspx
1 out of 11


Your All-in-One AI-Powered Toolkit for Academic Success.
+13062052269
info@desklib.com
Available 24*7 on WhatsApp / Email
![[object Object]](/_next/static/media/star-bottom.7253800d.svg)
Unlock your academic potential
Copyright © 2020–2026 A2Z Services. All Rights Reserved. Developed and managed by ZUCOL.