Macroeconomic Analysis of Australian Aviation and France Report
VerifiedAdded on 2020/04/01
|11
|2030
|86
Report
AI Summary
This report presents a macroeconomic analysis of two distinct situations: the Australian aviation industry and the French economic policies. Part A examines the Australian aviation industry, focusing on economies of scale and the market structure in 2002-03, identifying it as a duopoly. Part B analyzes the French macroeconomic policies, including the business cycle, depiction of growth using the AS-AD model, factors of growth, and the impact of long-term infrastructure investments. The analysis references GDP growth rates, business cycle diagrams, and the effects of government spending on infrastructure and education. The report concludes that investments in infrastructure and education can stimulate economic growth in the long run, as illustrated through aggregate demand and supply models.

[MAcro Economic Analysis]
This report analyses two different situations using macro economic analysis. Part A is an analysis of
Australian Aviation Industry. Part B is an analysis of the French Macro Economic Policies in the vurrent
situation.
2017
[Type the company
name]
abc
This report analyses two different situations using macro economic analysis. Part A is an analysis of
Australian Aviation Industry. Part B is an analysis of the French Macro Economic Policies in the vurrent
situation.
2017
[Type the company
name]
abc
Paraphrase This Document
Need a fresh take? Get an instant paraphrase of this document with our AI Paraphraser
Contents
Part A..........................................................................................................................................................4
Q1) Economies of Scale..........................................................................................................................4
Q2) Market Structure of Australian Airline Industry in 2002-03.............................................................6
Part B...........................................................................................................................................................7
Q1) Business Cycle.................................................................................................................................7
Q2) Depiction of Growth in the AS- AD Model......................................................................................7
Q3) Factors of Growth.............................................................................................................................8
Q4) Long Term Infrastructure Investment.............................................................................................10
Bibliography...............................................................................................................................................11
Diagram 1: A Typical Business Cycle.............................................................................................5
Diagram 2 Demand Side Illustration of Recession and Expansion.................................................6
Diagram 3: Effect of Increased Spending on Infrastructure and Education....................................9
Table 1 France (Nominal ) GDP Growth Rate.............................................................................................5
Part A
Q1) Economies of Scale
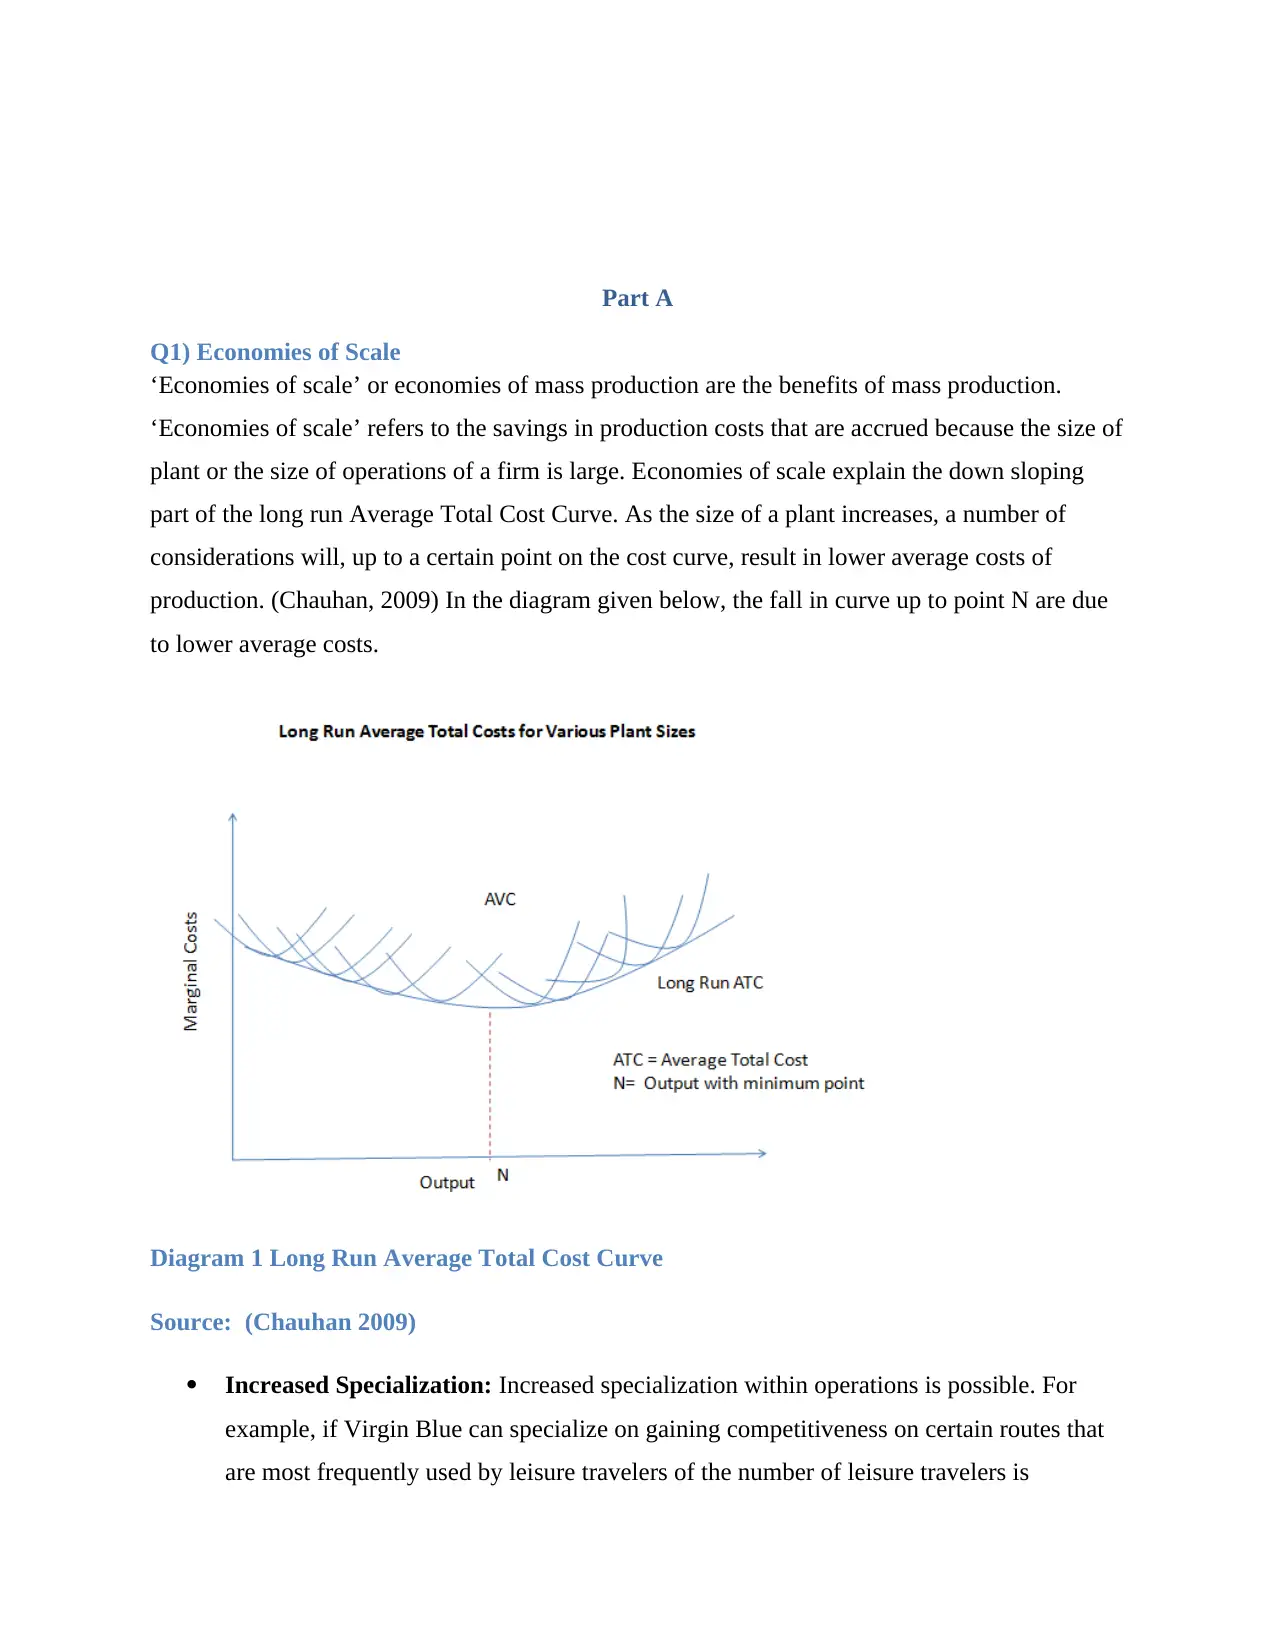
‘Economies of scale’ or economies of mass production are the benefits of mass production.
‘Economies of scale’ refers to the savings in production costs that are accrued because the size of
plant or the size of operations of a firm is large. Economies of scale explain the down sloping
part of the long run Average Total Cost Curve. As the size of a plant increases, a number of
considerations will, up to a certain point on the cost curve, result in lower average costs of
production. (Chauhan, 2009) In the diagram given below, the fall in curve up to point N are due
to lower average costs.
Diagram 1 Long Run Average Total Cost Curve
Source: (Chauhan 2009)
Increased Specialization: Increased specialization within operations is possible. For
example, if Virgin Blue can specialize on gaining competitiveness on certain routes that
are most frequently used by leisure travelers of the number of leisure travelers is
Q1) Economies of Scale
‘Economies of scale’ or economies of mass production are the benefits of mass production.
‘Economies of scale’ refers to the savings in production costs that are accrued because the size of
plant or the size of operations of a firm is large. Economies of scale explain the down sloping
part of the long run Average Total Cost Curve. As the size of a plant increases, a number of
considerations will, up to a certain point on the cost curve, result in lower average costs of
production. (Chauhan, 2009) In the diagram given below, the fall in curve up to point N are due
to lower average costs.
Diagram 1 Long Run Average Total Cost Curve
Source: (Chauhan 2009)
Increased Specialization: Increased specialization within operations is possible. For
example, if Virgin Blue can specialize on gaining competitiveness on certain routes that
are most frequently used by leisure travelers of the number of leisure travelers is
⊘ This is a preview!⊘
Do you want full access?
Subscribe today to unlock all pages.
Trusted by 1+ million students worldwide
sufficiently high. As the size of operations of a firm increases, it is possible to more
factors of production that specialize in a single task . This may increase their proficiency
and productivity. (Chauhan, 2009)
Better Utilization of Resources: Large scale production also allows for better utilization
of resources (up to a certain scale of production). For example, a machine capable of
producing 100 units of a product per day, may produce only 75 units a day. This refers to
the excess capacity in factors of production which may exist due to the smaller demand
that smaller firms face. (Chauhan, 2009) Large number of passengers implies that flights
will have fewer empty seats.
Better Bargaining Capacity in the Factor Market: The large order sizes that are
possible due to the higher scale of production increases the bargaining capacity of a firm,
especially in the purchase of raw material. Bulk buying helps reduce the unit cost of
production.
Better utilization of by products: Firms with large sizes tend to have large amounts of
by products and could utilize those by products well. (Chauhan, 2009)
Economies of scale are most important in the following industry:
Oligopoly: In an oligopoly, firms need to have economies of scale because oligopoly markets
generally tend to have large capital requirements. Examples of such markets are the cellular
industry, aviation industry. In such cases, in order to recover costs, economies of scale are
important. (Chauhan, 2009)
Oligopsony: An Oligopsony exists when there are a few large firms competing for the market
share and the number of buyers is also limited. Given the limited number of buyers, gaining
economies of scale will help increase the profit margin of the firm, leading to an increase in total
profits. (Organization For Economic Co-operation and Development, 2002)
Monopoly: In a monopoly, the monopolist can increase production to meet demand. (Chauhan,
2009) However, the best production curve is where the costs are minimal in the long run. If the
Paraphrase This Document
Need a fresh take? Get an instant paraphrase of this document with our AI Paraphraser
increase in scale leads to diseconomies for some reason such as managerial issues, then there will
be no firms to provide the product. Hence, economies of scale are important.
Q2) Market Structure of Australian Airline Industry in 2002-03
During the period of 2002 and 2003, the Australian aviation industry saw the collapse of a major
airline, the Ansett group. The Australian Aviation industry, was thus, reduced to various
international airlines that provided services in Australia. (Kain & Webb, 2003)However, since
these airlines did not operate out of Australia and did not provide any domestic services, they
could not be considered as a part of the Australian market, in the strictest sense.
The Australian Avaition industry was ruled by two major airline, Qantas Airways and Virgin
Blue Airlines. Given that there were only two service providers in the market at the time, the
Australian airlines are a duopoly. A duo poly is a market structure wherein two large firms
compete in the market. (Organization For Economic Co-operation and Development, 2002)
Qantas Airlines seems to have advantages here because of its origin as an Australian Airline
whereas Virgin Blue is a subsidiary of an international airline company. The two firms do not
collude. (Kain & Webb, 2003)
Part B
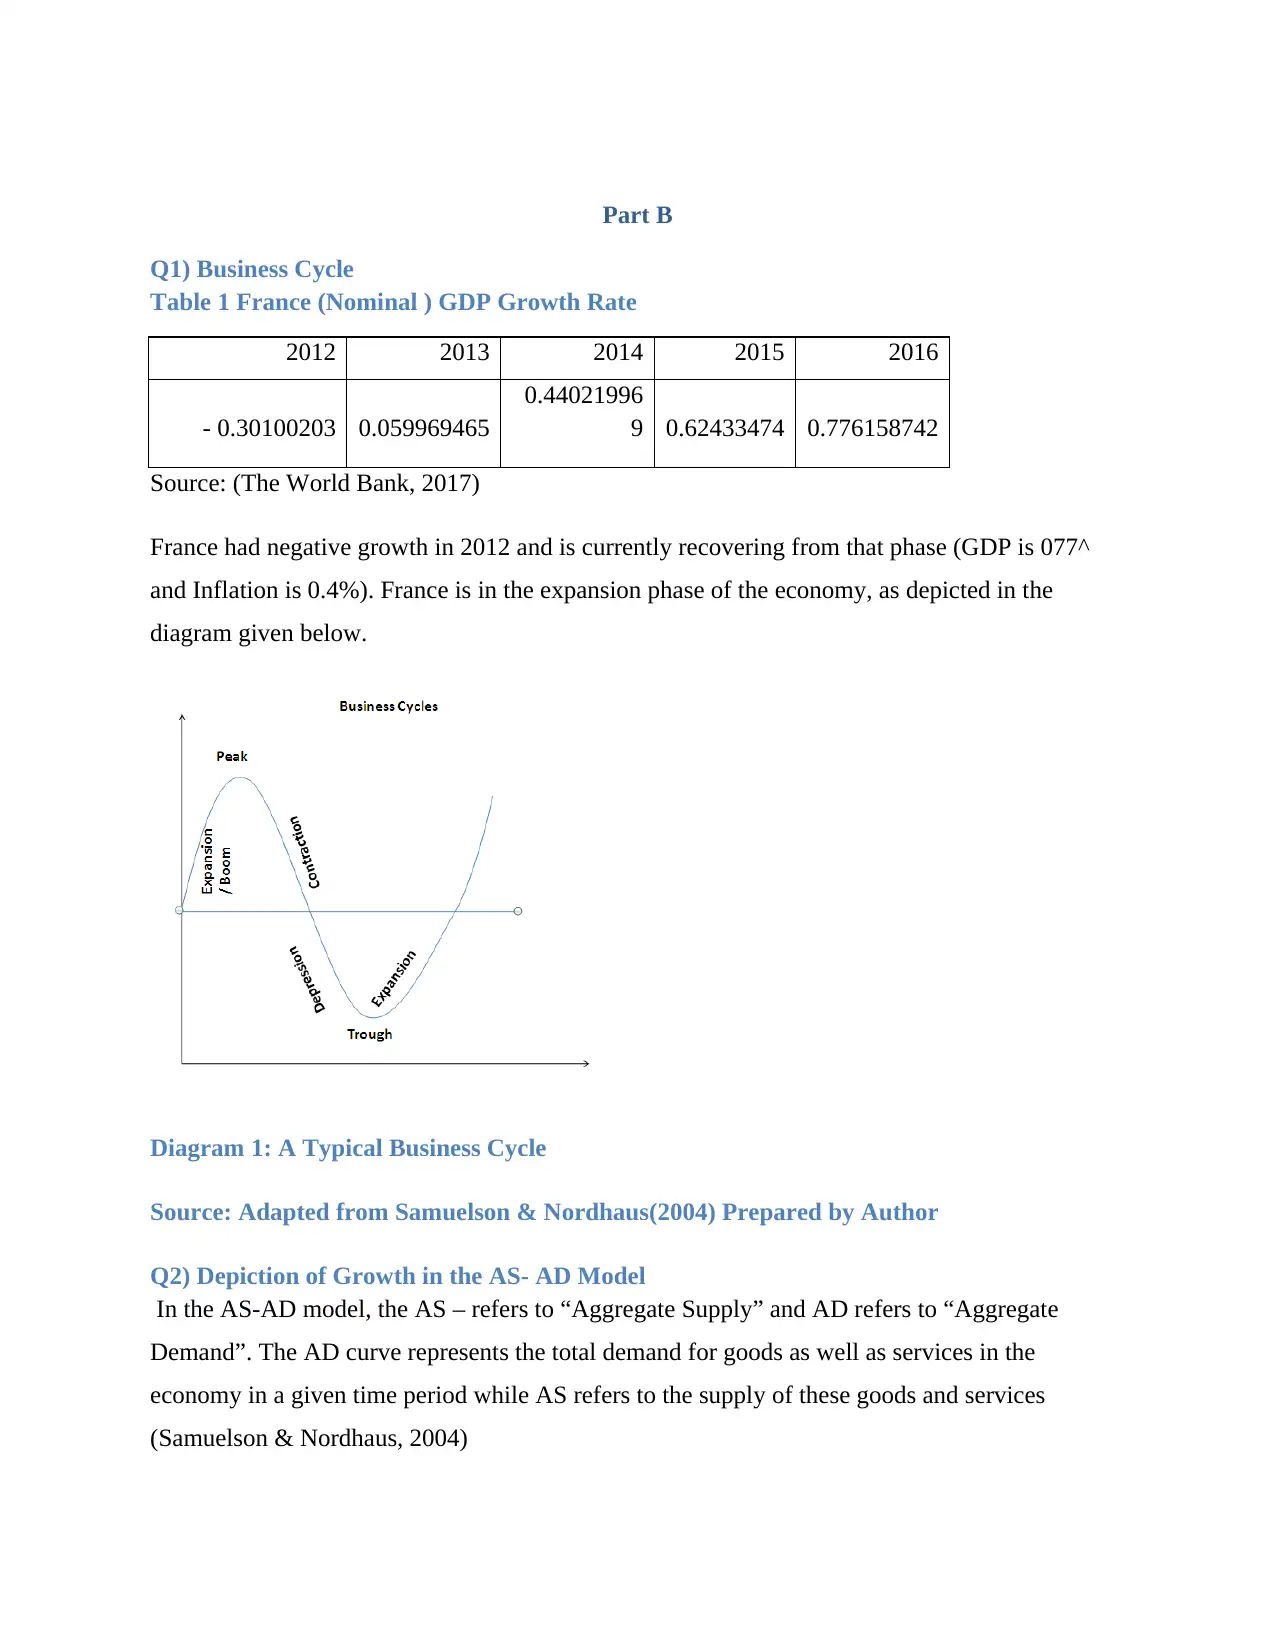
Q1) Business Cycle
Table 1 France (Nominal ) GDP Growth Rate
2012 2013 2014 2015 2016
- 0.30100203 0.059969465
0.44021996
9 0.62433474 0.776158742
Source: (The World Bank, 2017)
France had negative growth in 2012 and is currently recovering from that phase (GDP is 077^
and Inflation is 0.4%). France is in the expansion phase of the economy, as depicted in the
diagram given below.
Diagram 1: A Typical Business Cycle
Source: Adapted from Samuelson & Nordhaus(2004) Prepared by Author
Q2) Depiction of Growth in the AS- AD Model
In the AS-AD model, the AS – refers to “Aggregate Supply” and AD refers to “Aggregate
Demand”. The AD curve represents the total demand for goods as well as services in the
economy in a given time period while AS refers to the supply of these goods and services
(Samuelson & Nordhaus, 2004)
⊘ This is a preview!⊘
Do you want full access?
Subscribe today to unlock all pages.
Trusted by 1+ million students worldwide
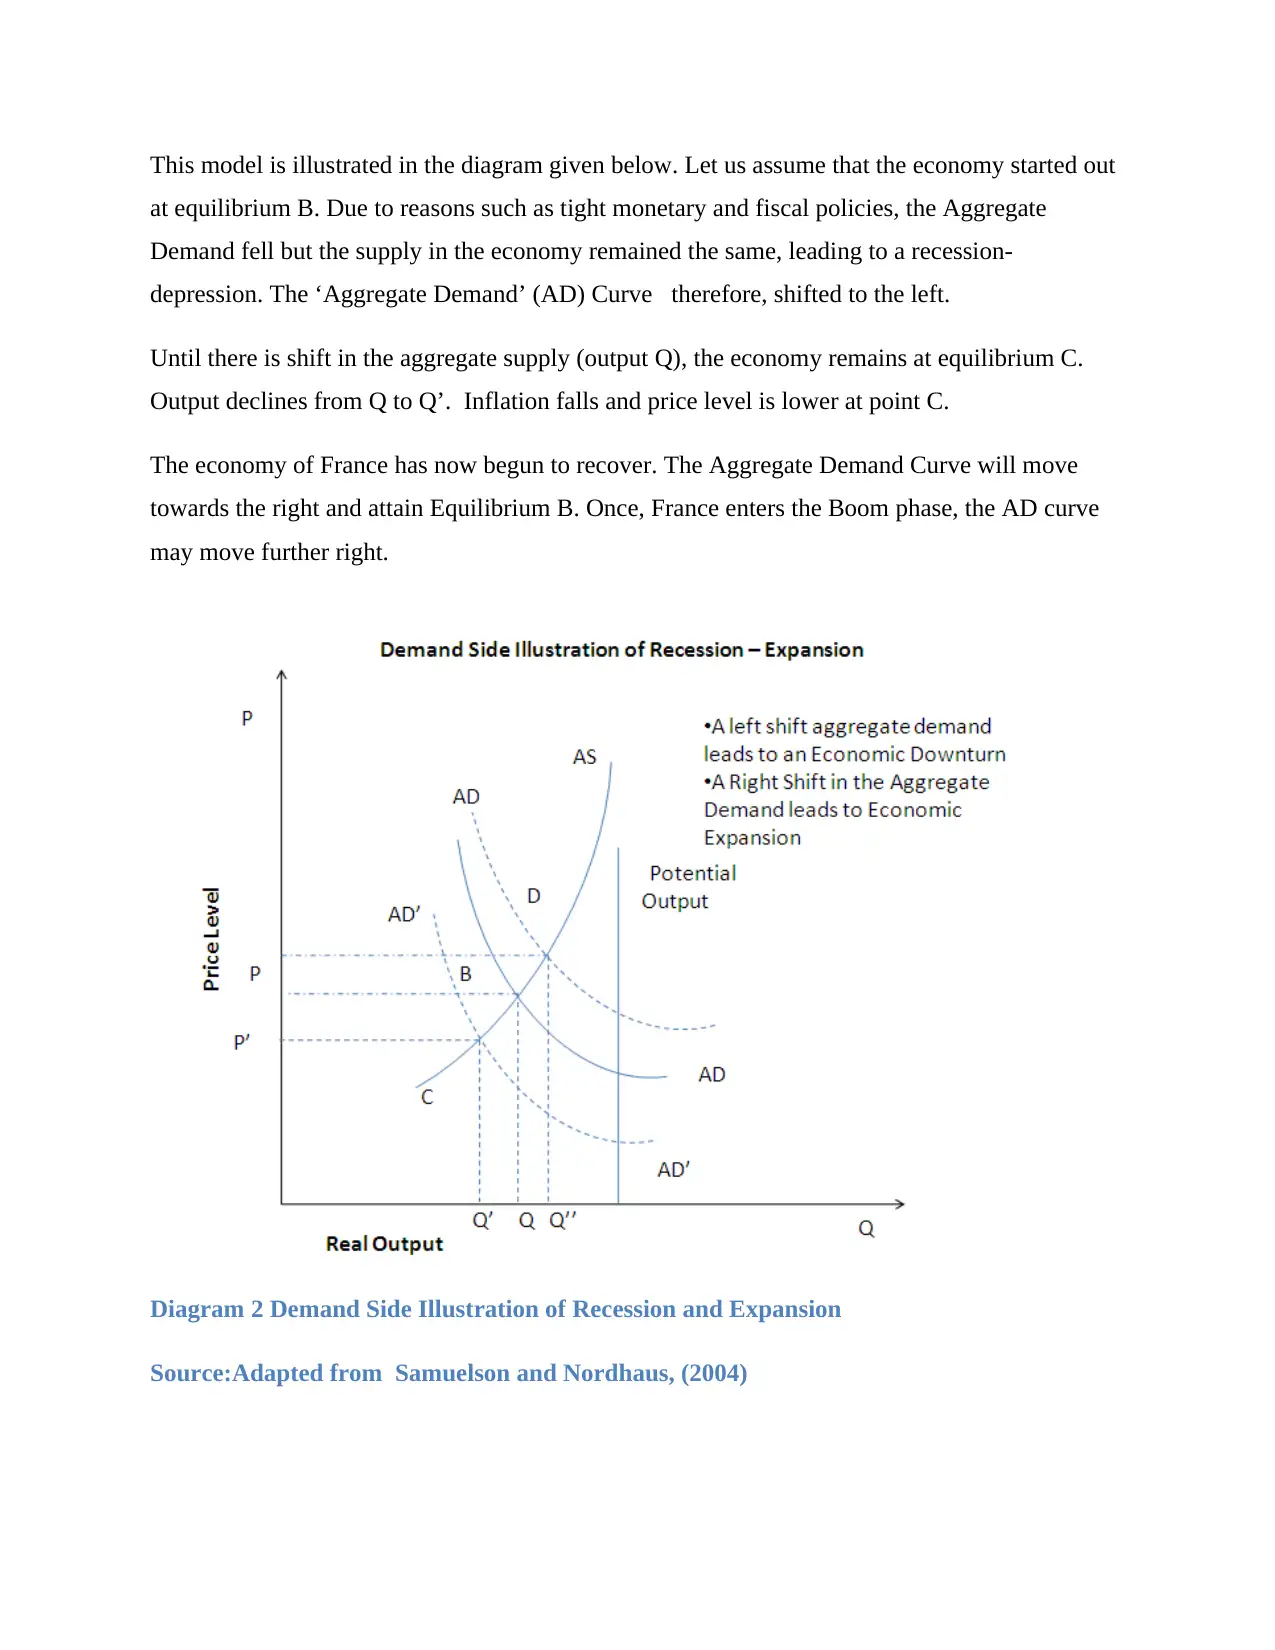
This model is illustrated in the diagram given below. Let us assume that the economy started out
at equilibrium B. Due to reasons such as tight monetary and fiscal policies, the Aggregate
Demand fell but the supply in the economy remained the same, leading to a recession-
depression. The ‘Aggregate Demand’ (AD) Curve therefore, shifted to the left.
Until there is shift in the aggregate supply (output Q), the economy remains at equilibrium C.
Output declines from Q to Q’. Inflation falls and price level is lower at point C.
The economy of France has now begun to recover. The Aggregate Demand Curve will move
towards the right and attain Equilibrium B. Once, France enters the Boom phase, the AD curve
may move further right.
Diagram 2 Demand Side Illustration of Recession and Expansion
Source:Adapted from Samuelson and Nordhaus, (2004)
Paraphrase This Document
Need a fresh take? Get an instant paraphrase of this document with our AI Paraphraser
Q3) Factors of Growth
Downward trends in any economy may be caused due to exogenous (external) or endogenous
(internal) factors. (Samuelson & Nordhaus, 2004)
Exogenous factors refer to external factors such wars, oil shocks, gold rush etc.
However, there seems to be no such factor responsible for the recession in France in
recent history.
Endogenous factors refer to the mechanism within the economy that may have
caused the recession (Samuelson and Nordhaus 2004) . Endogenous factors could be
related to the supply side of the economy or the demand side of the economy. Or
government policies.
However, economic growth occurs when the Aggregate Demand (AD) increases and
AD=C+ I +G+NX
Where
C= Consumer consumption expenditure or the demand for consumption goods and
services
I = Investment which refers to the total value of money invested in production or in
assets such as houses etc.
G = Government purchases. These refer to demand from the government.
NX = Net Exports which are represented as the total exports of a country – Total
imports (Samuelson & Nordhaus, 2004)
An increase in any of these components increases AD.
The French Government could use an effective combination of monetary policies and
Fiscal policies to (Samuelson and Nordhaus 2004). However, the article above,
specifically stresses on the importance of increasing the government spending
(represented by G) in the economy by way of investments in public infrastructure.
An increase in spending of the government in the economy would lead to an increase in
Aggregate Demand. Government spending in infrastructure would lead to greater
employment of labour (and may ultimately lead to rise in wages) and more demand for goods
and services in the economy. Thus, the spending would stimulate the economy. Conversely,

it would also lead to an increase in the budget deficit as expenditure will be in excess of
revenues). (Samuelson & Nordhaus, 2004)
The article recommends that President Macron negotiate with the European Union to initate
reforms to raise the ceiling of budget deficit for the country ( i.e. allow budget deficits in
excess of 3% of GDP)
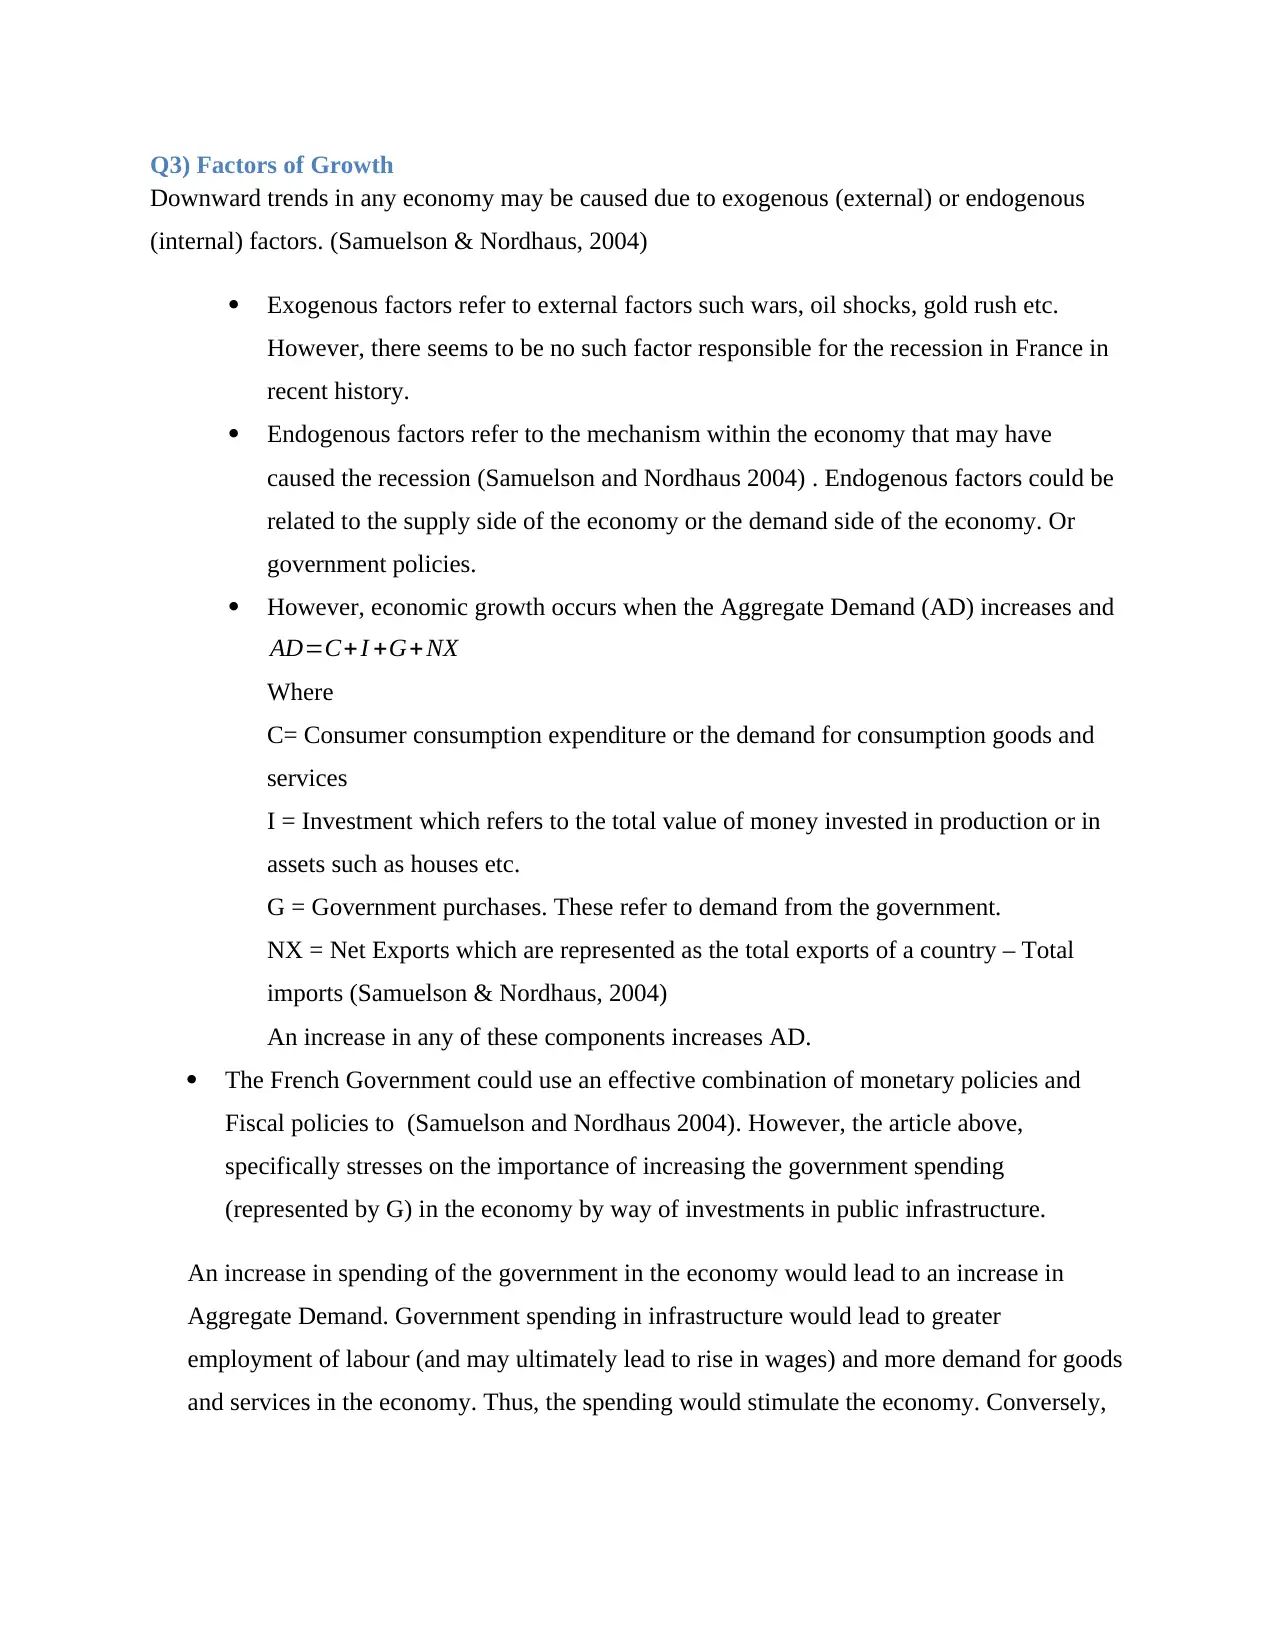
Q4) Long Term Infrastructure Investment
If Mr. Macron takes the long term investment in improvement in infrastructure and education
levels of general population then:
a) Better infrastructure will contribute to a better economic environment which may lead to
increased competitiveness. An increase in the productivity of the country, which in turn
can lead to an increase in wages. It may also increase private sector investment.
(Samuelson & Nordhaus, 2004)
b) Investment in education will lead to availability of skilled workers in greater numbers
and help increase the productivity of labour force. This in turn will lead to increased
private sector investment as well as better wages. (Organization For Economic Co-
operation and Development, 2017)
Increase in productivity implies: (Organization For Economic Co-operation and
Development, 2017)
Higher wages leading to higher consumption
Higher Private Investment demand
This will raise the Aggregate Demand and supply in the long run, and the economy will
shift to a higher level. (Diagram3)
revenues). (Samuelson & Nordhaus, 2004)
The article recommends that President Macron negotiate with the European Union to initate
reforms to raise the ceiling of budget deficit for the country ( i.e. allow budget deficits in
excess of 3% of GDP)
Q4) Long Term Infrastructure Investment
If Mr. Macron takes the long term investment in improvement in infrastructure and education
levels of general population then:
a) Better infrastructure will contribute to a better economic environment which may lead to
increased competitiveness. An increase in the productivity of the country, which in turn
can lead to an increase in wages. It may also increase private sector investment.
(Samuelson & Nordhaus, 2004)
b) Investment in education will lead to availability of skilled workers in greater numbers
and help increase the productivity of labour force. This in turn will lead to increased
private sector investment as well as better wages. (Organization For Economic Co-
operation and Development, 2017)
Increase in productivity implies: (Organization For Economic Co-operation and
Development, 2017)
Higher wages leading to higher consumption
Higher Private Investment demand
This will raise the Aggregate Demand and supply in the long run, and the economy will
shift to a higher level. (Diagram3)
⊘ This is a preview!⊘
Do you want full access?
Subscribe today to unlock all pages.
Trusted by 1+ million students worldwide
Diagram 3: Effect of Increased Spending on Infrastructure and Education.
Source: Adapted from Samuelson & Nordhaus, (2004).
Bibliography
Chauhan, S. (2009). MICROECONOMICS: Theory and Applications, Part 1. New Delhi: PHI.
Kain, J., & Webb, R. (2003). Turbulent Times: Australian Airline Industry Issues 2003. Canberra:
Commonwealth of Australia.
Organization For Economic Co-operation and Development. (2002). Glossary Of Industrial Organisation
and Coomercial LAw. Organization For Economic Co-operation and Development.
Organization For Economic Co-operation and Development. (2017). OECD Economic Surveys: France.
Paris: Organization For Economic Co-operation and Development.
Samuelson, P., & Nordhaus, W. (2004). Economics: Seventeenth edition (17th ed.). New Delhi: Tata
McGraw Hill.
Paraphrase This Document
Need a fresh take? Get an instant paraphrase of this document with our AI Paraphraser

The World Bank. (2017). GDP Current US$. Retrieved September 26, 2017, from The World Bank:
https://data.worldbank.org/country.France
https://data.worldbank.org/country.France
1 out of 11
Related Documents


Your All-in-One AI-Powered Toolkit for Academic Success.
+13062052269
info@desklib.com
Available 24*7 on WhatsApp / Email
![[object Object]](/_next/static/media/star-bottom.7253800d.svg)
Unlock your academic potential
Copyright © 2020–2026 A2Z Services. All Rights Reserved. Developed and managed by ZUCOL.