Financial Evaluation and Sourcing Recommendation: Award Programme
VerifiedAdded on 2020/01/06
|13
|4923
|132
Report
AI Summary
This report presents a comprehensive financial analysis of a corporate award program, utilizing ratio analysis to evaluate profitability, liquidity, and gearing. The analysis includes a detailed examination of the company's financial statements from 2013 and 2014, highlighting strengths and weaknesses. The report assesses profitability ratios such as gross profit, net profit, and return on capital employed, along with liquidity ratios, including current and quick ratios. Efficiency and gearing ratios are also evaluated to provide a holistic view of the organization's financial health. Based on this analysis, the report provides a justified recommendation regarding the suitability of the organization for a sourcing exercise for facilities management services, emphasizing the importance of supplier appraisal and financial exposure limits, specifically the maximum contract value. The report concludes with recommendations for improving financial performance and optimizing capital structure.

CORPORATE
AWARD PROGRAME
1
AWARD PROGRAME
1
Paraphrase This Document
Need a fresh take? Get an instant paraphrase of this document with our AI Paraphraser

Table of Contents
INTRODUCTION................................................................................................................................3
1. Evaluate the finances of this organization highlighting the strengths and weaknesses of their. .3
Position............................................................................................................................................3
2. Provide a justified recommendation as to whether you would consider this organization for a
sourcing exercise for facilities management services emphasizing any limit that should be placed
on the financial exposure (maximum contract value)......................................................................6
CONCLUSION...................................................................................................................................11
REFERENCES...................................................................................................................................12
2
INTRODUCTION
In the present age of globalization, cross boarder transactions are increasing at very faster
rate. It makes it possible for the businesses to take services of overseas suppliers who are offering
qualitative services at cheaper rates. Supplier appraisal is the process through which companies
evaluate and assess suitability and capability of their suppliers and select the best among them. It
will helps company to meet customer needs and demands timely and effectively. Present project
assignment address the process of supplier appraisal in the business. Moreover, the report will
demonstrate various sources of information that are available to suppliers to take their credit
decisions. Along with this, given financial statement will be evaluated to assess the financial,
commercial or technical capabilities of potential suppliers in the sourcing process. Furthermore,
ratio analysis method will be applied to assess profitability, liquidity, gearing and investment ratio
so that better decisions can be taken to improve future performance.
1. Evaluate the finances of this organization highlighting the strengths and weaknesses of their
Position
Financial statement comprises both profitability statement and balance sheet which helps to
represent profit or loss and financial position of the business. In context to given scenario, financial
statement will be analyse through using ratio analysis (Yue-rong, 2010). It helps to evaluate and
examine business performance so as to take better decisions to enhance potential performance of the
business.
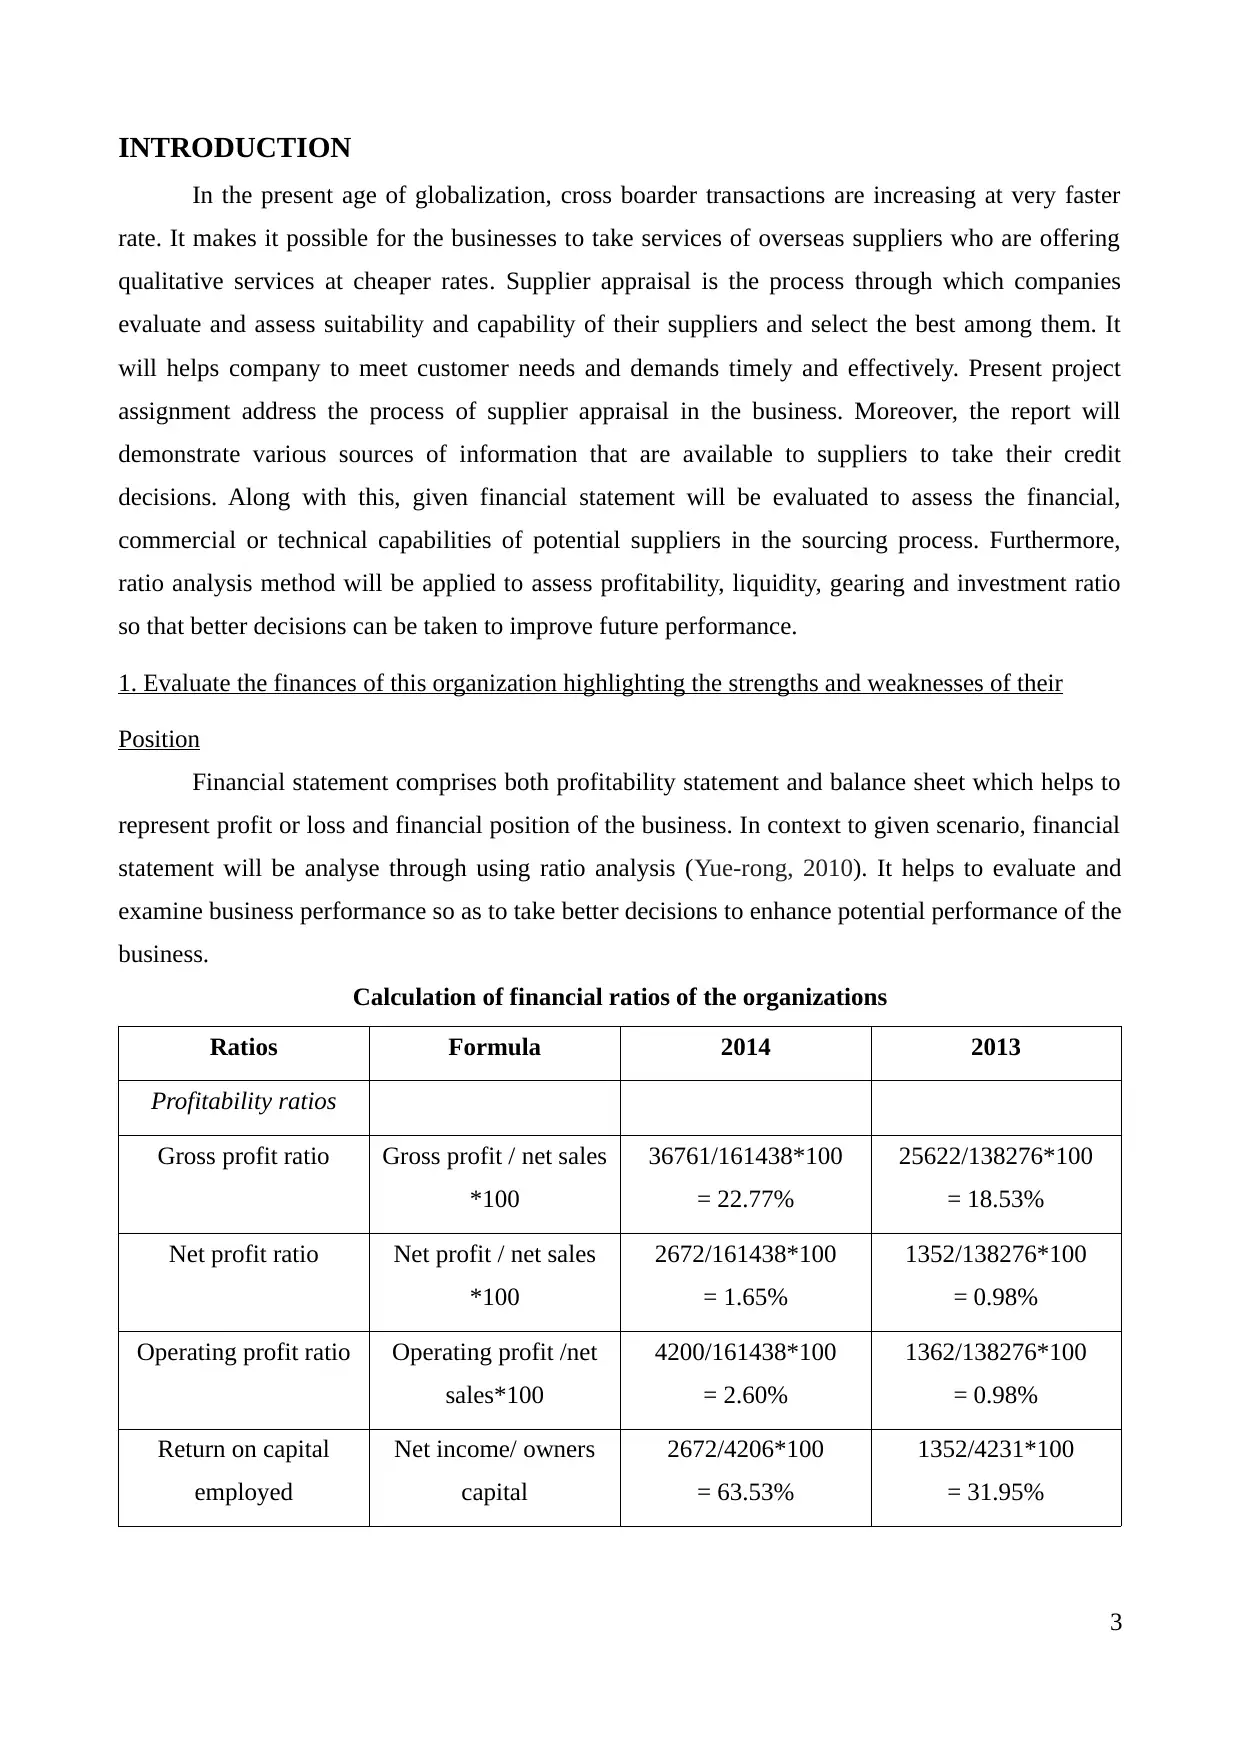
Calculation of financial ratios of the organizations
Ratios Formula 2014 2013
Profitability ratios
Gross profit ratio Gross profit / net sales
*100
36761/161438*100
= 22.77%
25622/138276*100
= 18.53%
Net profit ratio Net profit / net sales
*100
2672/161438*100
= 1.65%
1352/138276*100
= 0.98%
Operating profit ratio Operating profit /net
sales*100
4200/161438*100
= 2.60%
1362/138276*100
= 0.98%
Return on capital
employed
Net income/ owners
capital
2672/4206*100
= 63.53%
1352/4231*100
= 31.95%
3
In the present age of globalization, cross boarder transactions are increasing at very faster
rate. It makes it possible for the businesses to take services of overseas suppliers who are offering
qualitative services at cheaper rates. Supplier appraisal is the process through which companies
evaluate and assess suitability and capability of their suppliers and select the best among them. It
will helps company to meet customer needs and demands timely and effectively. Present project
assignment address the process of supplier appraisal in the business. Moreover, the report will
demonstrate various sources of information that are available to suppliers to take their credit
decisions. Along with this, given financial statement will be evaluated to assess the financial,
commercial or technical capabilities of potential suppliers in the sourcing process. Furthermore,
ratio analysis method will be applied to assess profitability, liquidity, gearing and investment ratio
so that better decisions can be taken to improve future performance.
1. Evaluate the finances of this organization highlighting the strengths and weaknesses of their
Position
Financial statement comprises both profitability statement and balance sheet which helps to
represent profit or loss and financial position of the business. In context to given scenario, financial
statement will be analyse through using ratio analysis (Yue-rong, 2010). It helps to evaluate and
examine business performance so as to take better decisions to enhance potential performance of the
business.
Calculation of financial ratios of the organizations
Ratios Formula 2014 2013
Profitability ratios
Gross profit ratio Gross profit / net sales
*100
36761/161438*100
= 22.77%
25622/138276*100
= 18.53%
Net profit ratio Net profit / net sales
*100
2672/161438*100
= 1.65%
1352/138276*100
= 0.98%
Operating profit ratio Operating profit /net
sales*100
4200/161438*100
= 2.60%
1362/138276*100
= 0.98%
Return on capital
employed
Net income/ owners
capital
2672/4206*100
= 63.53%
1352/4231*100
= 31.95%
3
⊘ This is a preview!⊘
Do you want full access?
Subscribe today to unlock all pages.
Trusted by 1+ million students worldwide
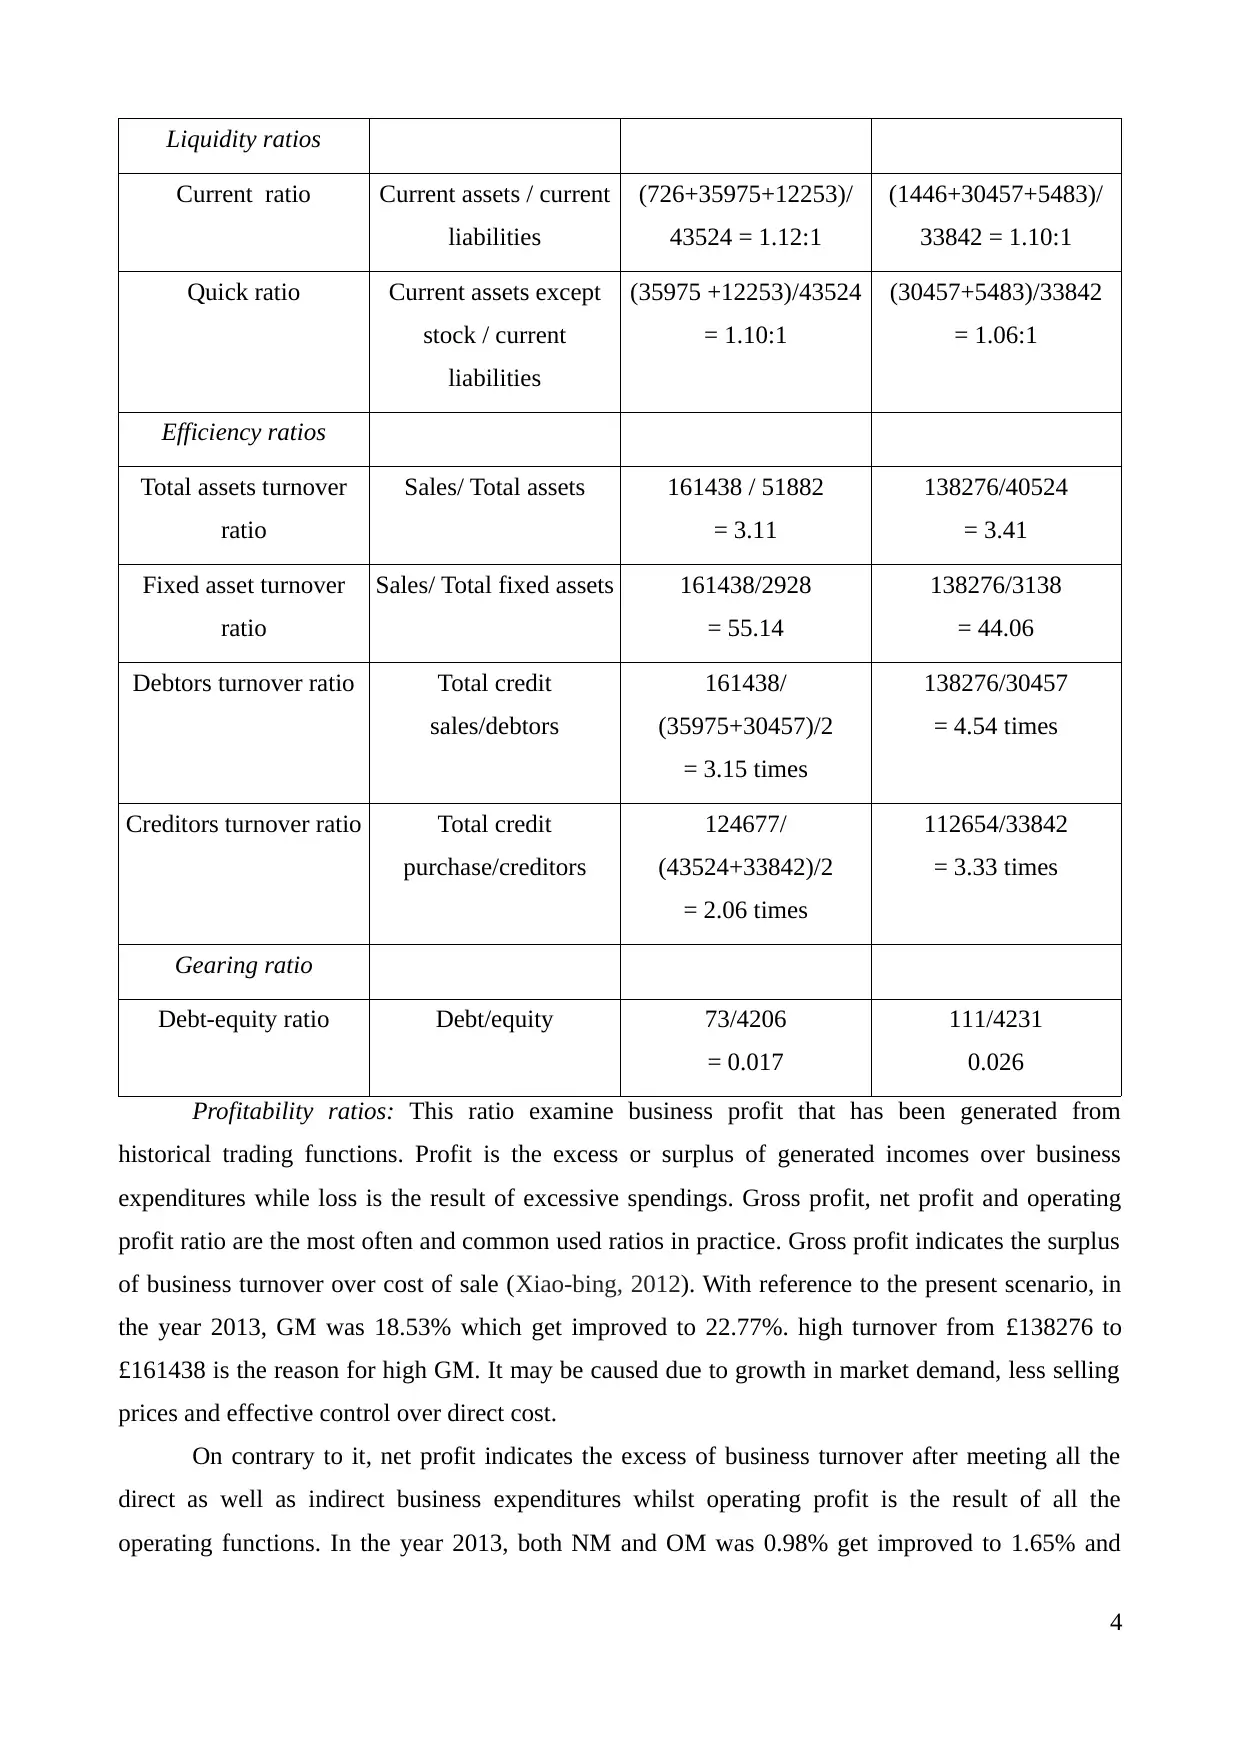
Liquidity ratios
Current ratio Current assets / current
liabilities
(726+35975+12253)/
43524 = 1.12:1
(1446+30457+5483)/
33842 = 1.10:1
Quick ratio Current assets except
stock / current
liabilities
(35975 +12253)/43524
= 1.10:1
(30457+5483)/33842
= 1.06:1
Efficiency ratios
Total assets turnover
ratio
Sales/ Total assets 161438 / 51882
= 3.11
138276/40524
= 3.41
Fixed asset turnover
ratio
Sales/ Total fixed assets 161438/2928
= 55.14
138276/3138
= 44.06
Debtors turnover ratio Total credit
sales/debtors
161438/
(35975+30457)/2
= 3.15 times
138276/30457
= 4.54 times
Creditors turnover ratio Total credit
purchase/creditors
124677/
(43524+33842)/2
= 2.06 times
112654/33842
= 3.33 times
Gearing ratio
Debt-equity ratio Debt/equity 73/4206
= 0.017
111/4231
0.026
Profitability ratios: This ratio examine business profit that has been generated from
historical trading functions. Profit is the excess or surplus of generated incomes over business
expenditures while loss is the result of excessive spendings. Gross profit, net profit and operating
profit ratio are the most often and common used ratios in practice. Gross profit indicates the surplus
of business turnover over cost of sale (Xiao-bing, 2012). With reference to the present scenario, in
the year 2013, GM was 18.53% which get improved to 22.77%. high turnover from £138276 to
£161438 is the reason for high GM. It may be caused due to growth in market demand, less selling
prices and effective control over direct cost.
On contrary to it, net profit indicates the excess of business turnover after meeting all the
direct as well as indirect business expenditures whilst operating profit is the result of all the
operating functions. In the year 2013, both NM and OM was 0.98% get improved to 1.65% and
4
Paraphrase This Document
Need a fresh take? Get an instant paraphrase of this document with our AI Paraphraser
2.60% respectively (Wu, Rossetti and Tepper, 2015). Rising trend in profitability ratios from £1352
to £2672 is a good sign. It may be due to increase in consumer demand and less offering prices.
Moreover, return on capital employed measure the profit percentage on total shareholder's
investment. It has been increased from 31.95% to 63.53% due to larger the net earnings. Thus, it
can be said that company is performing well as compare to PY 2013. But still, in both the years,
there is a huge difference in GM and NM. It reflects that firm is not maintaining an effective control
over its indirect costs. In order to increase potential performance, it can be suggested that by
offering more effective services at affordable prices and control on expenditures greatly assist
users to enlarge their turnover and reduce expenses (Wang, Kayande and Jap, 2010). This in turn, it
enable firm to get larger profitability and enjoy more success.
Liquidity ratios: It measure the ability of the firm to pay their short-term liabilities
effectively. Current ratio and quick ratio are the most commonly used liquidity position of the
business (Vodova, 2011). Current ratio (CR) measure that firm has enough current assets or not to
discharge their current obligations timely. However, quick ratio measure liquidity ability except the
inventory balance. In the year 2013, CR was 1.10 which has been inclined to 1.12 in the year 2014.
Increase in debtors and cash are the reason for high CR. It reflects that business is more able to pay
off their current liabilities (not more than 12 month) more effectively.
Moreover, QR has been increased from 1.06:1 to 1.10 which indicates that company is able
to pay off their short-term obligations without having inventory in the business (Van den End and
Kruidhof, 2013). In addition to it, both the liquidity ratios are higher than idle industrial current
ratio of 1:1 and QR of 0.5:1. Thus, it can be said that liquidity position of the business is sound.
Henceforth, it will be able to take more on credit and at favourable terms.
Efficiency ratios: This ratio also called activity ratios which measure managers ability to use
business assets so as to generate larger revenues (Sherry and Teece, 2015). Total assets turnover
ratio (TATR) indicates that how effectively the assets are using by the management while fixed
assets turnover ratio (FATR) measure ability to use fixed assets. In the year 2013, TATR was 3.41
which get declined to 3.11 while FATR has been increased from 44.06 to 55.14. Thus, it can be said
that fixed assets such as plant and machinery, computer equipment and others are more effectively
utilizing so as to generate high turnover and profitability. While, on the other side, management are
using total assets less effectively (Sepúlveda and Derpich, 2014).
Accounts receivable turnover ratio indicates the relationship between net sales and debtors.
It indicates the ability to generate quicker cash inflow by selling the inventory. It has been declined
from 4.54 times to 3.15 times which is not good because it indicates slower conversion of stock into
sales as compare to PY 2013 (Saleem and Rehman, 2011). This in turn, company's sales and cash
5
flow management will be adversely affected. While, accounts payable ratio measure ability to pay
creditors by comparing net credit purchase with the average creditors. It has been reduced from 3.33
times to 2.06 times in the year 2014 which reflects that company is making delayed payment to
their suppliers.
Gearing ratios: Debt/equity ratio indicate the percentage of debt and equity funds in the total
capital employed. It has been declined from 0.026 to 0.017 due to excessive shareholders funds and
very little debt funds. Although, declined debt-equity ratio is a sign of less financial risk but still,
idle industrial ratio is 0.5:1. Thus, as per this standard, companies must use both debt and equity
capital and manage their capital risk accordingly (Paul and et.al., 2013). However, in the given case,
it is very shorter than set standard. It dilute controlling rights to the investors to a large extent.
Moreover, it makes it necessary for the company to meet shareholder expectation by providing them
consistent and increased return either in term of dividend and capital appreciation. Thus, it is clear
that gearing position of the firm is not good. Henceforth, it should take long term debts from lenders
to create an optimum capital structure so that it can pay its long term liabilities timely and
effectively (Park, Shin, Chang and Park, 2010).
Taken into account all the derived results, it can be said that operational performance of the
company has been improved due to large profitability. Moreover, firm has sound liquidity position
hence, it is able to pay timely to the suppliers. On contrary to it, management need to pay focus on
effective utilization of resources to generate larger revenue (Lartey, Antwi and Boadi, 2013). Along
with this, it has to obtain funds from debt also so that company will be more able to increase their
gearing position by enlarging the ability to pay long term liabilities more effectively. This in turn, it
can assure long run survival and high success in future period.
2. Provide a justified recommendation as to whether you would consider this organization for a
sourcing exercise for facilities management services emphasizing any limit that should be
placed on the financial exposure (maximum contract value)
Procurement and supply management process involves an assessment and evaluation of
supplier's ability to deliver goods and services on time. Manufacturing companies purchase raw
material from the outsiders on credit, called suppliers. In the present competitive age, it is essential
for the firms to assure that their suppliers deliver timely services which enable organization to
ensure production in required quantity to meet market demand (Kumbirai and Webb, 2013).
Suppliers offer their services on credit henceforth, they provide financial services to the company
also. Supplier appraisal is an crucial aspect of strategic sourcing and managing suppliers so that
corporations can attain competitive advantages. It is an pre-purchase activity that assist firm to
6
⊘ This is a preview!⊘
Do you want full access?
Subscribe today to unlock all pages.
Trusted by 1+ million students worldwide
analyse the ability of potential creditors in terms of quality, prices, delivery, quantity and all the
other factors that to be embodied in the contract (Kiruri, 2013). It is the process through which
company will approve most appropriate suppliers by placing order to them.
Pre-qualification criteria or process for supplier appraisal in the sourcing process
Supplier appraisal process comprises mainly three elements that are strategic sourcing,
supplier management and accomplishment of competitive advantage. In such respect, strategic
sourcing can be defined as the location, evaluation and selection of the most capable supplier who
will be greatly able to meet purchase requirement and contribute competitive advantage to them
(Karande and Chakraborty, 2012). While, supplier management is a cross functional activity,
through which firms rationalize supplier base so as to purchase, coordinate, assess suppliers
performance and develop their potential as well. However, competitive advantage enable
corporations to compete more effectively with the rivalry firms. The process of supplier appraisal
has been described below:
Clarifying requirements: Initially, corporations has to clarify their requirement that “what
they want” from the suppliers. Management has to determine that what value can be added by
buying from the suppliers. For instance, supplier appraisal process can drive benefits of less prices,
costs, minimum risk, effective services, high quality, compliance with regulations etc. In the
process, firms mainly pay focus on 5 rights that are price, quality, quantity, time and place (Glass
and Knight, 2010). Corporations need to assess the priority of key internal stakeholders such as
managers, directors and staff member of various departments in terms of all the 5 rights. Business
has to identify the needs of stakeholders and make effective management strategies to meet goals by
negotiating (ZHANG ans et.al., 2010). Procurement process comprises need specification, decide
contract terms, identify potential suppliers, supplier appraisal, invite quotations or tenders, select
most suitable, negotiating, award the contract, supplier management and invoice payment (Gervais,
Levant and Ducrocq, 2010). Firms set policies and rules to regulate whole the process. In order to
implement the process more effectively, authority and responsibility must be delegated to the
accountable person in the business.
Sourcing options: There are three sourcing options available to the business, that are single
supplier, dual supplier or multiple supplier. Company need to set framework or agreement with the
supplier in which all the conditions or contractual terms must be decided. It will govern whole the
contract with the supplier, specially with regard to price and quantity (Supplier evaluation and
appraisal, n.d.). Competition based selection, fixed contract duration, economies of scale and
greater dependence are the benefits of single supplier framework. While, risk of incorrect supplier
selection may bring jeopardy to the business and create negative market image. However, multiple
7
Paraphrase This Document
Need a fresh take? Get an instant paraphrase of this document with our AI Paraphraser
supplier framework helps to mitigate the risk of wrongful supplier selection. On contrary to it, risk
of collusion between suppliers to fix agreements and difficulties to determine perfect number of
supplier are its disadvantage (Viviana and et.al., 2003).
Developing ITTs: After identifying the sourcing options, management need to develop
invitation to tenderer. Specification of the products or services, tender form, pricing schedule, KPIs,
contractual terms, plans, customer and site information all are the part of ITT.
Selection and award criteria:Company will select supplier through taking into consideration
technical capability, financial stability, reliability, environment system, product quality, availability
of resources etc. Firm will assign weight to all the factors as per their importance (Yue-rong, 2010).
There are two methods available to evaluate such criteria such as pre-qualification questionnaire
and supplier visit as well. PQQ provide huge benefits to facility management to identify
information for their current contracts, arrangement for administration, sales order processing,
managing deliveries etc. While, in award criteria, entity can make technical and commercial
evaluation of suppliers either separately or jointly (Xiao-bing, 2012).
P2P, E tendering, E-auction: P2P stands for purchase to pay in which information will be
provided by E-procurement, E-auction and E-tendering to save business cost. For instance, supplier
will exhibit their products and services in E-catalogues and information will be share on supplier
portals. E-auction will be conduct through using websites of buyers, sellers and third party (Wu,
Rossetti and Tepper, 2015). While, in E-tendering, business will use E-RFQ and posted information
by using web facility such as e-mail. ITT will be published on buyer's E-tender web portal and
suppliers will send bids using secure emails such as electronic vault in E-Tender system.
Furthermore, it helps to generate automatic scores, specifically for PQQ. E-Catalogues will provide
information regarding product content to all the organizations who intends to buy material from the
suppliers (Wang, Kayande and Jap, 2010). E-Auction provide benefits to administrate and reduce
acquisition lead time more efficiently. It provide quick access to buyers as they can gain knowledge
of wide range of suppliers in less time and select most suitable among these. Thus, it helps to
improve value for the buyers and provide competitive advantage to him.
Sources of information on suppliers to select the most appropriate supplier
There are different types of sources available to an organization to generate information
about the potential suppliers (Vodova, 2011). Obtaining authentic and prominent information is
necessary so as to select most appropriate supplier which will provide more effective services at
cost effective prices to the business. Some of the information sources of suppliers are given below: Financial reports: Every business prepare financial statements so as to obtain information
about their performance and financial status at the end of the financial year. Balance sheet is
8
a statement of financial position which is a snapshot of all the fixed as well as current assets
and current as well as non-current liabilities. In such respect, all the business liabilities
which will be paid within the time period of one year, is called current or short-term
liabilities. Suppliers are the part of current liabilities as they supply material for credit of less
than 12 months (Van den End and Kruidhof, 2013). Thus, company can acquire information
from the financial statement by subtracting long term liabilities such as debt from the total
liabilities. Credit rating agencies: CRA is a company that assign credit ratings by analysing the ability
of the debtors to pay back their debt inclusion of timely interest payment. They also provide
information about the potential suppliers to the organizations at some charges (Sepúlveda
and Derpich, 2014). Social media: Looking at the present market, social media also has been using to keep in
touch with the suppliers regularly. Video sharing, blogs, social networking, microblogs etc.
are some of the ways available to the firms to regularly interact with the suppliers. Use of
social media is very effective, simple and quick to engage with the current and potential
suppliers and take competitive advantage through this (Sherry and Teece, 2015). Supplier
relationship management (SRM) is an very effective tool using by the organizations to
manage their supply chain and procurement process. Supplier websites: Present age is the age of technology in which transactions are settled by
using e-facility. As said earlier, that E-auction, E-tendering, E-catalogue and E-RFQ are
some of the examples of internet use in supplier appraisal process. In such respect,
information can be obtained from supplier's web portal, websites in which information is
already published and updated regularly (Saleem and Rehman, 2011). Through getting
access of the sites, business can know information about suppliers products, quality, prices,
policies and delivery time. Moreover, Supplibase is also an effective, dynamic and engaging
platform which is using by most of the organization to manage supply chain finance process.
This platform approve the invoices and settle payment on maturity date automatically and
transfer it into the account of the supplier (Paul and et.al., 2013). Along with this, in case,
when supplier need earlier payment before maturity date than it can discount invoices at
very less discount and transfer payment electronically. It is a connecting enterprise which
connect both suppliers and buyers for their objectives. Corporations can also see buyers
reviews about the quality of offered products and services by the suppliers. It will greatly
helps entities in finding the suppliers who offer best quality material, affordable costs,
timely deliveries and favourable credit terms as well (Park, Shin, Chang and Park, 2010).
9
⊘ This is a preview!⊘
Do you want full access?
Subscribe today to unlock all pages.
Trusted by 1+ million students worldwide
This in turn, firm will be able to satisfy global demand of the consumers on timely manner. Other appropriate publications: Trade associations of each and every industry also provide
huge assistance to match most suitable supplier as per corporation need. Moreover, business
advisers such as chamber of commerce also can provide directions to acquire information
about potential suppliers. Trade magazines and global source exhibitions are also the sources
available to an entity to assess suppliers available in the business (Lartey, Antwi and Boadi,
2013). Furthermore, directories such as yellow pages also helps to have a look for the
suppliers in local business area. In such context, Global Source Online is a comprehensive
set of online directory that give a detail list of all the verified and unverified suppliers.
Through verified suppliers, businesses can ensure that each supplier is an authentic company
who is legally registered in the market.
Assessment of financial statements to evaluate financial, commercial and technical capabilities
of potential suppliers in the sourcing process
Companies has to evaluate the ability of supplier in financial, commercial and technical
context to assess most appropriate supplier.
Financial capability: As already said, that financial statements are the source of financial
information of the business. Thus, business can determine financial capability of the suppliers by
evaluating their financial accounts (Kumbirai and Webb, 2013). Through this, buyers can assess
profitability, liquidity, solvency and cash flow position of the suppliers and select supplier who is
financial stable. For this, ratio analysis has been conducted which emphasized that profitability
performance and liquidity position of the supplier is good. While, gearing position of the supplier is
not very good because it use only the equity capital in its capital structure (Karande and
Chakraborty, 2012).
Technical capability refers to the ability of supplier to offer technological equipments and
services to meet corporation demand (Kiruri, 2013). On the basis of such factors, it can be
recommended that company has to chose supplier who have huge ability to offer new, innovative
and technological products and services. So that, companies can attract more and more customers
by providing qualitative services. It provide advantage of enlarge turnover, sales, customer base and
market share as well (Gervais, Levant and Ducrocq, 2010).
Commercial ability: It comprises willingness or ability to share market risk, location,
operating management system, product prices, service quality, environmental policy etc. Supplier
who provide quality services at cheaper prices, deliver goods on time and fulfil environmental laws
and regulations is often gains preference over others.
After evaluating financial performance and determining supplier appraisal process, it can be
10
Paraphrase This Document
Need a fresh take? Get an instant paraphrase of this document with our AI Paraphraser
recommended that companies should identify information about potential suppliers Global Online
Source and Supplibase web portal. So that, it can determine prominent and authentic supplier in the
form of verified suppliers. Supplibase information also provide assistance to company to settle
transactions automatically. Moreover, in the souring option, it has to select multiple supplier so that
risk of selecting wrong supplier can be eliminated. After this, company has to set some criteria in
relation to price, quality, quantity, timely delivery, environment responsibility etc. At the end, firms
has to compare actual performance of the supplier against the set standards for the corporate award
program.
CONCLUSION
The report concluded that supplier appraisal process will make an significant contribution to
assess financial stability, performance, commercial ability, technical capability so that organization
can determine most suitable supplier. It will ultimately help firm to gain quicker and timely receipts
of quality products at affordable prices. Through this, company will be able to meet customer
demand timely. This in turn, it can enlarge its market share, manage their suppliers, turnover,
profitability and take benefits of competitive advantages as well.
11
REFERENCES
Books and Journals
Gervais, M., Levant, Y. and Ducrocq, C., 2010. Time-driven activity-based costing (TDABC): An
initial appraisal through a longitudinal case study.Journal of Applied Management Accounting
Research. 8(2), pp.1
Glass, C.A. and Knight, R.A., 2010. The nurse rostering problem: A critical appraisal of the
problem structure. European Journal of Operational Research. 202(2). pp.379-389.
Karande, P. and Chakraborty, S., 2012. Application of multi-objective optimization on the basis of
ratio analysis (MOORA) method for materials selection. Materials & Design. 37, pp.317-324.
Kiruri, S.N., 2013. Role of supplier appraisal on management of public procurement at Rift Valley
Water Services Board, Nakuru. International Journal of Social Sciences and
Entrepreneurship. 1(5). pp.384-414.
Kumbirai, M. and Webb, R., 2013. A financial ratio analysis of commercial bank performance in
South Africa. African Review of Economics and Finance. 2(1), pp.30-53.
Lartey, V.C., Antwi, S. and Boadi, E.K., 2013. The relationship between liquidity and profitability
of listed banks in Ghana. International Journal of Business and Social Science. 4(3).
Park, J., Shin, K., Chang, T. W. and Park, J., 2010. An integrative framework for supplier
relationship management. Industrial Management & Data Systems. 110(4). pp.495-515.
Paul, M.C. and et.al., 2013. Analytical models for delivery performance of a supplier or a service
provider. American Journal of Industrial and Business Management. 3(06). pp.39.
Saleem, Q. and Rehman, R.U., 2011. Impact of Liquidity Ratios on Profitability. Interdisciplinary
Journal of Research in Business. 1(7), pp.95-98.
Sepúlveda, J. M. and Derpich, I. S., 2014. Automated Reasoning for Supplier Performance
Appraisal in Supply Chains. Procedia Computer Science. 31. pp.966-975.
Sherry, E.F. and Teece, D., 2015. Patent Thickets: An Economic Appraisal.Tusher Center for the
Management of Intellectual Capital, Working Paper Series, (1).
van den End, J.W. and Kruidhof, M., 2013. Modelling the liquidity ratio as macroprudential
instrument. Journal of Banking Regulation. 14(2). pp.91-106.
Vodova, P., 2011. Liquidity of Czech commercial banks and its determinants.International Journal
of Mathematical Models and Methods in Applied Sciences. 5(6). pp.1060-1067.
Wang, Q., Kayande, U. and Jap, S., 2010. The seeds of dissolution: discrepancy and incoherence in
buyer-supplier exchange. Marketing Science. 29(6). pp.1109-1124.
Wu, D., Rossetti, M. D. and Tepper, J. E., 2015. Possibility of Inventory Pooling in China’s public
12
⊘ This is a preview!⊘
Do you want full access?
Subscribe today to unlock all pages.
Trusted by 1+ million students worldwide
1 out of 13
Related Documents


Your All-in-One AI-Powered Toolkit for Academic Success.
+13062052269
info@desklib.com
Available 24*7 on WhatsApp / Email
![[object Object]](/_next/static/media/star-bottom.7253800d.svg)
Unlock your academic potential
Copyright © 2020–2026 A2Z Services. All Rights Reserved. Developed and managed by ZUCOL.