University Project: AWM Manufacturing Budget Analysis and Report
VerifiedAdded on 2023/01/11
|13
|2928
|31
Project
AI Summary
This project analyzes the AWM Manufacturing Ltd.'s budget for 2019, comparing a base-case scenario with several simulations involving changes in sales, collections, inventory, and debt. The analysis includes detailed financial statements, comparisons of different scenarios, and recommendations for the optimal budget plan that maximizes long-term wealth. The project also incorporates break-even analysis to determine the sales volume needed for profitability, examines working capital management ratios, and briefly introduces the Balanced Scorecard as a strategic management tool. The report suggests a combined scenario of price increase, credit tightening, and inventory tightening as the optimal approach, and provides insights into dividend decisions, with the primary objective of helping AWM Manufacturing Ltd make informed financial decisions.
AWM Manufacturing Ltd.
(Preparation of the Company’s Manufacturing Budget for the year 2019 and analysis of the same with
different scenarios to find the optimal budget for the Company.
Budget Analysis
(Preparation of the Company’s Manufacturing Budget for the year 2019 and analysis of the same with
different scenarios to find the optimal budget for the Company.
Budget Analysis
Paraphrase This Document
Need a fresh take? Get an instant paraphrase of this document with our AI Paraphraser
Executive Summary
It is aptly said that creating a budget is planning and preparing for future course of action. With a planned budget, the picture becomes quite clear about
what the target is, how to reach the target, what the hurdles/obstacles are and if there are any, then how to overcome them, etc. In this project, Budget
Analysis- AWM Manufacturing Ltd., a normal forecasted budget for the year 2019 has been has been prepared on the basis of given accounting
information and analysis of the same has been done with respect to different variables like Net Sales, Collection, Inventories, Debt Cost and Net profit.
Various simulations were also performed with respect to additional information provided and resultant alternatives were then compared among
themselves along with the normal budget titled as ‘Base-case Scenario’ to provide for the optimal budget plan for the company that maximizes its
wealth in the long run.
Few suggestions have also been provided relating to the efficiency of the budget like Break-even Analysis and Working Capital Management with some
brief calculations. And lastly, a brief introduction of the Balanced Scorecard has been provided as an informational advice to leave the acceptance of this
concept and also of the budget proposal to the Management’s fine sense of judgment.
2 | P a g e
Contents
Budgeting & Its Importance........................................................................................................................................................................................................................... 4
Analysis & Implication of Base-Case & Alternatives....................................................................................................................................................................................... 5
1 and 2(a)................................................................................................................................................................................................................................................... 5
1 and 2(b)................................................................................................................................................................................................................................................... 6
1 and 2(a,b)................................................................................................................................................................................................................................................ 6
2(a) and 2(b)............................................................................................................................................................................................................................................... 6
2(a) and 2(a,b)............................................................................................................................................................................................................................................ 6
2(b) and 2(a,b)............................................................................................................................................................................................................................................ 6
Inference........................................................................................................................................................................................................................................................ 7
Decisions regarding payment of dividend.................................................................................................................................................................................................. 7
Break-even Analysis....................................................................................................................................................................................................................................... 8
Working CapitalManagment........................................................................................................................................................................................................................ 10
Elements of Working Capital Management.............................................................................................................................................................................................. 10
Working Capital Ratio........................................................................................................................................................................................................................... 10
Collection Ratio.................................................................................................................................................................................................................................... 10
Inventory Management Ratio.............................................................................................................................................................................................................. 11
Balanced Scorecard...................................................................................................................................................................................................................................... 12
Bibliography................................................................................................................................................................................................................................................. 13
3 | P a g e
⊘ This is a preview!⊘
Do you want full access?
Subscribe today to unlock all pages.
Trusted by 1+ million students worldwide
Budgeting & Its Importance
“Budgeting is the process of forecasting the future expenditures and planning to source the finance for the same. It is a planned method which ensures the company
to meet its obligations for future estimated requirements. In a nut-shell, budgeting is basically for-seeing probable future expenses and other risks and means to
procure funds to meet such expenses or mitigate risks (Rautenstrauch & Villers, 1968)”.
The importance of budgeting can be briefly discussed as follows:-
1) Since Budgeting is your plan to finance future expenses, it ensures that you have adequate funds that meet your requirements.
2) Budgeting helps you to simulate between your expenses and your revenue sources so that you don’t need to procure any loan or minimizes your cost of debt
if you want one.
3) It helps you to mark upon which areas to spend and which areas are non-vulnerable to spending.
4) It aligns the activities of different departments so that there is sound co-ordination between them which helps to achieve the organizational goal.
5) Budgeting helps to keep a control check on the actual output with the estimated numbers, thus helping to take corrective decisions on a regular basis.
6) Budgeting being a solid plan makes all the divisions work towards a common objective.
7) With an efficient and successful budget, a company achieves synergy in its efficiency maintaining the accuracy intact.
4 | P a g e
Paraphrase This Document
Need a fresh take? Get an instant paraphrase of this document with our AI Paraphraser
Analysis & Implication of Base-Case & Alternatives
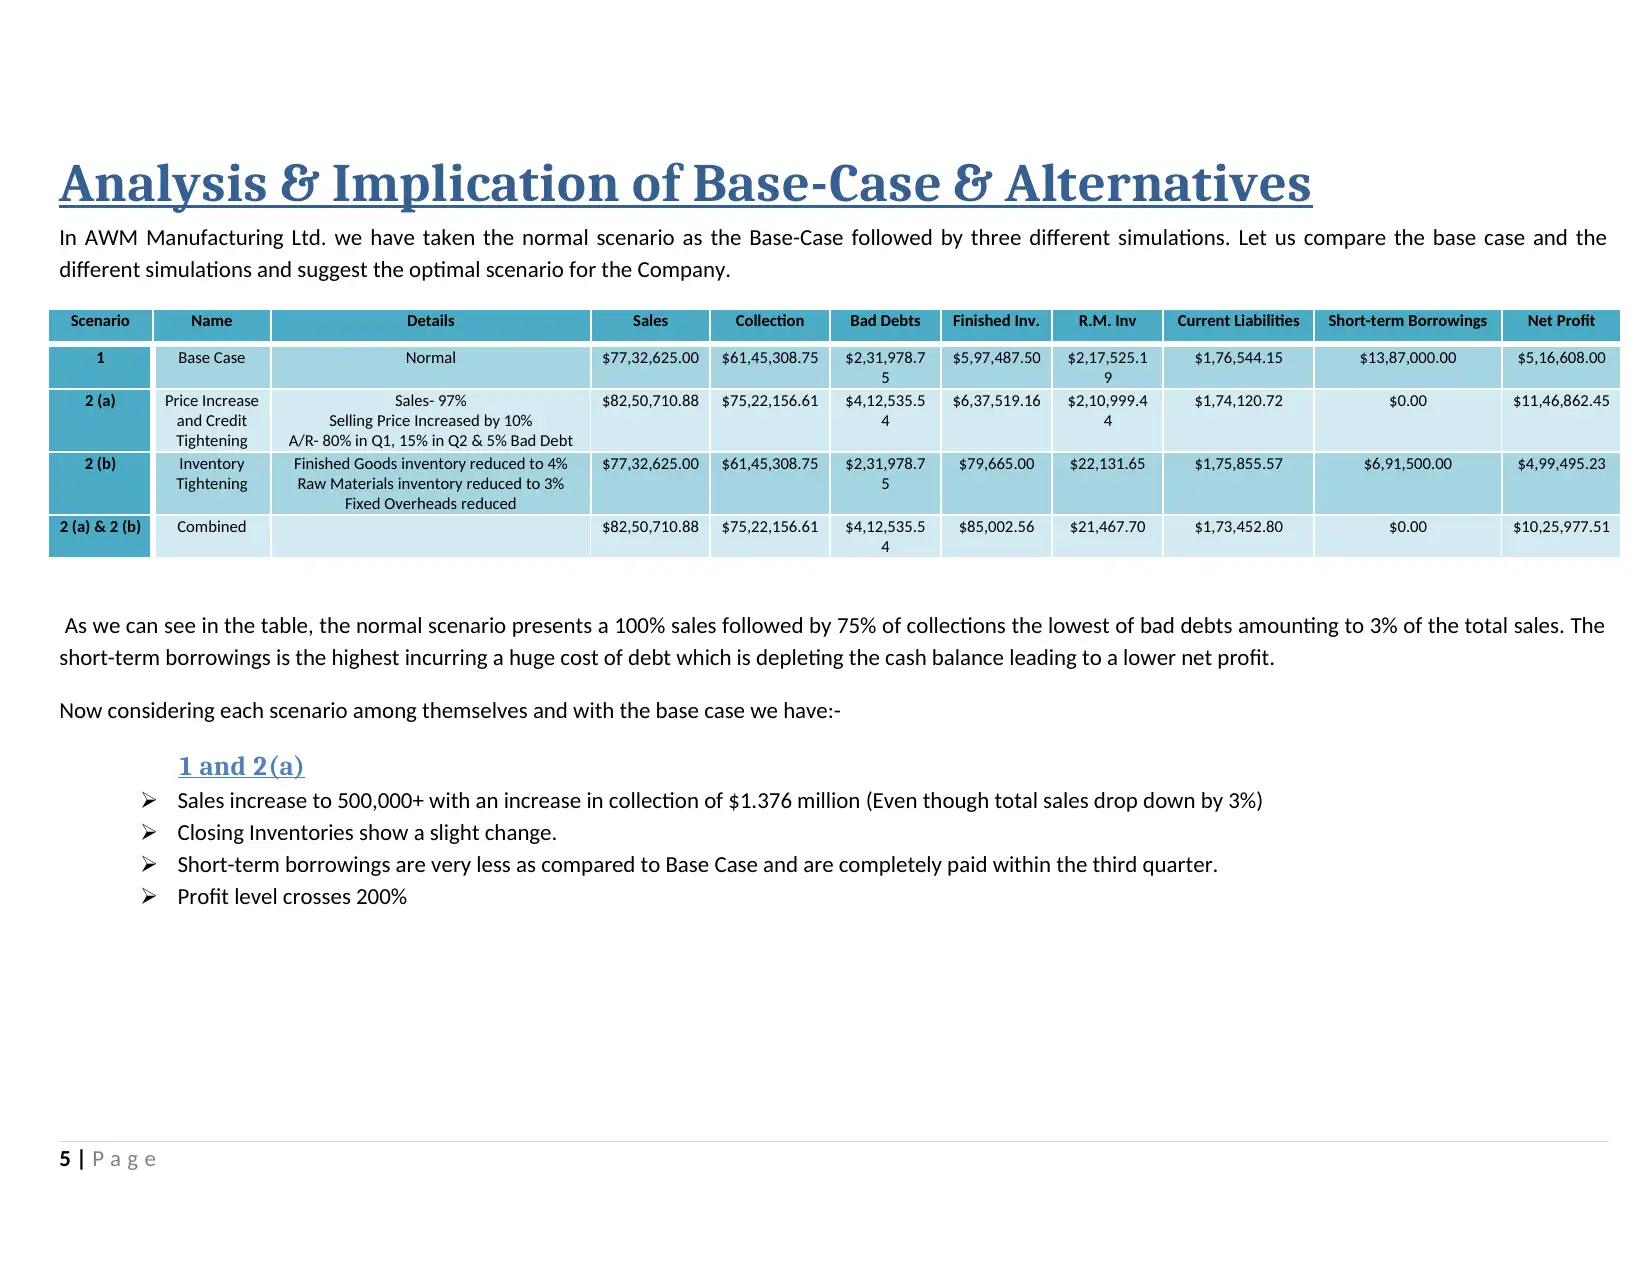
In AWM Manufacturing Ltd. we have taken the normal scenario as the Base-Case followed by three different simulations. Let us compare the base case and the
different simulations and suggest the optimal scenario for the Company.
Scenario Name Details Sales Collection Bad Debts Finished Inv. R.M. Inv Current Liabilities Short-term Borrowings Net Profit
1 Base Case Normal $77,32,625.00 $61,45,308.75 $2,31,978.7
5
$5,97,487.50 $2,17,525.1
9
$1,76,544.15 $13,87,000.00 $5,16,608.00
2 (a) Price Increase
and Credit
Tightening
Sales- 97%
Selling Price Increased by 10%
A/R- 80% in Q1, 15% in Q2 & 5% Bad Debt
$82,50,710.88 $75,22,156.61 $4,12,535.5
4
$6,37,519.16 $2,10,999.4
4
$1,74,120.72 $0.00 $11,46,862.45
2 (b) Inventory
Tightening
Finished Goods inventory reduced to 4%
Raw Materials inventory reduced to 3%
Fixed Overheads reduced
$77,32,625.00 $61,45,308.75 $2,31,978.7
5
$79,665.00 $22,131.65 $1,75,855.57 $6,91,500.00 $4,99,495.23
2 (a) & 2 (b) Combined $82,50,710.88 $75,22,156.61 $4,12,535.5
4
$85,002.56 $21,467.70 $1,73,452.80 $0.00 $10,25,977.51
As we can see in the table, the normal scenario presents a 100% sales followed by 75% of collections the lowest of bad debts amounting to 3% of the total sales. The
short-term borrowings is the highest incurring a huge cost of debt which is depleting the cash balance leading to a lower net profit.
Now considering each scenario among themselves and with the base case we have:-
1 and 2(a)
Sales increase to 500,000+ with an increase in collection of $1.376 million (Even though total sales drop down by 3%)
Closing Inventories show a slight change.
Short-term borrowings are very less as compared to Base Case and are completely paid within the third quarter.
Profit level crosses 200%
5 | P a g e
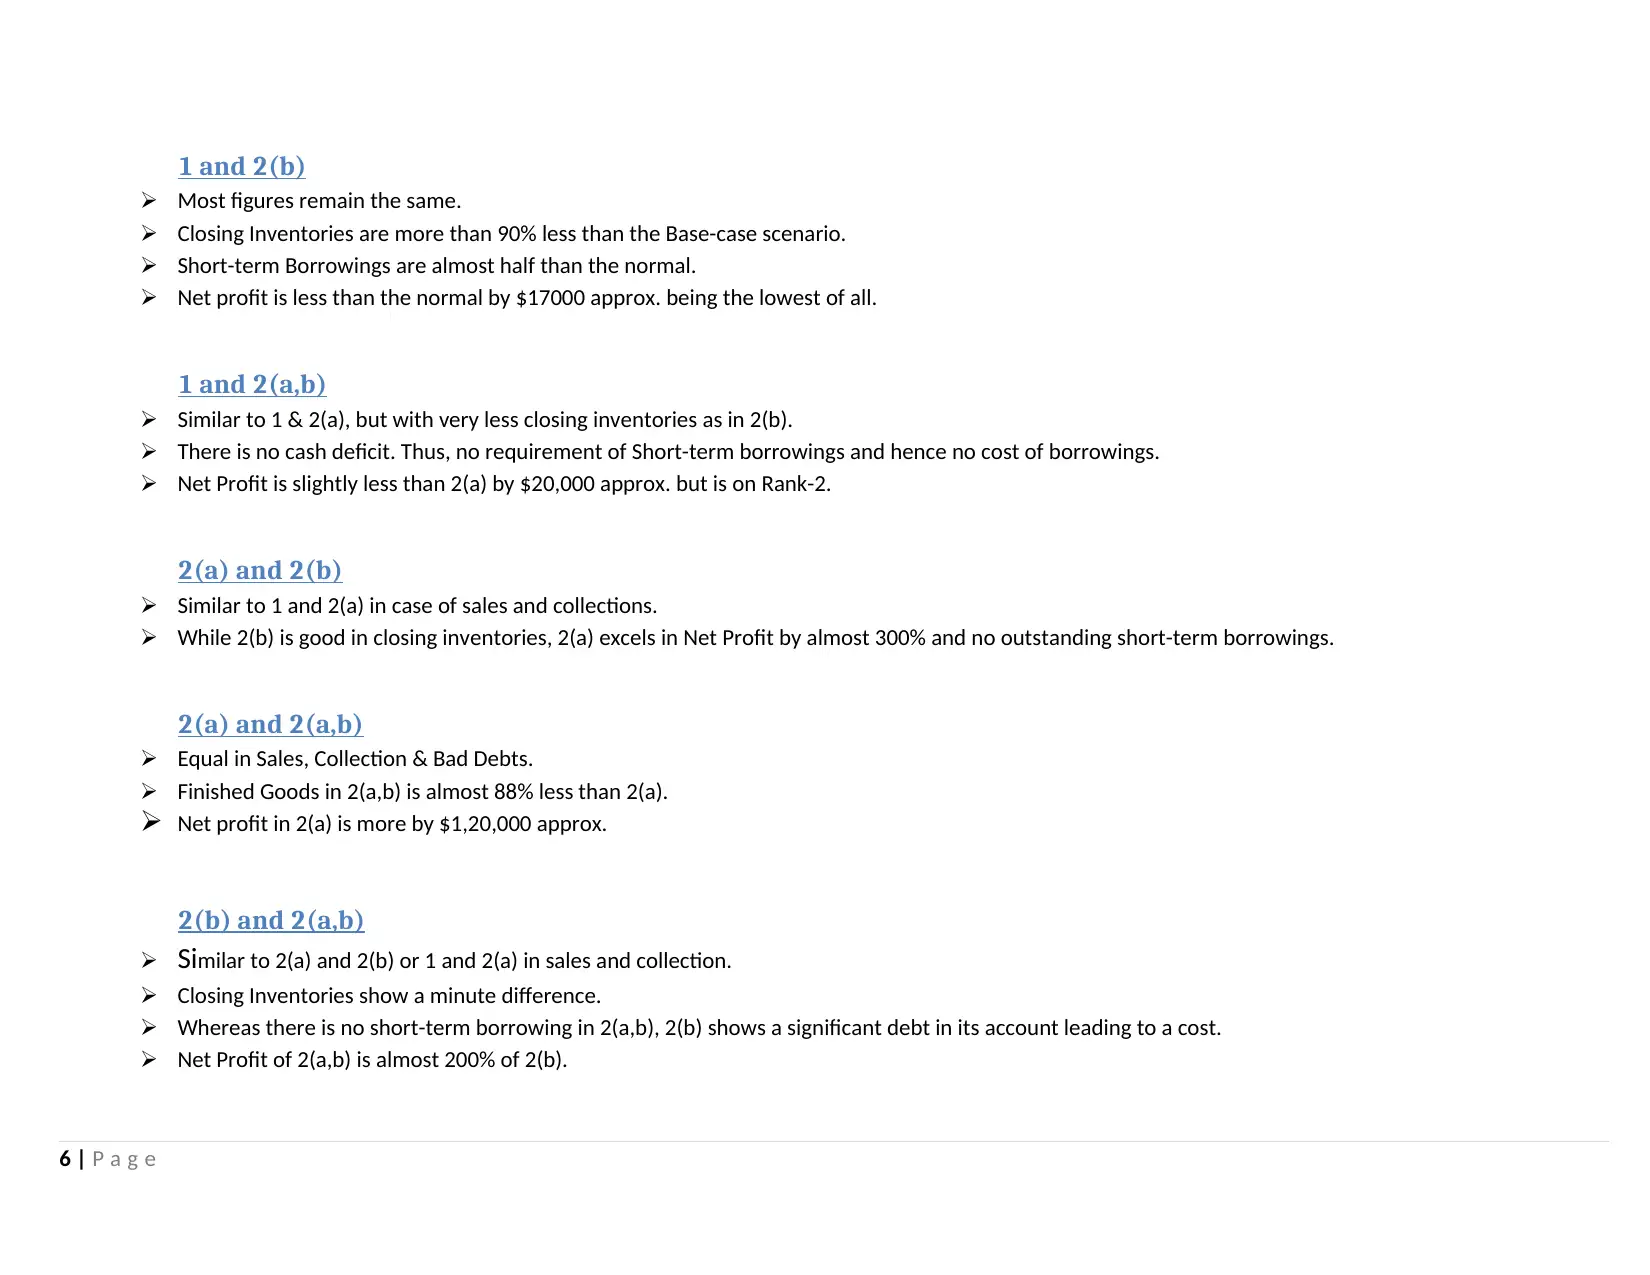
1 and 2(b)
Most figures remain the same.
Closing Inventories are more than 90% less than the Base-case scenario.
Short-term Borrowings are almost half than the normal.
Net profit is less than the normal by $17000 approx. being the lowest of all.
1 and 2(a,b)
Similar to 1 & 2(a), but with very less closing inventories as in 2(b).
There is no cash deficit. Thus, no requirement of Short-term borrowings and hence no cost of borrowings.
Net Profit is slightly less than 2(a) by $20,000 approx. but is on Rank-2.
2(a) and 2(b)
Similar to 1 and 2(a) in case of sales and collections.
While 2(b) is good in closing inventories, 2(a) excels in Net Profit by almost 300% and no outstanding short-term borrowings.
2(a) and 2(a,b)
Equal in Sales, Collection & Bad Debts.
Finished Goods in 2(a,b) is almost 88% less than 2(a).
Net profit in 2(a) is more by $1,20,000 approx.
2(b) and 2(a,b)
Similar to 2(a) and 2(b) or 1 and 2(a) in sales and collection.
Closing Inventories show a minute difference.
Whereas there is no short-term borrowing in 2(a,b), 2(b) shows a significant debt in its account leading to a cost.
Net Profit of 2(a,b) is almost 200% of 2(b).
6 | P a g e
⊘ This is a preview!⊘
Do you want full access?
Subscribe today to unlock all pages.
Trusted by 1+ million students worldwide
Inference
After comparing all the Scenarios, it is better that we select Scenario- 2(a,b) over Scenario- 2(a), i.e., combination of Price Increase and Credit Tightening and Inventory
Tightening, because of the following reasons:-
1) Both are equal in Sales, Collection & Bad Debts.
2) Though 2(a) is superior over 2(a,b) by $ 1,20,000 approx/- , still the closing inventories of 2(a,b) is very few(approx. 12%) of 2(a). This will lower down the cost
of storage and hence relieve the company from any future uncertainties that will create a hindrance from getting these inventories sold.
3) There is also no borrowing in case of 2(a,b) where it is saved from the cost of borrowing.
Decisions regarding payment of dividend
Since, this is an estimated budget of 2019; dividend as such should be kept in abeyance unless the actual figures reach near to the estimated ones. Dividends lower
down the retained earnings which is the basically the oxygen for the organization to survive in its daily operations. Again, dividends are also very important in
maintaining the trust of the shareholders. Continuous non-payment of dividends tends to lose the shareholder’s trust on the company. Hence, it is wise to payoff
lower but regular dividends keeping both the ends at balance.
7 | P a g e
Paraphrase This Document
Need a fresh take? Get an instant paraphrase of this document with our AI Paraphraser
Break-even Analysis
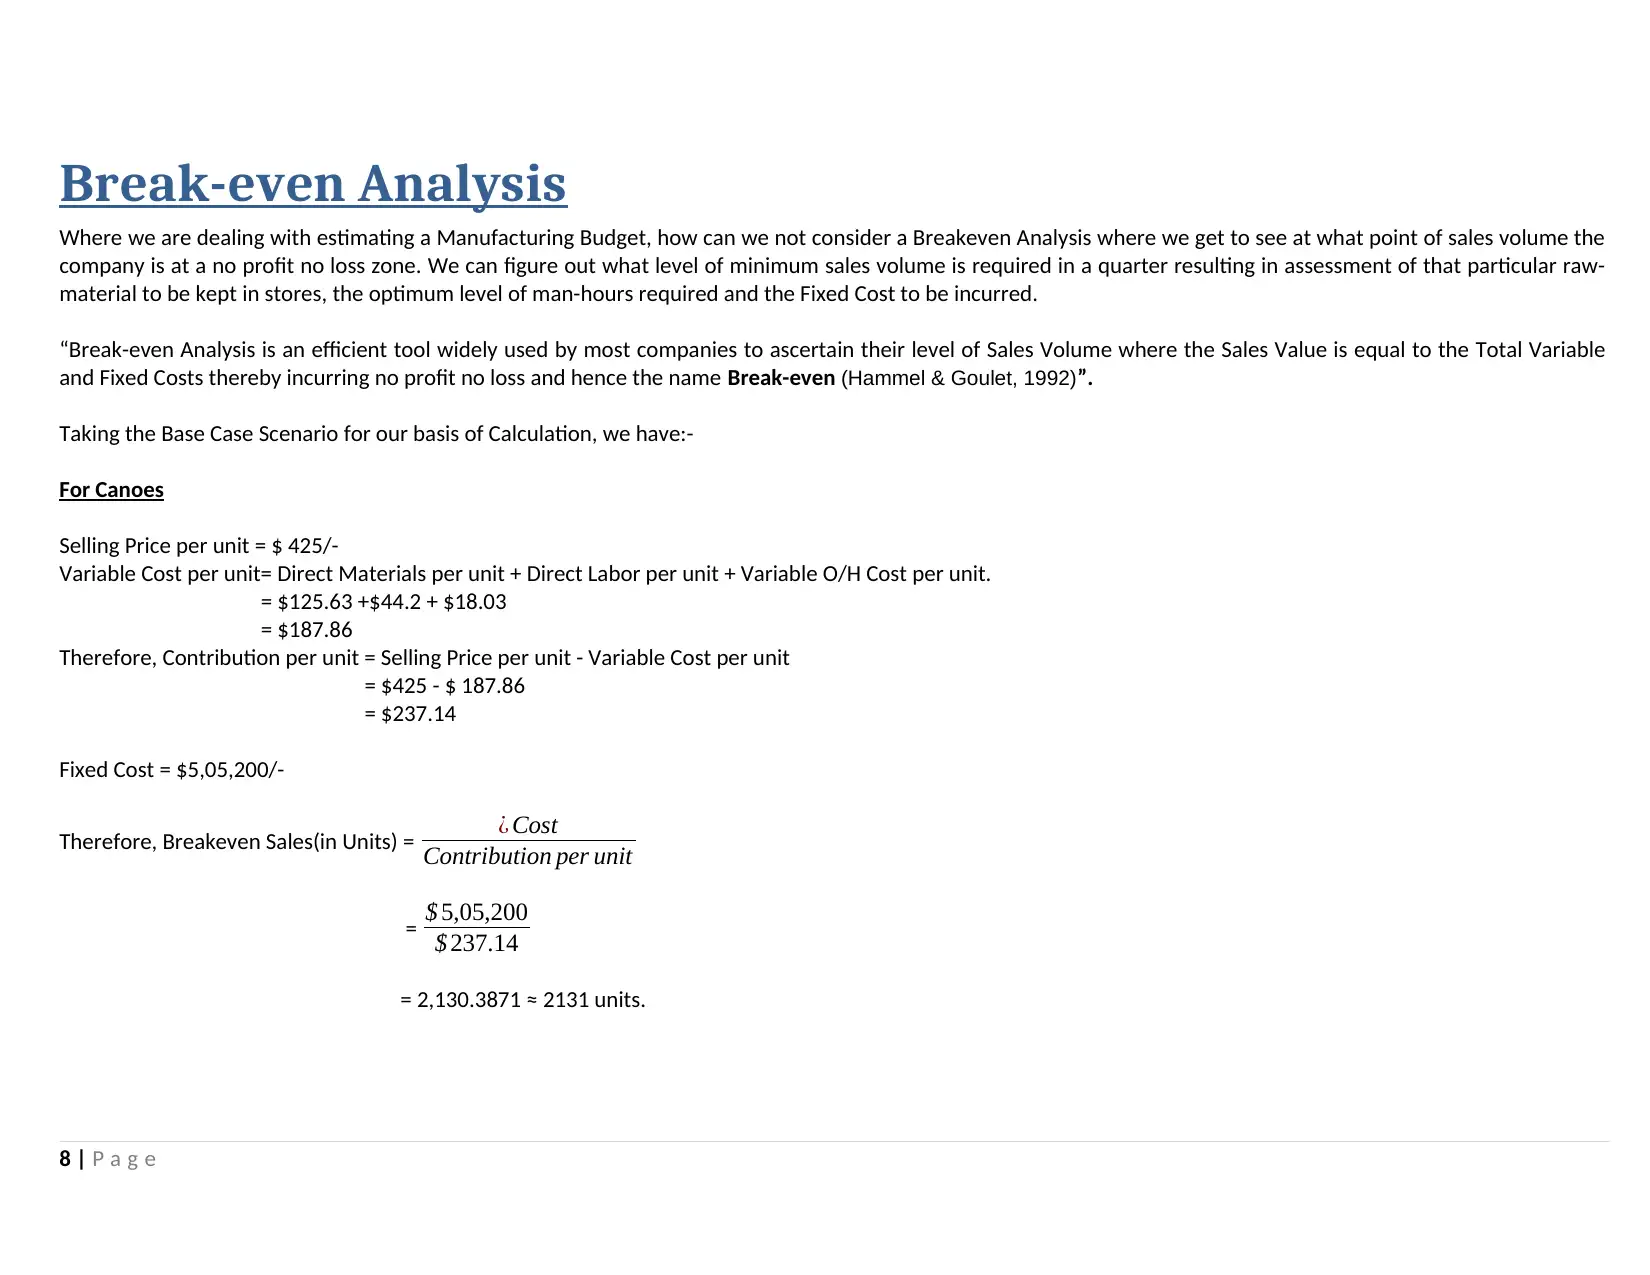
Where we are dealing with estimating a Manufacturing Budget, how can we not consider a Breakeven Analysis where we get to see at what point of sales volume the
company is at a no profit no loss zone. We can figure out what level of minimum sales volume is required in a quarter resulting in assessment of that particular raw-
material to be kept in stores, the optimum level of man-hours required and the Fixed Cost to be incurred.
“Break-even Analysis is an efficient tool widely used by most companies to ascertain their level of Sales Volume where the Sales Value is equal to the Total Variable
and Fixed Costs thereby incurring no profit no loss and hence the name Break-even (Hammel & Goulet, 1992)”.
Taking the Base Case Scenario for our basis of Calculation, we have:-
For Canoes
Selling Price per unit = $ 425/-
Variable Cost per unit= Direct Materials per unit + Direct Labor per unit + Variable O/H Cost per unit.
= $125.63 +$44.2 + $18.03
= $187.86
Therefore, Contribution per unit = Selling Price per unit - Variable Cost per unit
= $425 - $ 187.86
= $237.14
Fixed Cost = $5,05,200/-
Therefore, Breakeven Sales(in Units) = ¿ Cost
Contribution per unit
= $ 5,05,200
$ 237.14
= 2,130.3871 ≈ 2131 units.
8 | P a g e
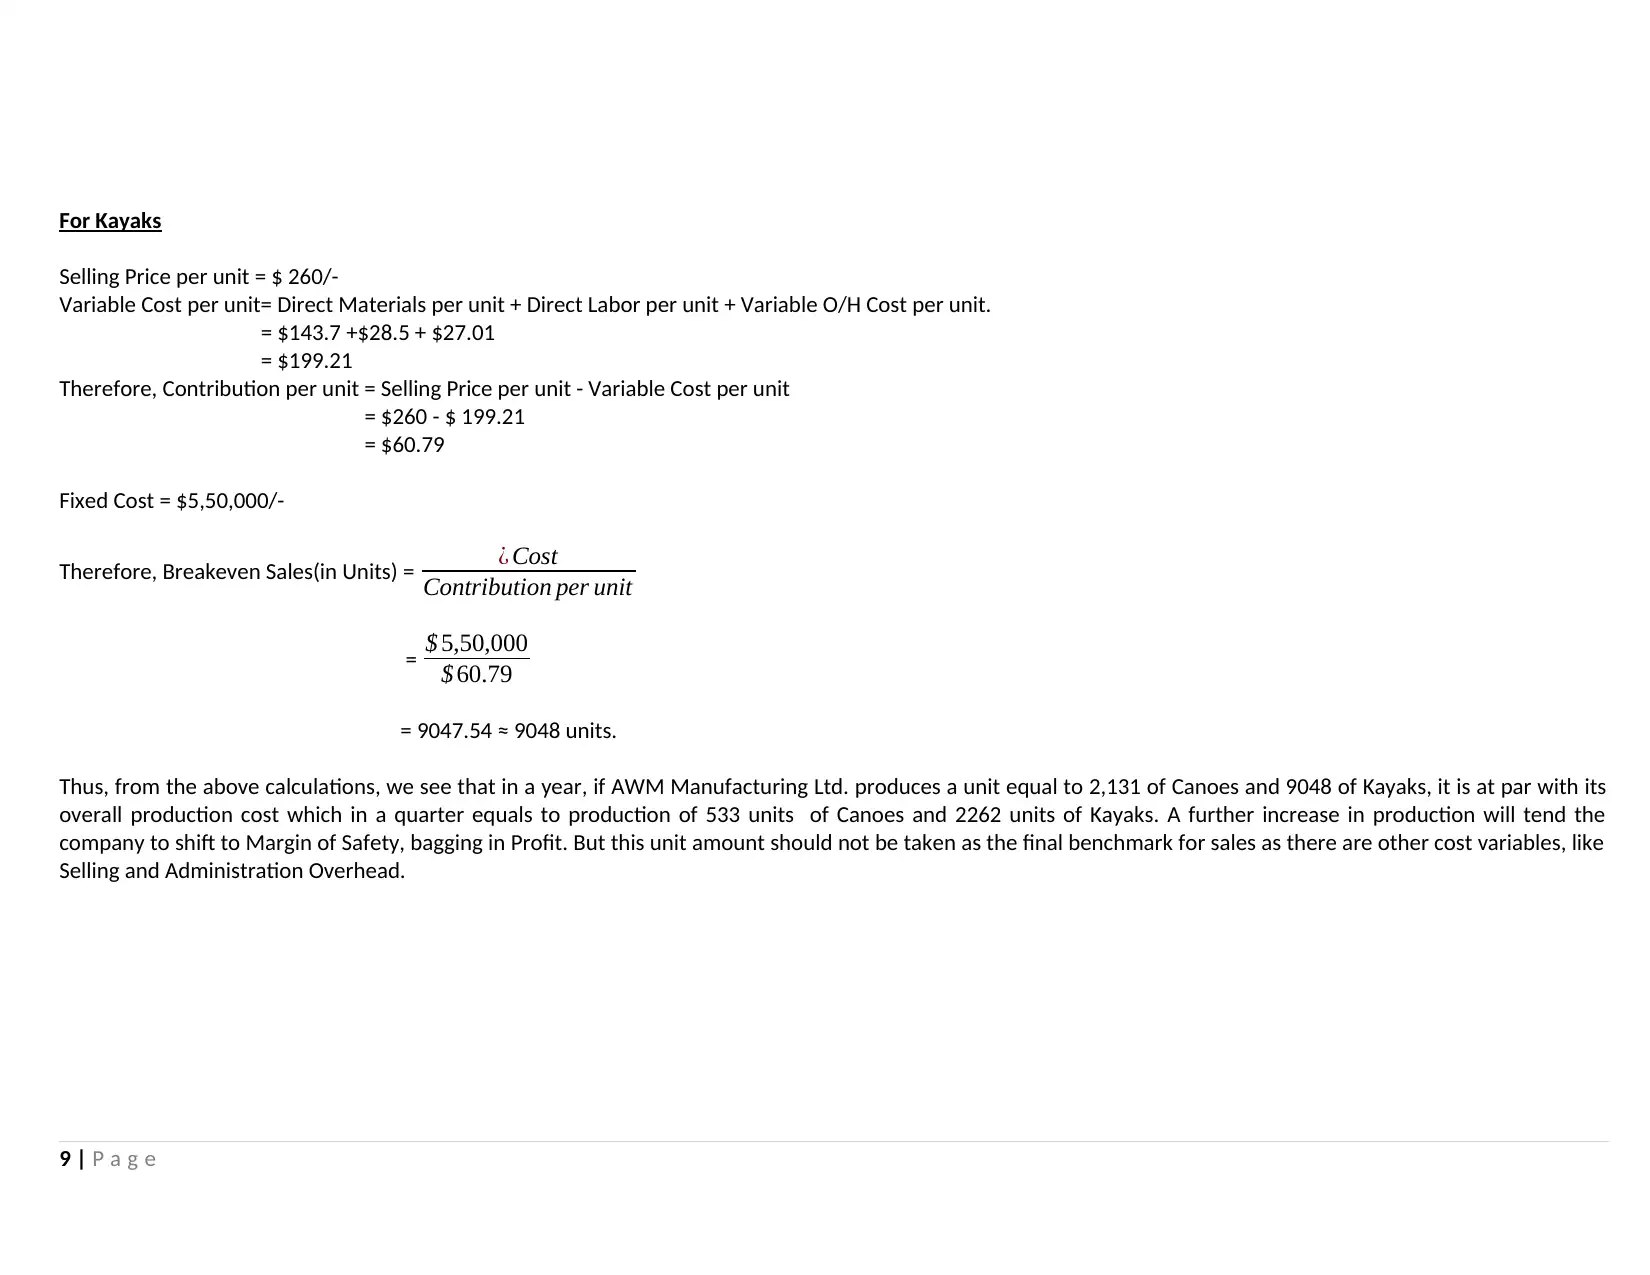
For Kayaks
Selling Price per unit = $ 260/-
Variable Cost per unit= Direct Materials per unit + Direct Labor per unit + Variable O/H Cost per unit.
= $143.7 +$28.5 + $27.01
= $199.21
Therefore, Contribution per unit = Selling Price per unit - Variable Cost per unit
= $260 - $ 199.21
= $60.79
Fixed Cost = $5,50,000/-
Therefore, Breakeven Sales(in Units) = ¿ Cost
Contribution per unit
= $ 5,50,000
$ 60.79
= 9047.54 ≈ 9048 units.
Thus, from the above calculations, we see that in a year, if AWM Manufacturing Ltd. produces a unit equal to 2,131 of Canoes and 9048 of Kayaks, it is at par with its
overall production cost which in a quarter equals to production of 533 units of Canoes and 2262 units of Kayaks. A further increase in production will tend the
company to shift to Margin of Safety, bagging in Profit. But this unit amount should not be taken as the final benchmark for sales as there are other cost variables, like
Selling and Administration Overhead.
9 | P a g e
⊘ This is a preview!⊘
Do you want full access?
Subscribe today to unlock all pages.
Trusted by 1+ million students worldwide
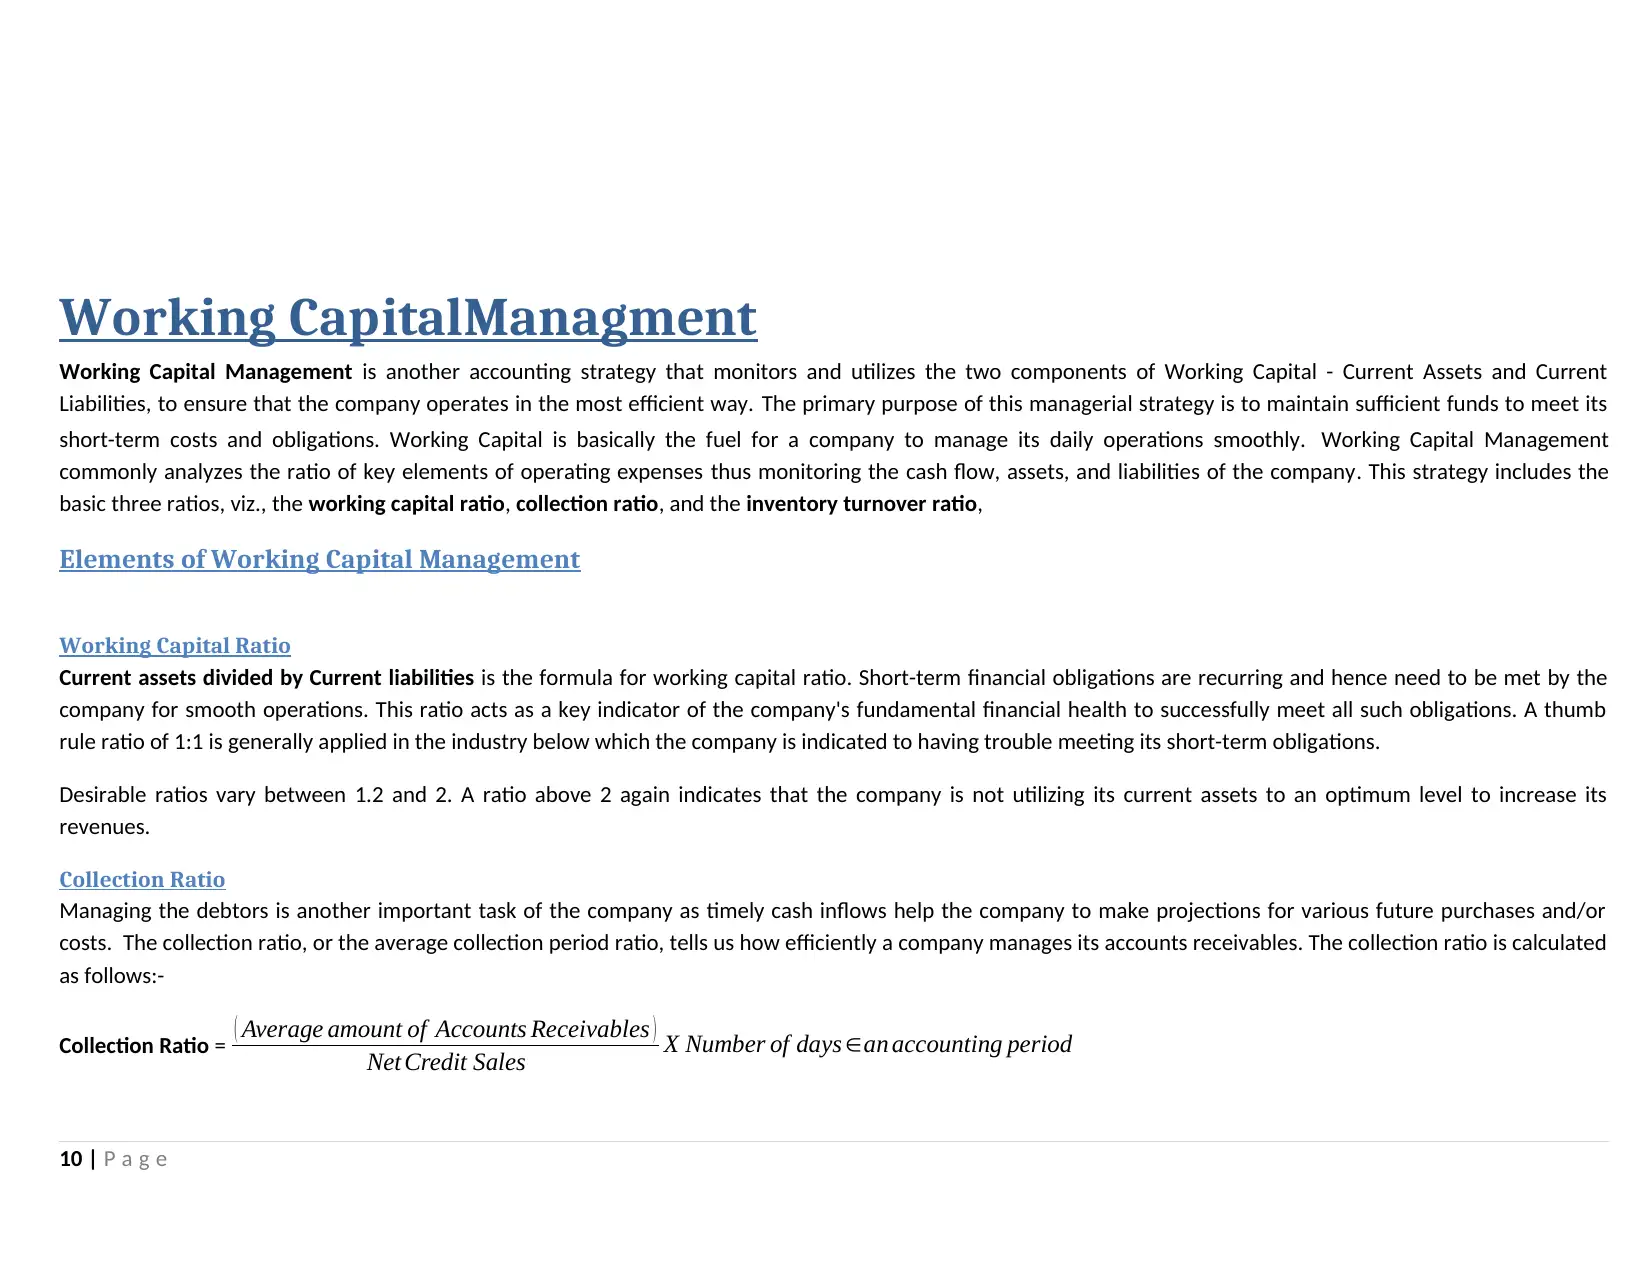
Working CapitalManagment
Working Capital Management is another accounting strategy that monitors and utilizes the two components of Working Capital - Current Assets and Current
Liabilities, to ensure that the company operates in the most efficient way. The primary purpose of this managerial strategy is to maintain sufficient funds to meet its
short-term costs and obligations. Working Capital is basically the fuel for a company to manage its daily operations smoothly. Working Capital Management
commonly analyzes the ratio of key elements of operating expenses thus monitoring the cash flow, assets, and liabilities of the company. This strategy includes the
basic three ratios, viz., the working capital ratio, collection ratio, and the inventory turnover ratio,
Elements of Working Capital Management
Working Capital Ratio
Current assets divided by Current liabilities is the formula for working capital ratio. Short-term financial obligations are recurring and hence need to be met by the
company for smooth operations. This ratio acts as a key indicator of the company's fundamental financial health to successfully meet all such obligations. A thumb
rule ratio of 1:1 is generally applied in the industry below which the company is indicated to having trouble meeting its short-term obligations.
Desirable ratios vary between 1.2 and 2. A ratio above 2 again indicates that the company is not utilizing its current assets to an optimum level to increase its
revenues.
Collection Ratio
Managing the debtors is another important task of the company as timely cash inflows help the company to make projections for various future purchases and/or
costs. The collection ratio, or the average collection period ratio, tells us how efficiently a company manages its accounts receivables. The collection ratio is calculated
as follows:-
Collection Ratio = ( Average amount of Accounts Receivables )
Net Credit Sales X Number of days ∈an accounting period
10 | P a g e
Paraphrase This Document
Need a fresh take? Get an instant paraphrase of this document with our AI Paraphraser
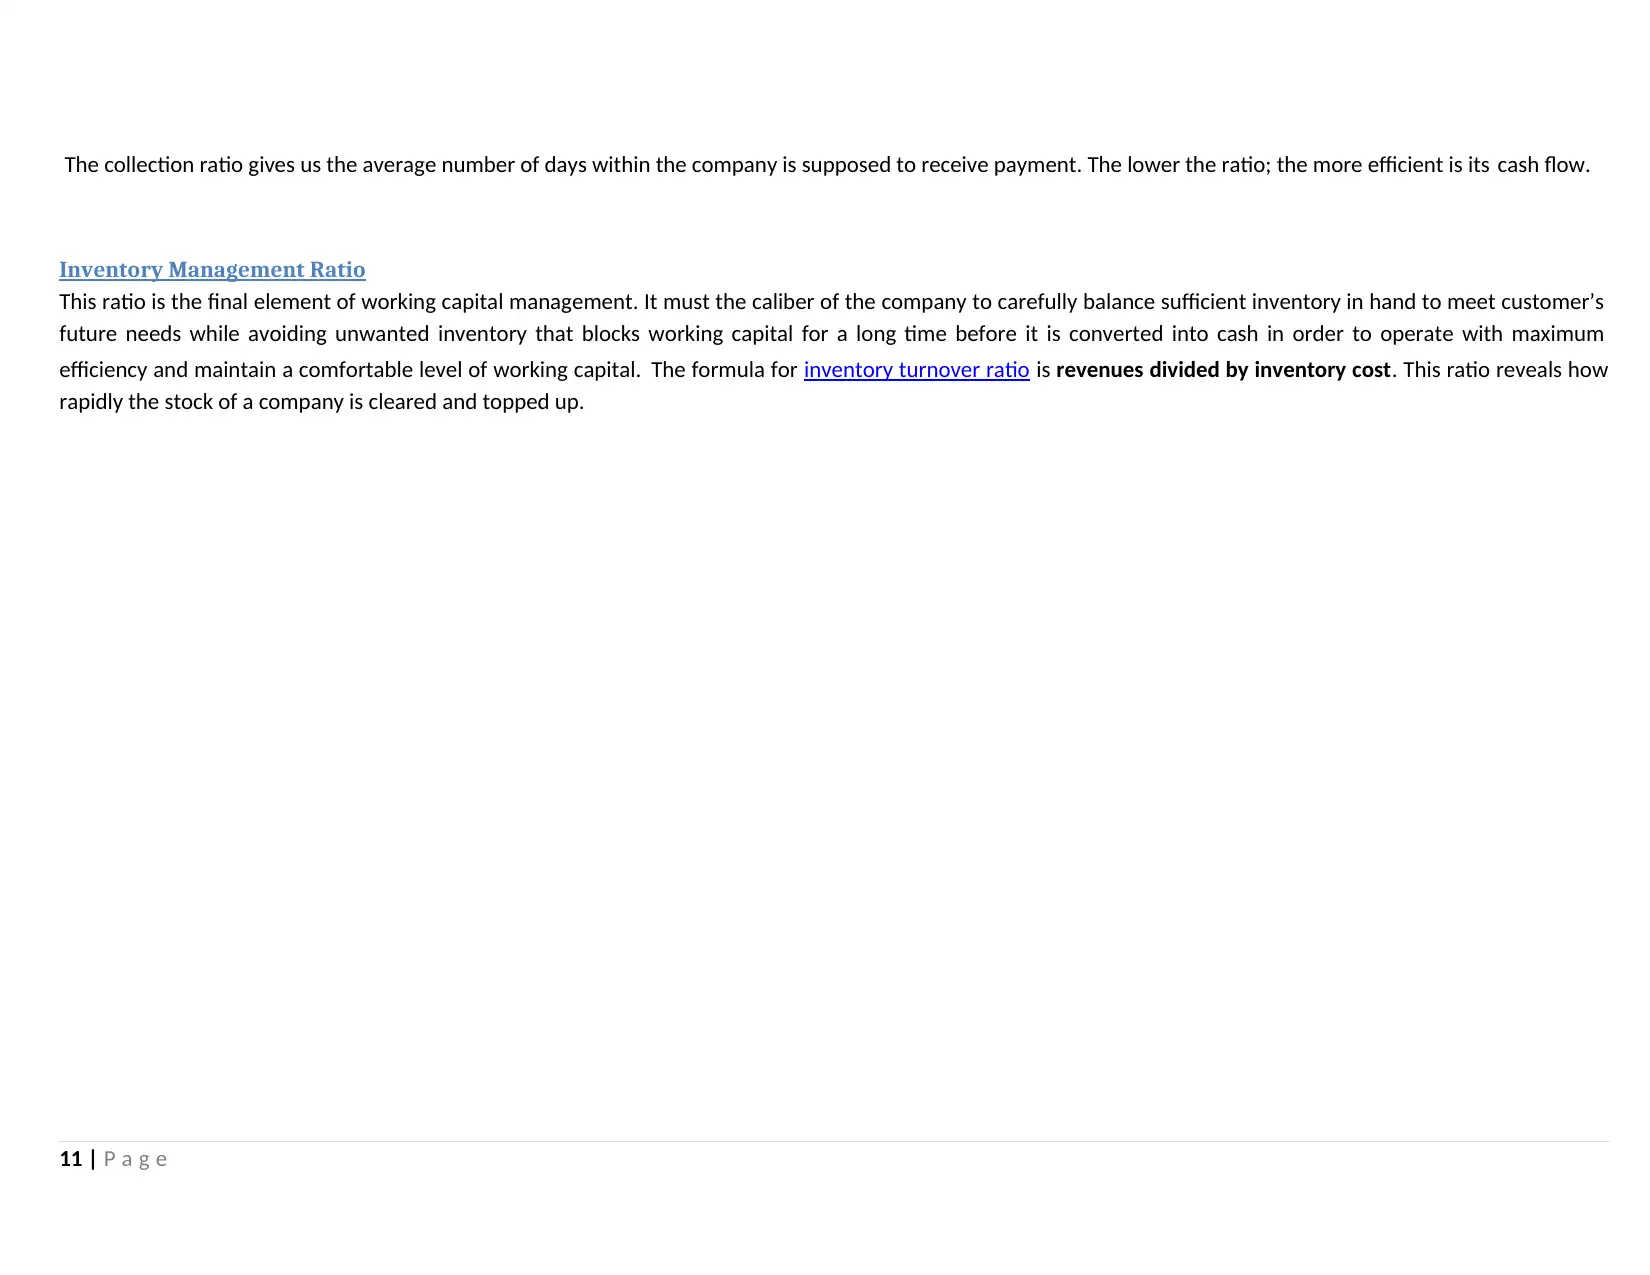
The collection ratio gives us the average number of days within the company is supposed to receive payment. The lower the ratio; the more efficient is its cash flow.
Inventory Management Ratio
This ratio is the final element of working capital management. It must the caliber of the company to carefully balance sufficient inventory in hand to meet customer’s
future needs while avoiding unwanted inventory that blocks working capital for a long time before it is converted into cash in order to operate with maximum
efficiency and maintain a comfortable level of working capital. The formula for inventory turnover ratio is revenues divided by inventory cost. This ratio reveals how
rapidly the stock of a company is cleared and topped up.
11 | P a g e
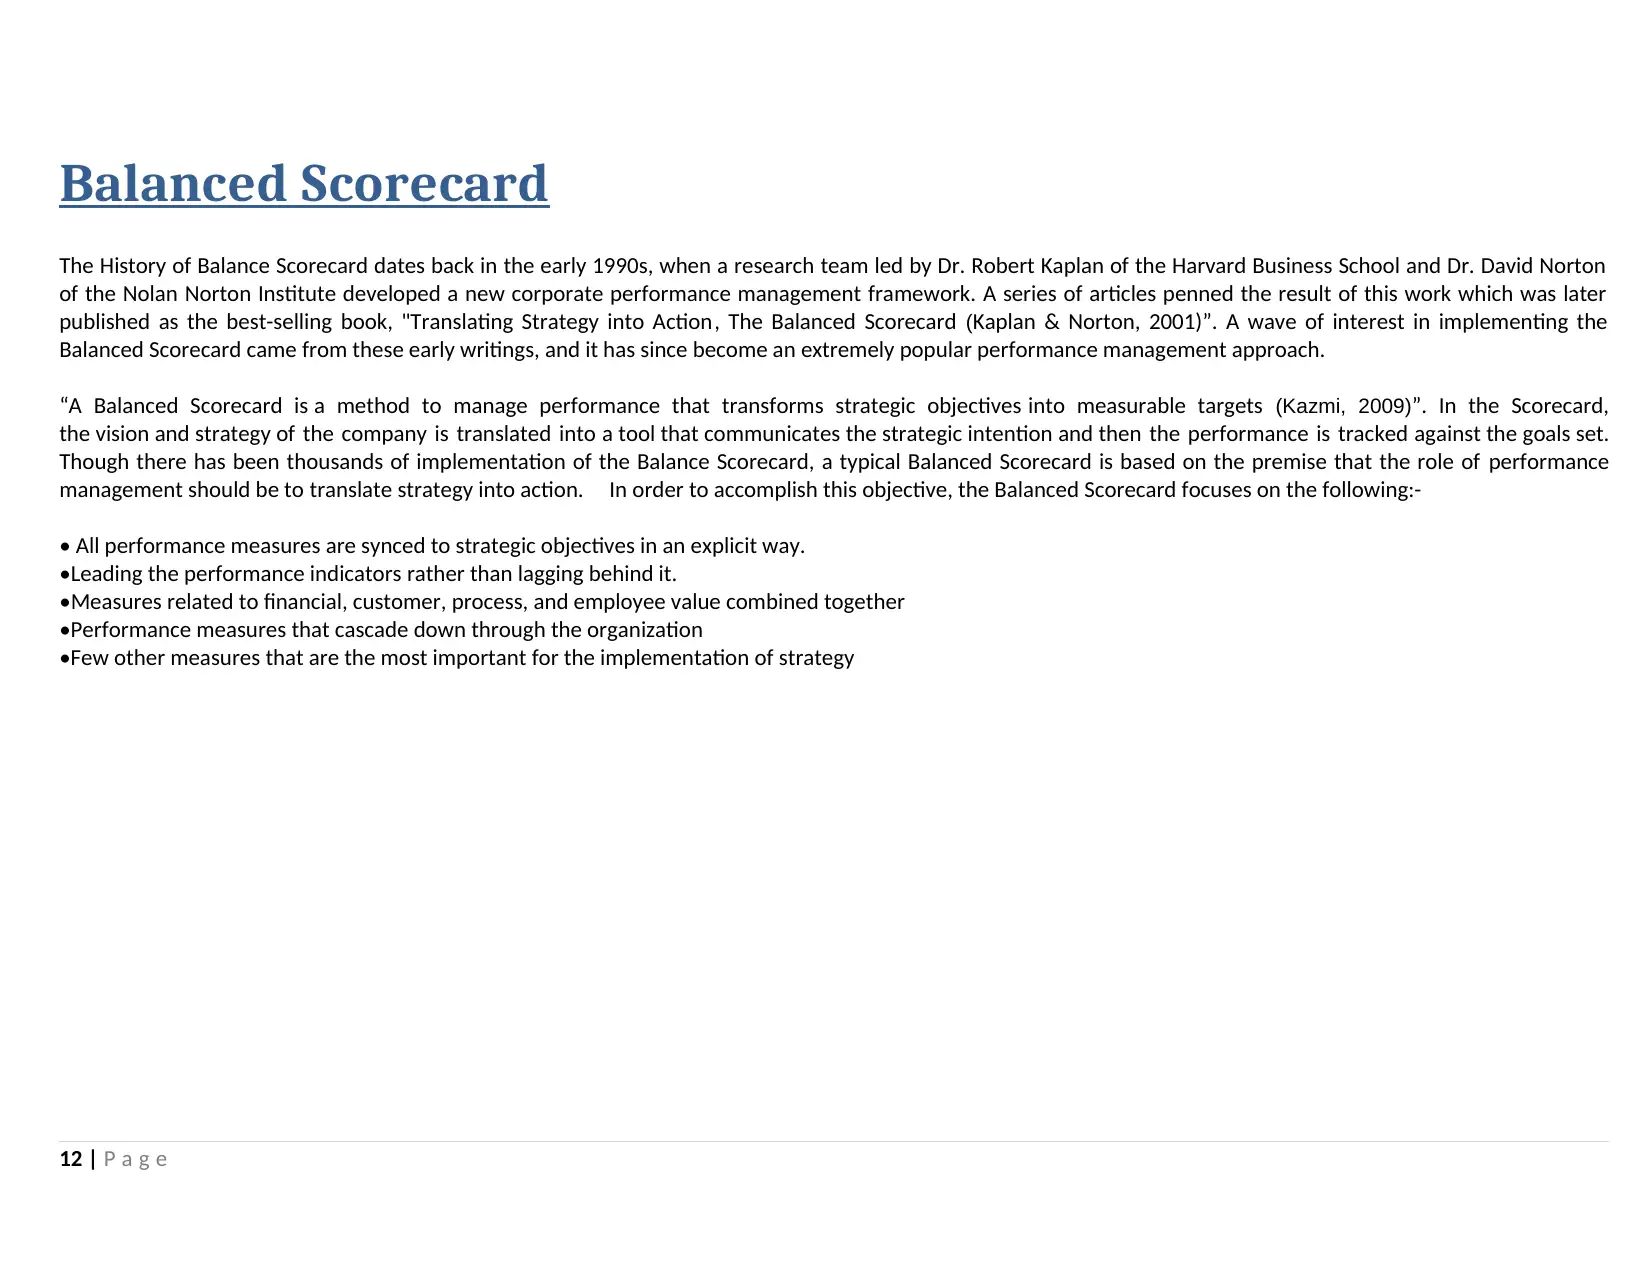
Balanced Scorecard
The History of Balance Scorecard dates back in the early 1990s, when a research team led by Dr. Robert Kaplan of the Harvard Business School and Dr. David Norton
of the Nolan Norton Institute developed a new corporate performance management framework. A series of articles penned the result of this work which was later
published as the best-selling book, "Translating Strategy into Action, The Balanced Scorecard (Kaplan & Norton, 2001)”. A wave of interest in implementing the
Balanced Scorecard came from these early writings, and it has since become an extremely popular performance management approach.
“A Balanced Scorecard is a method to manage performance that transforms strategic objectives into measurable targets (Kazmi, 2009)”. In the Scorecard,
the vision and strategy of the company is translated into a tool that communicates the strategic intention and then the performance is tracked against the goals set.
Though there has been thousands of implementation of the Balance Scorecard, a typical Balanced Scorecard is based on the premise that the role of performance
management should be to translate strategy into action. In order to accomplish this objective, the Balanced Scorecard focuses on the following:-
• All performance measures are synced to strategic objectives in an explicit way.
•Leading the performance indicators rather than lagging behind it.
•Measures related to financial, customer, process, and employee value combined together
•Performance measures that cascade down through the organization
•Few other measures that are the most important for the implementation of strategy
12 | P a g e
⊘ This is a preview!⊘
Do you want full access?
Subscribe today to unlock all pages.
Trusted by 1+ million students worldwide
1 out of 13
Related Documents


Your All-in-One AI-Powered Toolkit for Academic Success.
+13062052269
info@desklib.com
Available 24*7 on WhatsApp / Email
![[object Object]](/_next/static/media/star-bottom.7253800d.svg)
Unlock your academic potential
Copyright © 2020–2026 A2Z Services. All Rights Reserved. Developed and managed by ZUCOL.