Financial Analysis Report: Comparing Axiata and Maxis Communication
VerifiedAdded on 2023/06/10
|22
|4563
|346
Report
AI Summary
This report presents a financial analysis of Axiata and Maxis Communications, two major telecommunication companies in Malaysia. The analysis employs ratio analysis to compare their financial performance over a five-year period, focusing on profitability (net profit margin, return on assets, return on equity), liquidity (current ratio, quick ratio, cash ratio), and solvency (debt to equity ratio, equity ratio, debt ratio). The report evaluates the efficiency of each company in managing its assets, meeting short-term obligations, and managing its capital structure. The findings reveal insights into the relative strengths and weaknesses of Axiata and Maxis, providing a comprehensive overview of their financial health and operational efficiency, with Maxis generally demonstrating stronger profitability metrics. The report includes detailed tables, figures, and discussions to support the analysis, concluding with recommendations for further improvement and strategic considerations.

Running head: FINANCIAL ANALYSIS
Financial analysis
Name of the Student
Name of the University
Author Note
Financial analysis
Name of the Student
Name of the University
Author Note
Paraphrase This Document
Need a fresh take? Get an instant paraphrase of this document with our AI Paraphraser
FINANCIAL ANALYSIS
Table of Contents
Table of figures:.........................................................................................................................2
Introduction:...............................................................................................................................3
Discussion:.................................................................................................................................4
Comparing and analyzing the financial performance of Axiata and Maxis Communication:...4
Identification of strategic and operational issues of companies:.............................................15
Recommendation:....................................................................................................................17
Conclusion:..............................................................................................................................18
Bibliography and References list:............................................................................................19
FINANCIAL ANALYSIS
Table of figures:
Figure 1: Net profit margin........................................................................................................6
Figure 2: Return on total assets..................................................................................................7
Figure 3: Return on equity.........................................................................................................8
Figure 4: Current ratio................................................................................................................9
Figure 5: Quick ratio................................................................................................................10
Figure 6: Cash ratio..................................................................................................................10
Figure 7: Debt to equity ratio...................................................................................................11
Figure 8: Equity ratio...............................................................................................................12
Figure 9: Debt ratio..................................................................................................................13
Figure 10: Days sales outstanding............................................................................................14
Figure 11: Total assets turnover...............................................................................................14
Figure 12: Fixed asset turnover................................................................................................15
⊘ This is a preview!⊘
Do you want full access?
Subscribe today to unlock all pages.
Trusted by 1+ million students worldwide
FINANCIAL ANALYSIS
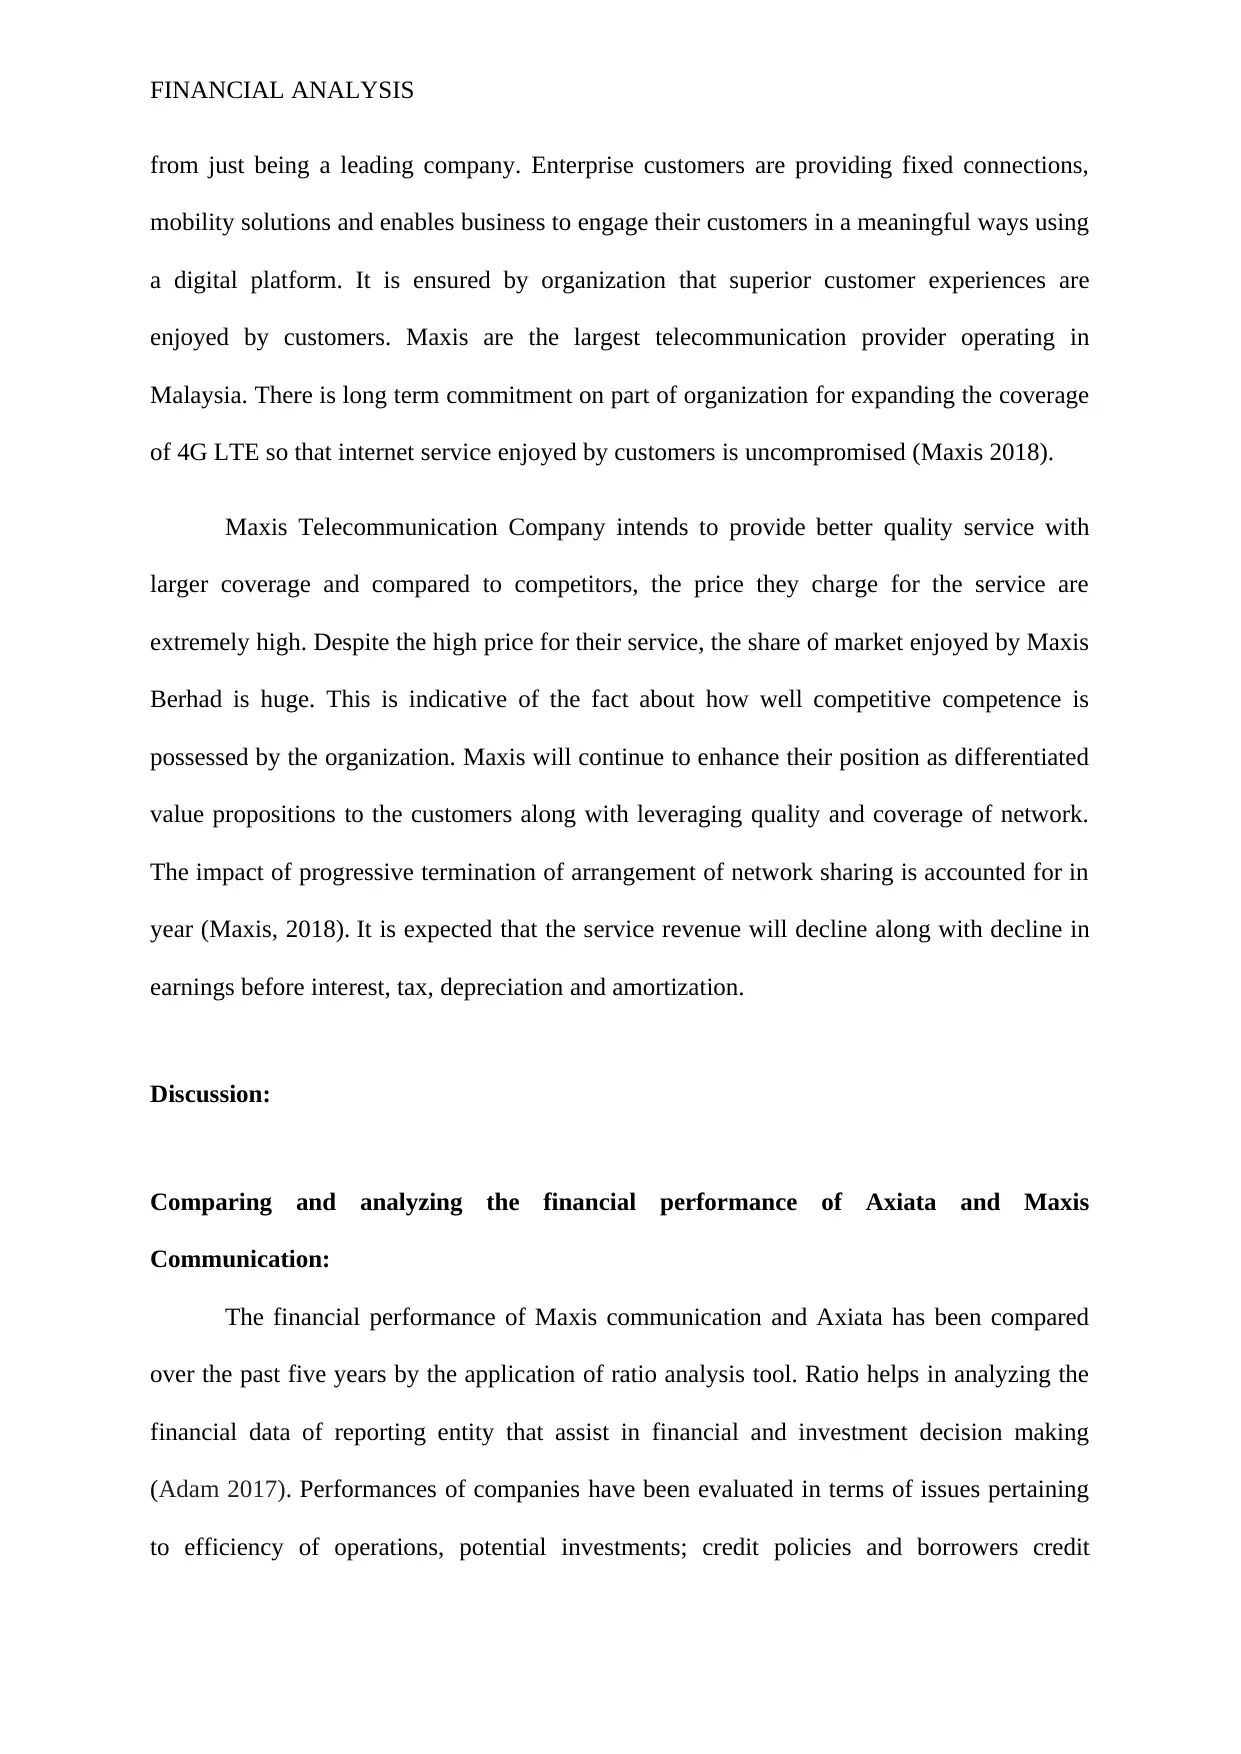
Introduction:
The report is prepared to evaluate the financial performance of companies listed on
Bursa Malaysia. For this purpose, two companies have been chosen from telecommunication
sector and these two companies include Axiata which is the main company and Maxis
communication being the competitor. Axiata is the leading telecommunication group
operating in Asia that has investment in network infrastructure, mobile network operations
and digital internet companies that serves approximately 350 million subscribers in eleven
countries across the region (Axiata.com 2018). It has placed itself as leader in the
telecommunication market of Malaysia. In terms of revenue, Axiata is the biggest mobile
operator and has the plan of making its tower unit of the five biggest worlds by year 2020.
This telecom company combines together the best in the region in terms of connection,
innovating and talent. A range of innovative telecommunications services is provided by
organization and products along with having a diverse portfolio in communication
infrastructure, mobile network and digital services. There are six mobile operators in which
Axiata has controlling operators under the brand names XL in Asia, Celcom in Malaysia,
Robl in Bangladesh, Dialog in Sri Lanka, Ncell in Nepal and smart in Combodia and have
strategic interest in M1 in Singapore and Idea in India (Axiata.com 2018). Axiata Digital was
established by company in year 2012 for capturing rapid growth in internet business. A
portfolio of twenty nine digital brands including seven joint ventures and three subsidiaries
are built by Axiata digital that helps in servicing growing demand in mobile advertising,
mobile money, entertainment, e commerce and education.
Maxis communication is obsessed with providing constantly expanding universe of
digital applications with the best access. Organization continuously evolves to provide
customers with unrivalled suite of end to end communications and innovative experience
Paraphrase This Document
Need a fresh take? Get an instant paraphrase of this document with our AI Paraphraser
FINANCIAL ANALYSIS
from just being a leading company. Enterprise customers are providing fixed connections,
mobility solutions and enables business to engage their customers in a meaningful ways using
a digital platform. It is ensured by organization that superior customer experiences are
enjoyed by customers. Maxis are the largest telecommunication provider operating in
Malaysia. There is long term commitment on part of organization for expanding the coverage
of 4G LTE so that internet service enjoyed by customers is uncompromised (Maxis 2018).
Maxis Telecommunication Company intends to provide better quality service with
larger coverage and compared to competitors, the price they charge for the service are
extremely high. Despite the high price for their service, the share of market enjoyed by Maxis
Berhad is huge. This is indicative of the fact about how well competitive competence is
possessed by the organization. Maxis will continue to enhance their position as differentiated
value propositions to the customers along with leveraging quality and coverage of network.
The impact of progressive termination of arrangement of network sharing is accounted for in
year (Maxis, 2018). It is expected that the service revenue will decline along with decline in
earnings before interest, tax, depreciation and amortization.
Discussion:
Comparing and analyzing the financial performance of Axiata and Maxis
Communication:
The financial performance of Maxis communication and Axiata has been compared
over the past five years by the application of ratio analysis tool. Ratio helps in analyzing the
financial data of reporting entity that assist in financial and investment decision making
(Adam 2017). Performances of companies have been evaluated in terms of issues pertaining
to efficiency of operations, potential investments; credit policies and borrowers credit
FINANCIAL ANALYSIS
worthiness. Evaluation of company’s financial performance using ratio analysis has been
done in terms of efficiency, liquidity, solvency and profitability position.
The profitability positions of companies have been evaluated by the computation of
net profit margin, return on total assets and return on equity. This ratio helps in measuring the
efficiency of firms in generating profits.
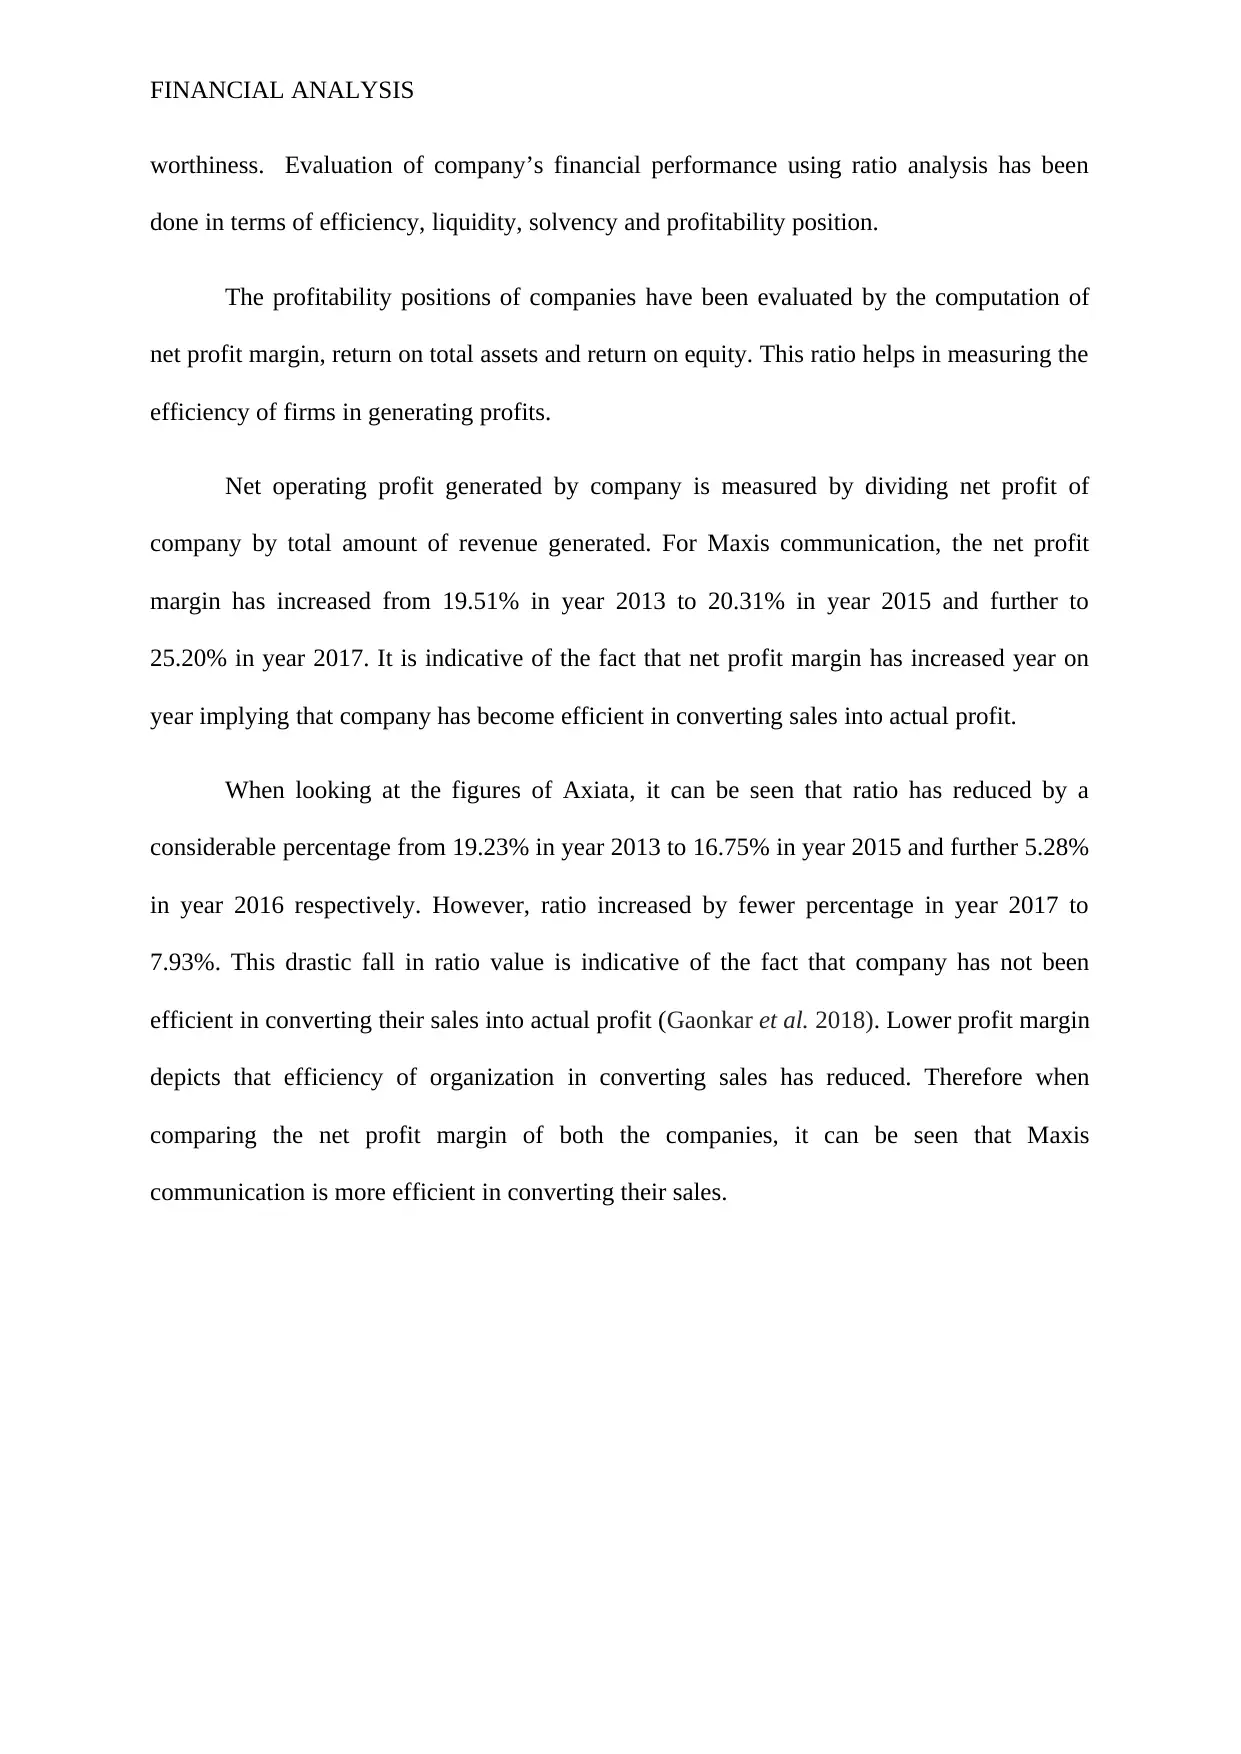
Net operating profit generated by company is measured by dividing net profit of
company by total amount of revenue generated. For Maxis communication, the net profit
margin has increased from 19.51% in year 2013 to 20.31% in year 2015 and further to
25.20% in year 2017. It is indicative of the fact that net profit margin has increased year on
year implying that company has become efficient in converting sales into actual profit.
When looking at the figures of Axiata, it can be seen that ratio has reduced by a
considerable percentage from 19.23% in year 2013 to 16.75% in year 2015 and further 5.28%
in year 2016 respectively. However, ratio increased by fewer percentage in year 2017 to
7.93%. This drastic fall in ratio value is indicative of the fact that company has not been
efficient in converting their sales into actual profit (Gaonkar et al. 2018). Lower profit margin
depicts that efficiency of organization in converting sales has reduced. Therefore when
comparing the net profit margin of both the companies, it can be seen that Maxis
communication is more efficient in converting their sales.
worthiness. Evaluation of company’s financial performance using ratio analysis has been
done in terms of efficiency, liquidity, solvency and profitability position.
The profitability positions of companies have been evaluated by the computation of
net profit margin, return on total assets and return on equity. This ratio helps in measuring the
efficiency of firms in generating profits.
Net operating profit generated by company is measured by dividing net profit of
company by total amount of revenue generated. For Maxis communication, the net profit
margin has increased from 19.51% in year 2013 to 20.31% in year 2015 and further to
25.20% in year 2017. It is indicative of the fact that net profit margin has increased year on
year implying that company has become efficient in converting sales into actual profit.
When looking at the figures of Axiata, it can be seen that ratio has reduced by a
considerable percentage from 19.23% in year 2013 to 16.75% in year 2015 and further 5.28%
in year 2016 respectively. However, ratio increased by fewer percentage in year 2017 to
7.93%. This drastic fall in ratio value is indicative of the fact that company has not been
efficient in converting their sales into actual profit (Gaonkar et al. 2018). Lower profit margin
depicts that efficiency of organization in converting sales has reduced. Therefore when
comparing the net profit margin of both the companies, it can be seen that Maxis
communication is more efficient in converting their sales.
⊘ This is a preview!⊘
Do you want full access?
Subscribe today to unlock all pages.
Trusted by 1+ million students worldwide
FINANCIAL ANALYSIS
2017 2016 2015 2014 2013
0.00%
5.00%
10.00%
15.00%
20.00%
25.00%
30.00%
Net Profit Margin
Maxis Axiata
Figure 1: Net profit margin
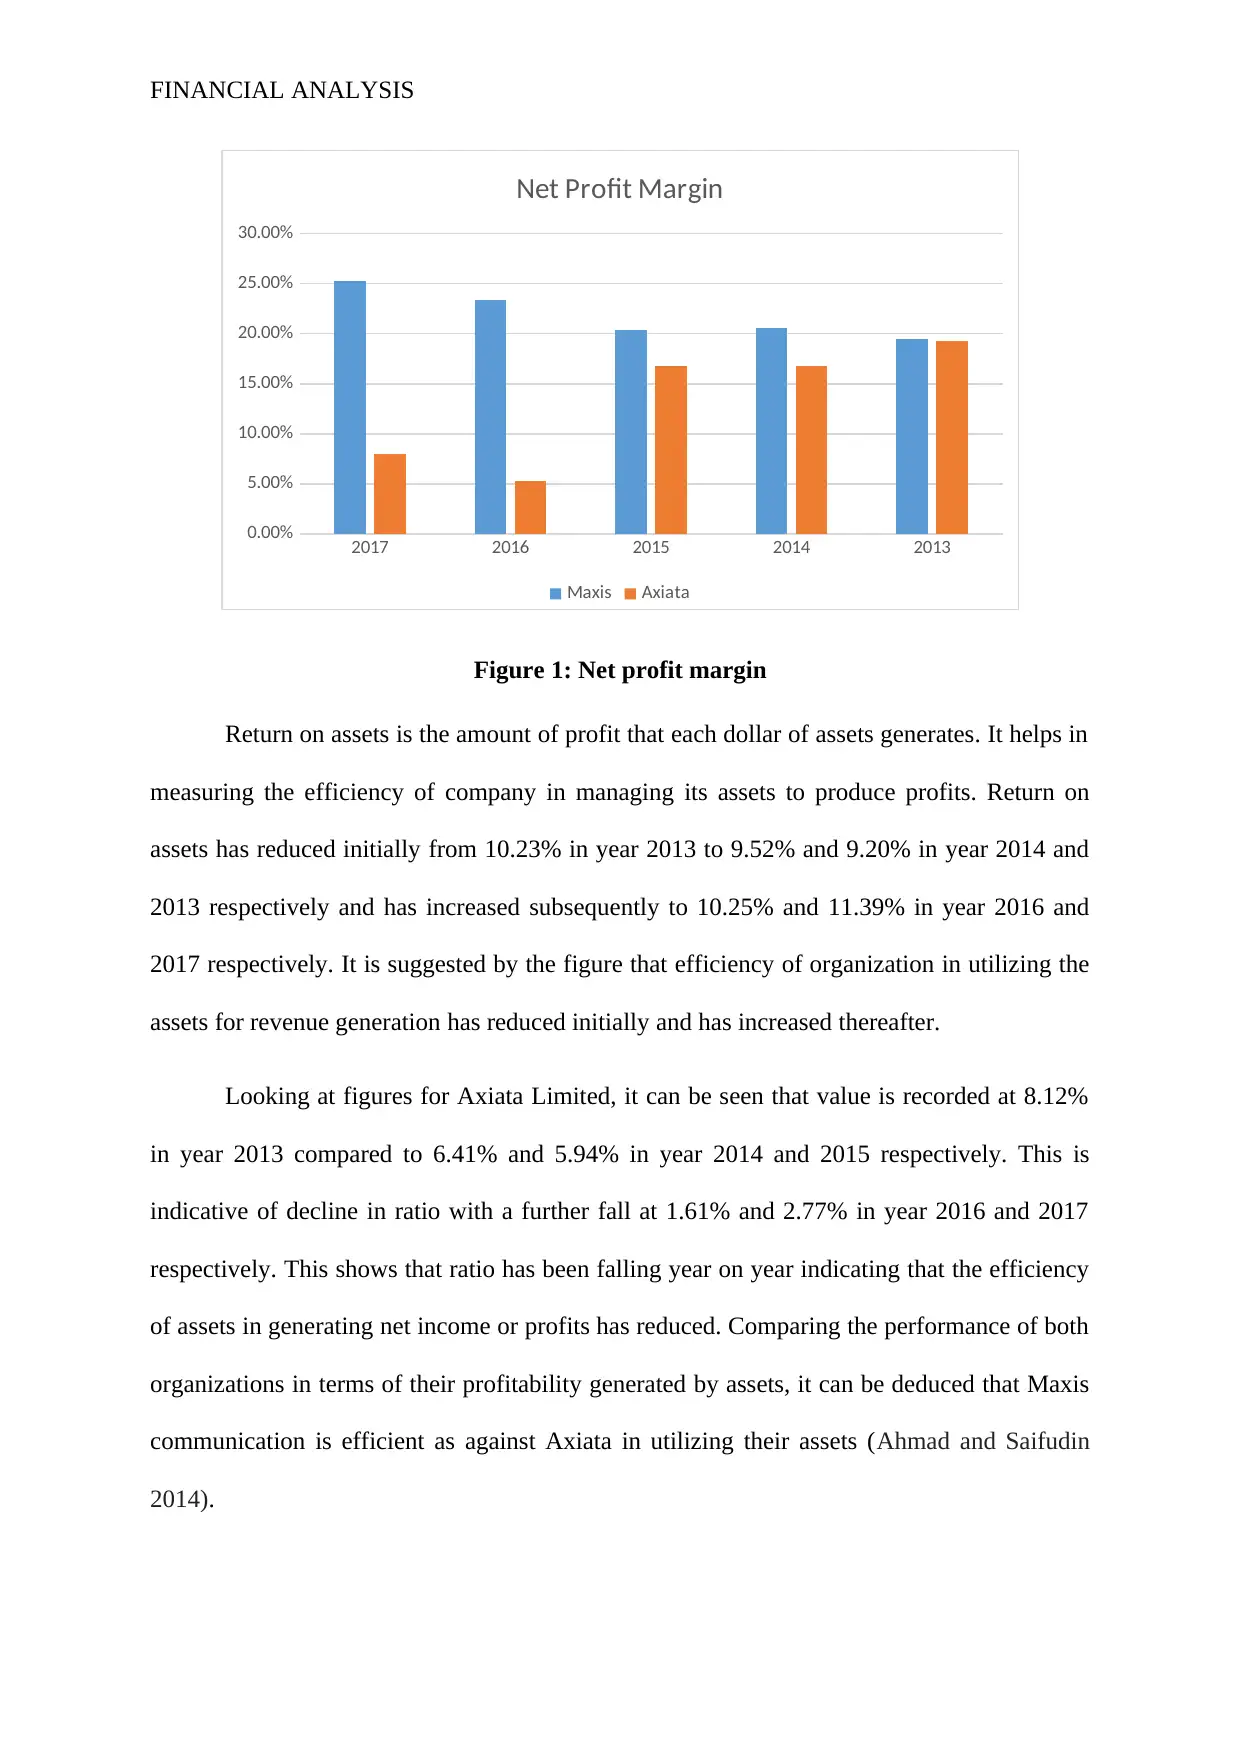
Return on assets is the amount of profit that each dollar of assets generates. It helps in
measuring the efficiency of company in managing its assets to produce profits. Return on
assets has reduced initially from 10.23% in year 2013 to 9.52% and 9.20% in year 2014 and
2013 respectively and has increased subsequently to 10.25% and 11.39% in year 2016 and
2017 respectively. It is suggested by the figure that efficiency of organization in utilizing the
assets for revenue generation has reduced initially and has increased thereafter.
Looking at figures for Axiata Limited, it can be seen that value is recorded at 8.12%
in year 2013 compared to 6.41% and 5.94% in year 2014 and 2015 respectively. This is
indicative of decline in ratio with a further fall at 1.61% and 2.77% in year 2016 and 2017
respectively. This shows that ratio has been falling year on year indicating that the efficiency
of assets in generating net income or profits has reduced. Comparing the performance of both
organizations in terms of their profitability generated by assets, it can be deduced that Maxis
communication is efficient as against Axiata in utilizing their assets (Ahmad and Saifudin
2014).
2017 2016 2015 2014 2013
0.00%
5.00%
10.00%
15.00%
20.00%
25.00%
30.00%
Net Profit Margin
Maxis Axiata
Figure 1: Net profit margin
Return on assets is the amount of profit that each dollar of assets generates. It helps in
measuring the efficiency of company in managing its assets to produce profits. Return on
assets has reduced initially from 10.23% in year 2013 to 9.52% and 9.20% in year 2014 and
2013 respectively and has increased subsequently to 10.25% and 11.39% in year 2016 and
2017 respectively. It is suggested by the figure that efficiency of organization in utilizing the
assets for revenue generation has reduced initially and has increased thereafter.
Looking at figures for Axiata Limited, it can be seen that value is recorded at 8.12%
in year 2013 compared to 6.41% and 5.94% in year 2014 and 2015 respectively. This is
indicative of decline in ratio with a further fall at 1.61% and 2.77% in year 2016 and 2017
respectively. This shows that ratio has been falling year on year indicating that the efficiency
of assets in generating net income or profits has reduced. Comparing the performance of both
organizations in terms of their profitability generated by assets, it can be deduced that Maxis
communication is efficient as against Axiata in utilizing their assets (Ahmad and Saifudin
2014).
Paraphrase This Document
Need a fresh take? Get an instant paraphrase of this document with our AI Paraphraser
FINANCIAL ANALYSIS
2017 2016 2015 2014 2013
0.00%
2.00%
4.00%
6.00%
8.00%
10.00%
12.00%
Return on Total Assets
Maxis Axiata
Figure 2: Return on total assets
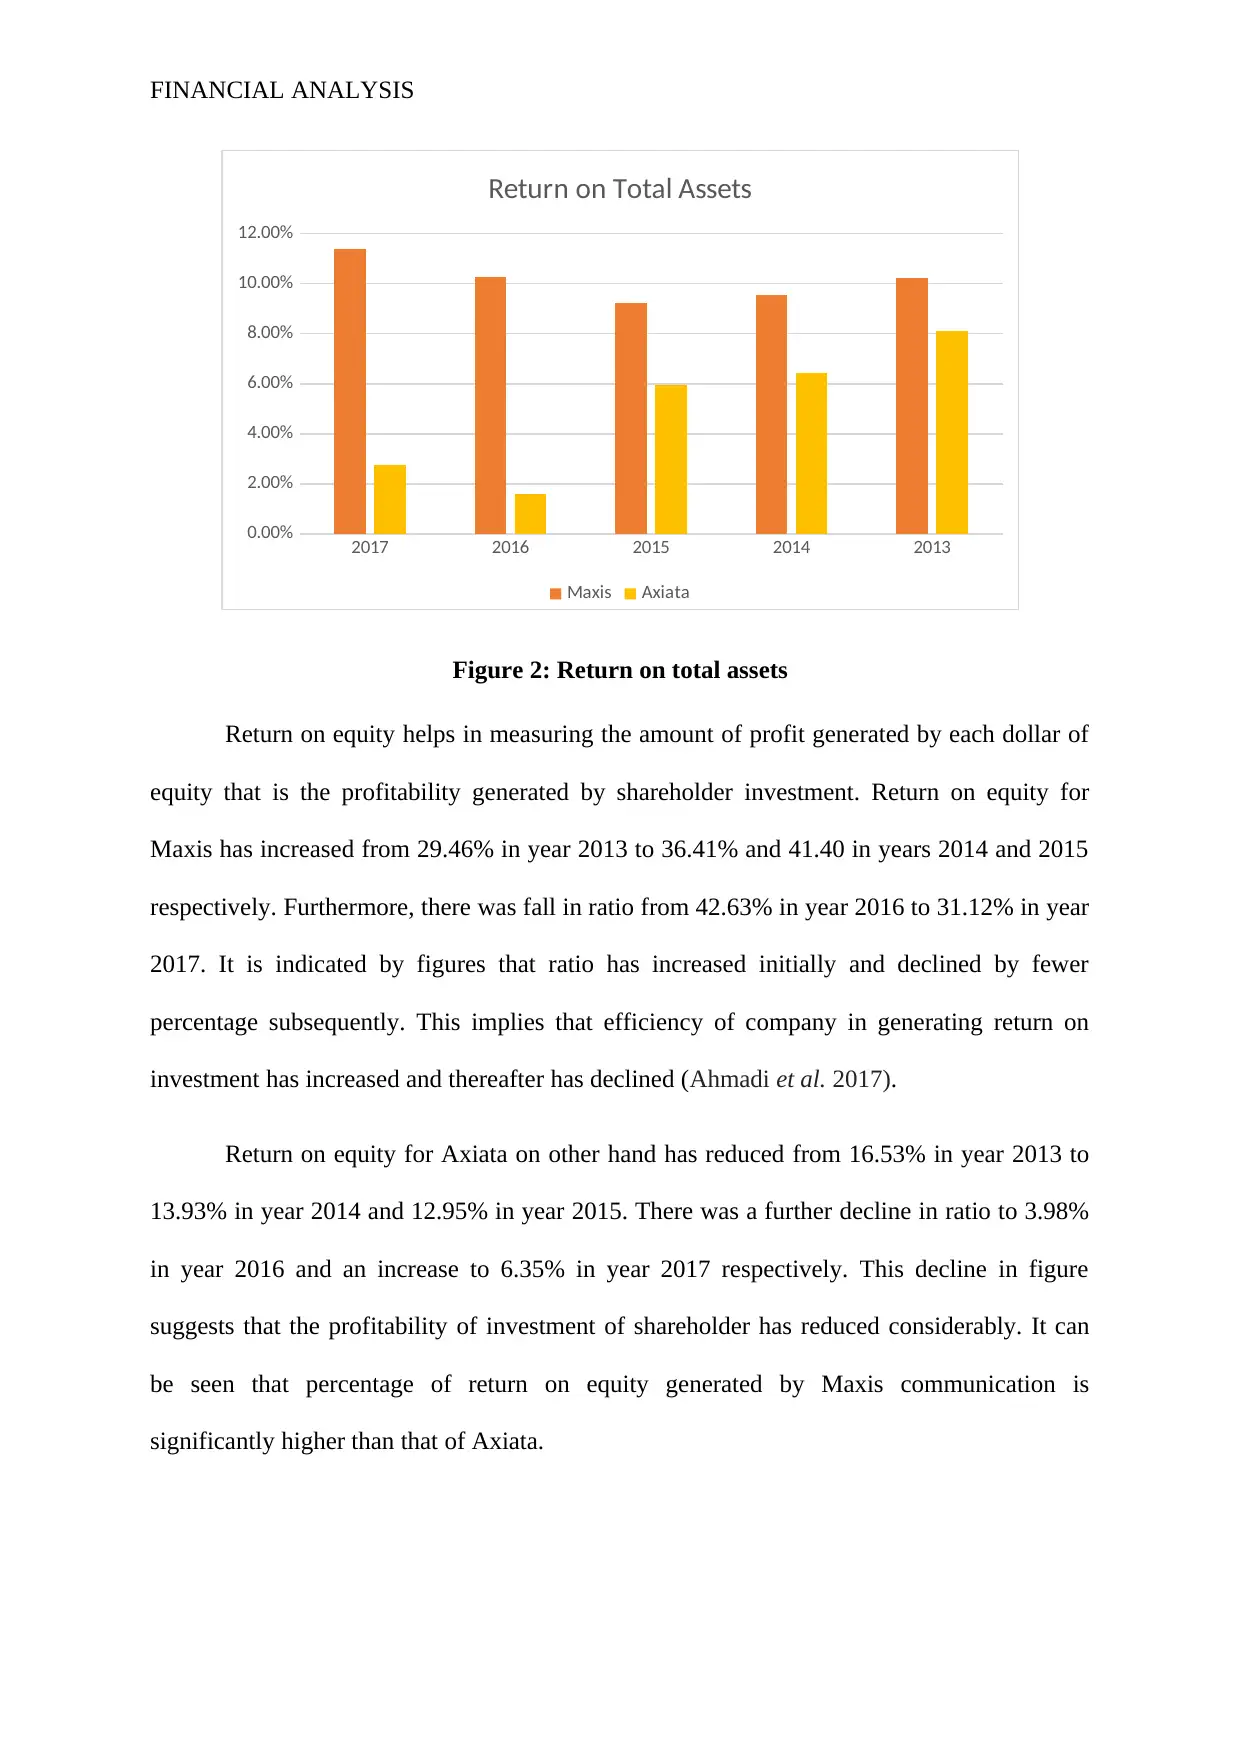
Return on equity helps in measuring the amount of profit generated by each dollar of
equity that is the profitability generated by shareholder investment. Return on equity for
Maxis has increased from 29.46% in year 2013 to 36.41% and 41.40 in years 2014 and 2015
respectively. Furthermore, there was fall in ratio from 42.63% in year 2016 to 31.12% in year
2017. It is indicated by figures that ratio has increased initially and declined by fewer
percentage subsequently. This implies that efficiency of company in generating return on
investment has increased and thereafter has declined (Ahmadi et al. 2017).
Return on equity for Axiata on other hand has reduced from 16.53% in year 2013 to
13.93% in year 2014 and 12.95% in year 2015. There was a further decline in ratio to 3.98%
in year 2016 and an increase to 6.35% in year 2017 respectively. This decline in figure
suggests that the profitability of investment of shareholder has reduced considerably. It can
be seen that percentage of return on equity generated by Maxis communication is
significantly higher than that of Axiata.
2017 2016 2015 2014 2013
0.00%
2.00%
4.00%
6.00%
8.00%
10.00%
12.00%
Return on Total Assets
Maxis Axiata
Figure 2: Return on total assets
Return on equity helps in measuring the amount of profit generated by each dollar of
equity that is the profitability generated by shareholder investment. Return on equity for
Maxis has increased from 29.46% in year 2013 to 36.41% and 41.40 in years 2014 and 2015
respectively. Furthermore, there was fall in ratio from 42.63% in year 2016 to 31.12% in year
2017. It is indicated by figures that ratio has increased initially and declined by fewer
percentage subsequently. This implies that efficiency of company in generating return on
investment has increased and thereafter has declined (Ahmadi et al. 2017).
Return on equity for Axiata on other hand has reduced from 16.53% in year 2013 to
13.93% in year 2014 and 12.95% in year 2015. There was a further decline in ratio to 3.98%
in year 2016 and an increase to 6.35% in year 2017 respectively. This decline in figure
suggests that the profitability of investment of shareholder has reduced considerably. It can
be seen that percentage of return on equity generated by Maxis communication is
significantly higher than that of Axiata.
FINANCIAL ANALYSIS
2017 2016 2015 2014 2013
0.00%
5.00%
10.00%
15.00%
20.00%
25.00%
30.00%
35.00%
40.00%
45.00%
Return on Equity
Maxis Axiata
Figure 3: Return on equity
From the analysuis and evaluation of above figures presented for bioth the
organization, it can be inferred that the profitability position of Maxis communication is
better than Axiata.
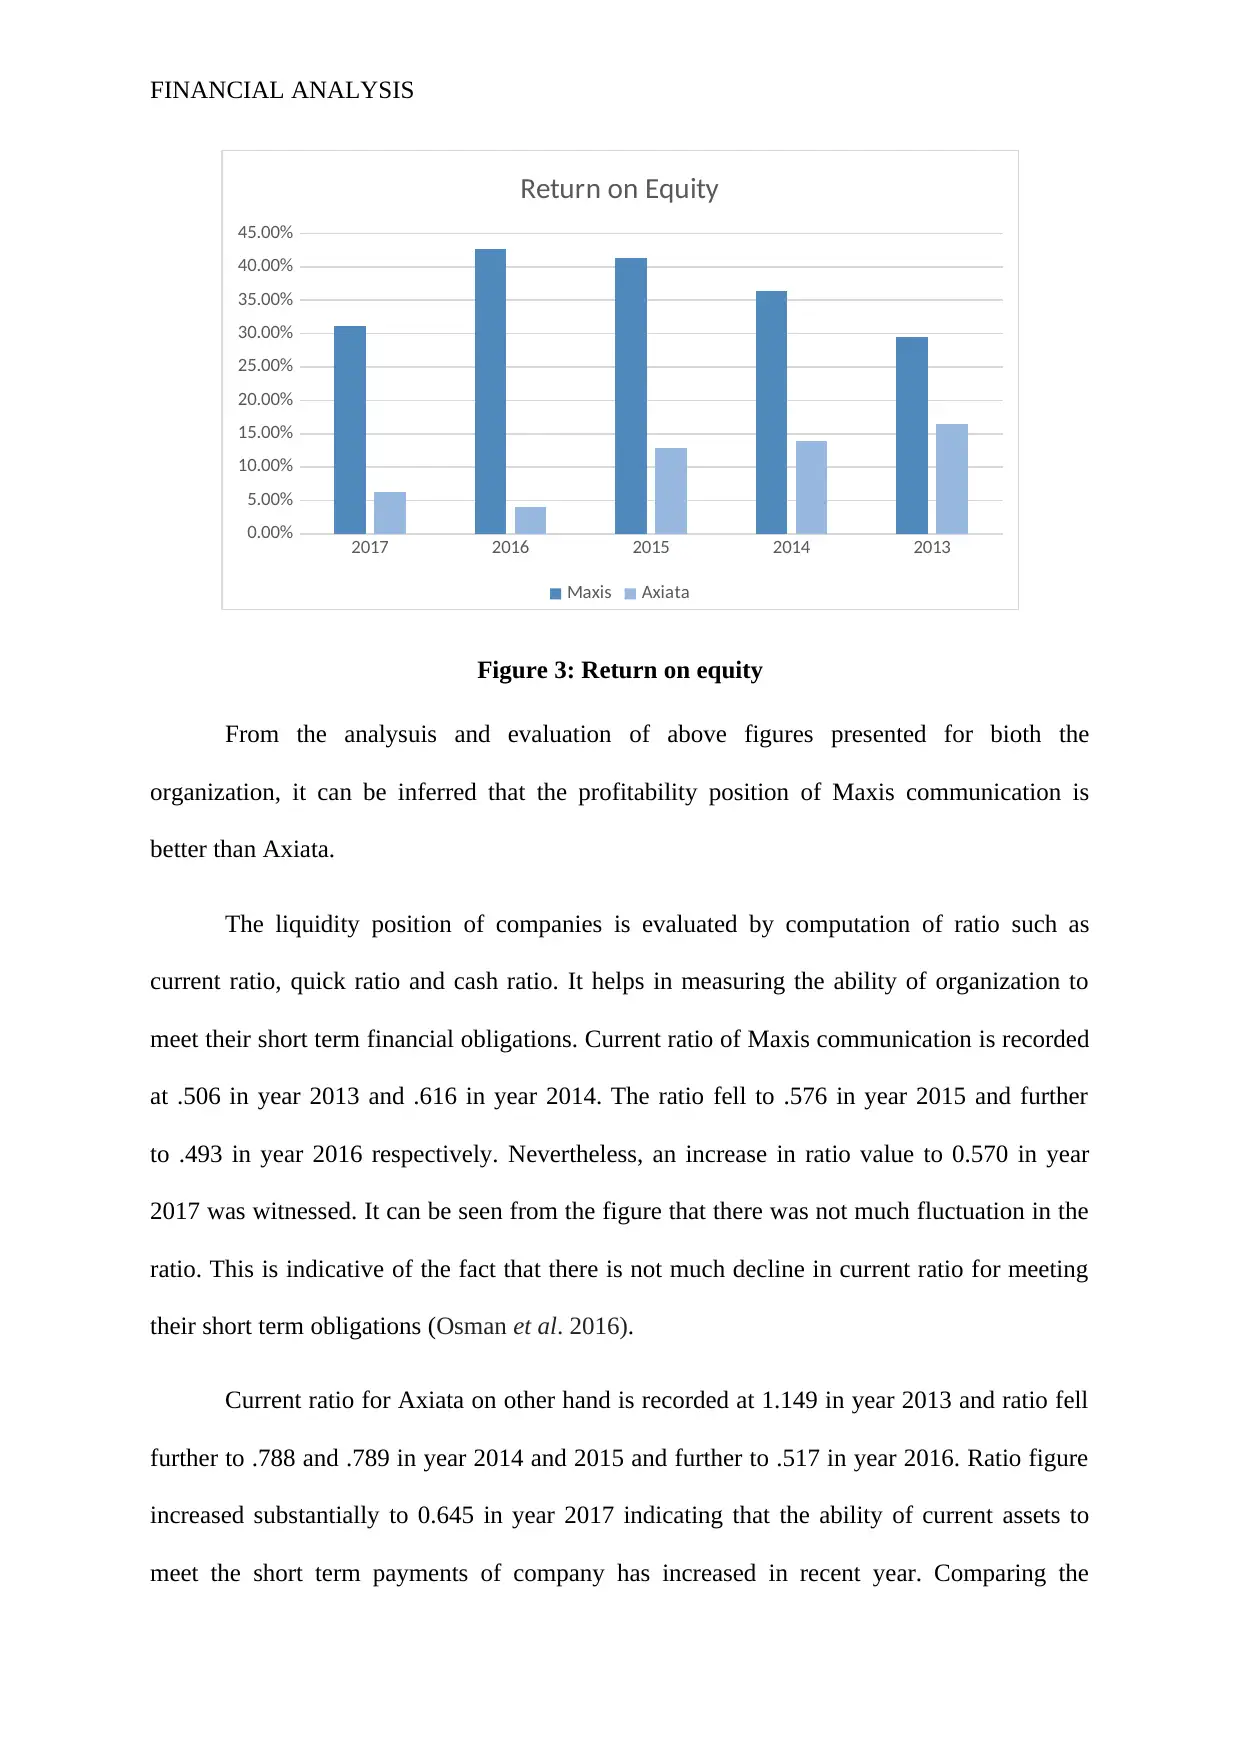
The liquidity position of companies is evaluated by computation of ratio such as
current ratio, quick ratio and cash ratio. It helps in measuring the ability of organization to
meet their short term financial obligations. Current ratio of Maxis communication is recorded
at .506 in year 2013 and .616 in year 2014. The ratio fell to .576 in year 2015 and further
to .493 in year 2016 respectively. Nevertheless, an increase in ratio value to 0.570 in year
2017 was witnessed. It can be seen from the figure that there was not much fluctuation in the
ratio. This is indicative of the fact that there is not much decline in current ratio for meeting
their short term obligations (Osman et al. 2016).
Current ratio for Axiata on other hand is recorded at 1.149 in year 2013 and ratio fell
further to .788 and .789 in year 2014 and 2015 and further to .517 in year 2016. Ratio figure
increased substantially to 0.645 in year 2017 indicating that the ability of current assets to
meet the short term payments of company has increased in recent year. Comparing the
2017 2016 2015 2014 2013
0.00%
5.00%
10.00%
15.00%
20.00%
25.00%
30.00%
35.00%
40.00%
45.00%
Return on Equity
Maxis Axiata
Figure 3: Return on equity
From the analysuis and evaluation of above figures presented for bioth the
organization, it can be inferred that the profitability position of Maxis communication is
better than Axiata.
The liquidity position of companies is evaluated by computation of ratio such as
current ratio, quick ratio and cash ratio. It helps in measuring the ability of organization to
meet their short term financial obligations. Current ratio of Maxis communication is recorded
at .506 in year 2013 and .616 in year 2014. The ratio fell to .576 in year 2015 and further
to .493 in year 2016 respectively. Nevertheless, an increase in ratio value to 0.570 in year
2017 was witnessed. It can be seen from the figure that there was not much fluctuation in the
ratio. This is indicative of the fact that there is not much decline in current ratio for meeting
their short term obligations (Osman et al. 2016).
Current ratio for Axiata on other hand is recorded at 1.149 in year 2013 and ratio fell
further to .788 and .789 in year 2014 and 2015 and further to .517 in year 2016. Ratio figure
increased substantially to 0.645 in year 2017 indicating that the ability of current assets to
meet the short term payments of company has increased in recent year. Comparing the
⊘ This is a preview!⊘
Do you want full access?
Subscribe today to unlock all pages.
Trusted by 1+ million students worldwide
FINANCIAL ANALYSIS
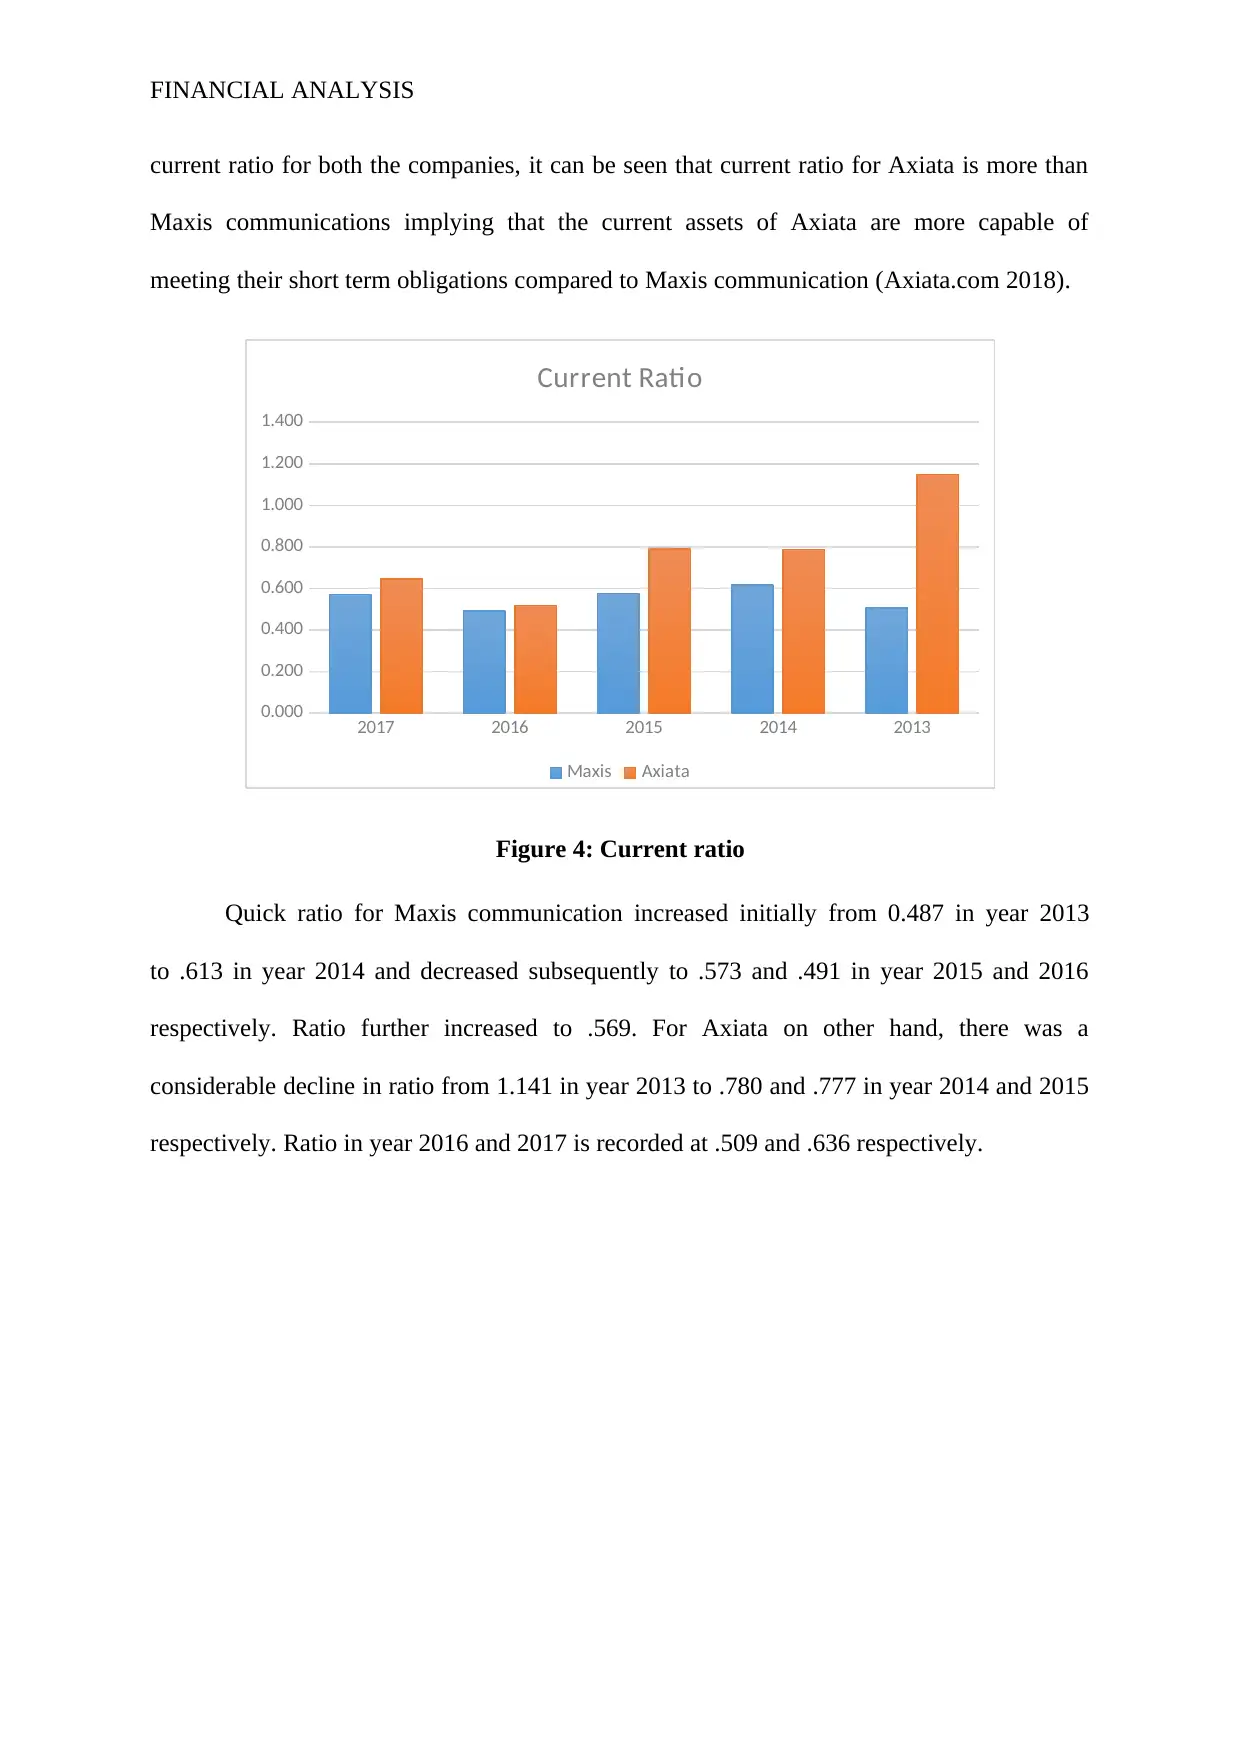
current ratio for both the companies, it can be seen that current ratio for Axiata is more than
Maxis communications implying that the current assets of Axiata are more capable of
meeting their short term obligations compared to Maxis communication (Axiata.com 2018).
2017 2016 2015 2014 2013
0.000
0.200
0.400
0.600
0.800
1.000
1.200
1.400
Current Ratio
Maxis Axiata
Figure 4: Current ratio
Quick ratio for Maxis communication increased initially from 0.487 in year 2013
to .613 in year 2014 and decreased subsequently to .573 and .491 in year 2015 and 2016
respectively. Ratio further increased to .569. For Axiata on other hand, there was a
considerable decline in ratio from 1.141 in year 2013 to .780 and .777 in year 2014 and 2015
respectively. Ratio in year 2016 and 2017 is recorded at .509 and .636 respectively.
Paraphrase This Document
Need a fresh take? Get an instant paraphrase of this document with our AI Paraphraser
FINANCIAL ANALYSIS
2017 2016 2015 2014 2013
Quick Ratio
Maxis Axiata
Figure 5: Quick ratio
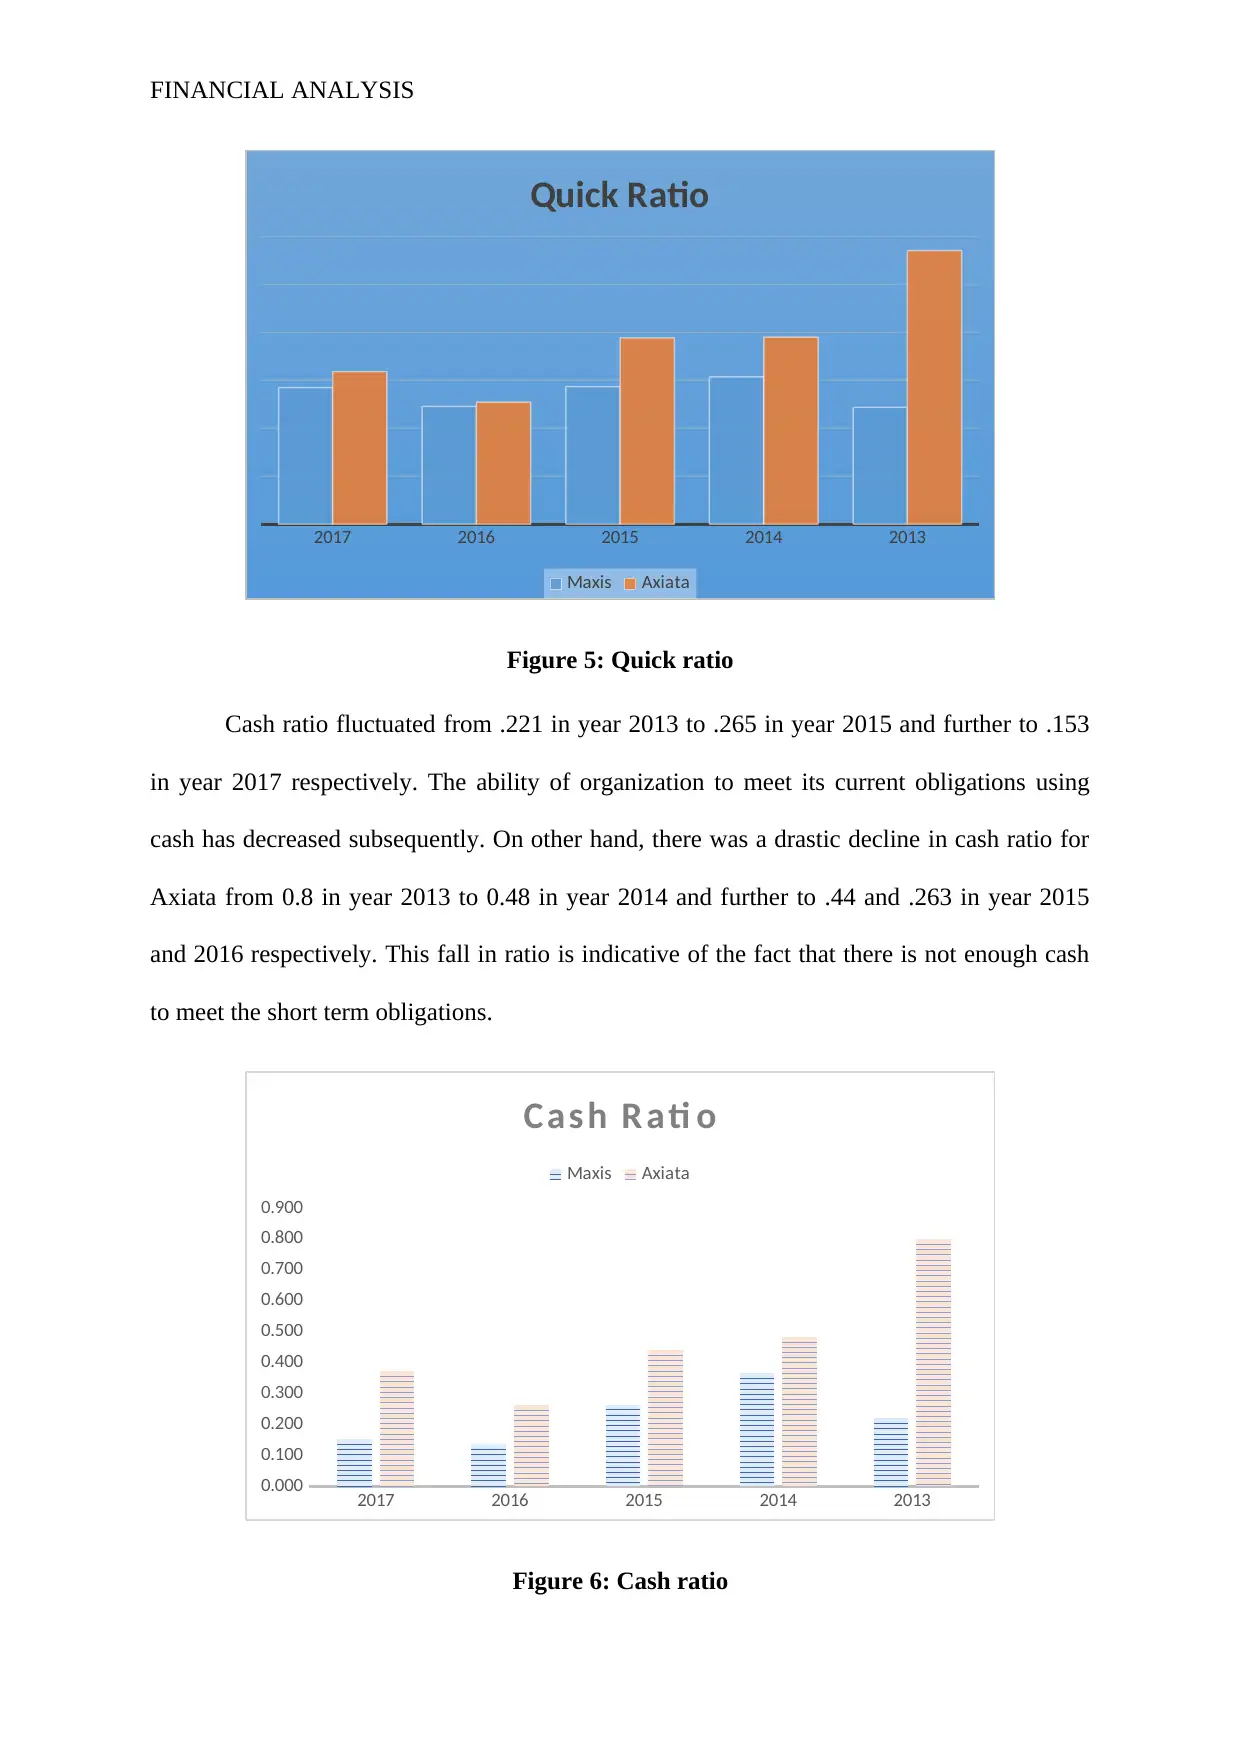
Cash ratio fluctuated from .221 in year 2013 to .265 in year 2015 and further to .153
in year 2017 respectively. The ability of organization to meet its current obligations using
cash has decreased subsequently. On other hand, there was a drastic decline in cash ratio for
Axiata from 0.8 in year 2013 to 0.48 in year 2014 and further to .44 and .263 in year 2015
and 2016 respectively. This fall in ratio is indicative of the fact that there is not enough cash
to meet the short term obligations.
2017 2016 2015 2014 2013
0.000
0.100
0.200
0.300
0.400
0.500
0.600
0.700
0.800
0.900
Cash R ati o
Maxis Axiata
Figure 6: Cash ratio
2017 2016 2015 2014 2013
Quick Ratio
Maxis Axiata
Figure 5: Quick ratio
Cash ratio fluctuated from .221 in year 2013 to .265 in year 2015 and further to .153
in year 2017 respectively. The ability of organization to meet its current obligations using
cash has decreased subsequently. On other hand, there was a drastic decline in cash ratio for
Axiata from 0.8 in year 2013 to 0.48 in year 2014 and further to .44 and .263 in year 2015
and 2016 respectively. This fall in ratio is indicative of the fact that there is not enough cash
to meet the short term obligations.
2017 2016 2015 2014 2013
0.000
0.100
0.200
0.300
0.400
0.500
0.600
0.700
0.800
0.900
Cash R ati o
Maxis Axiata
Figure 6: Cash ratio
FINANCIAL ANALYSIS
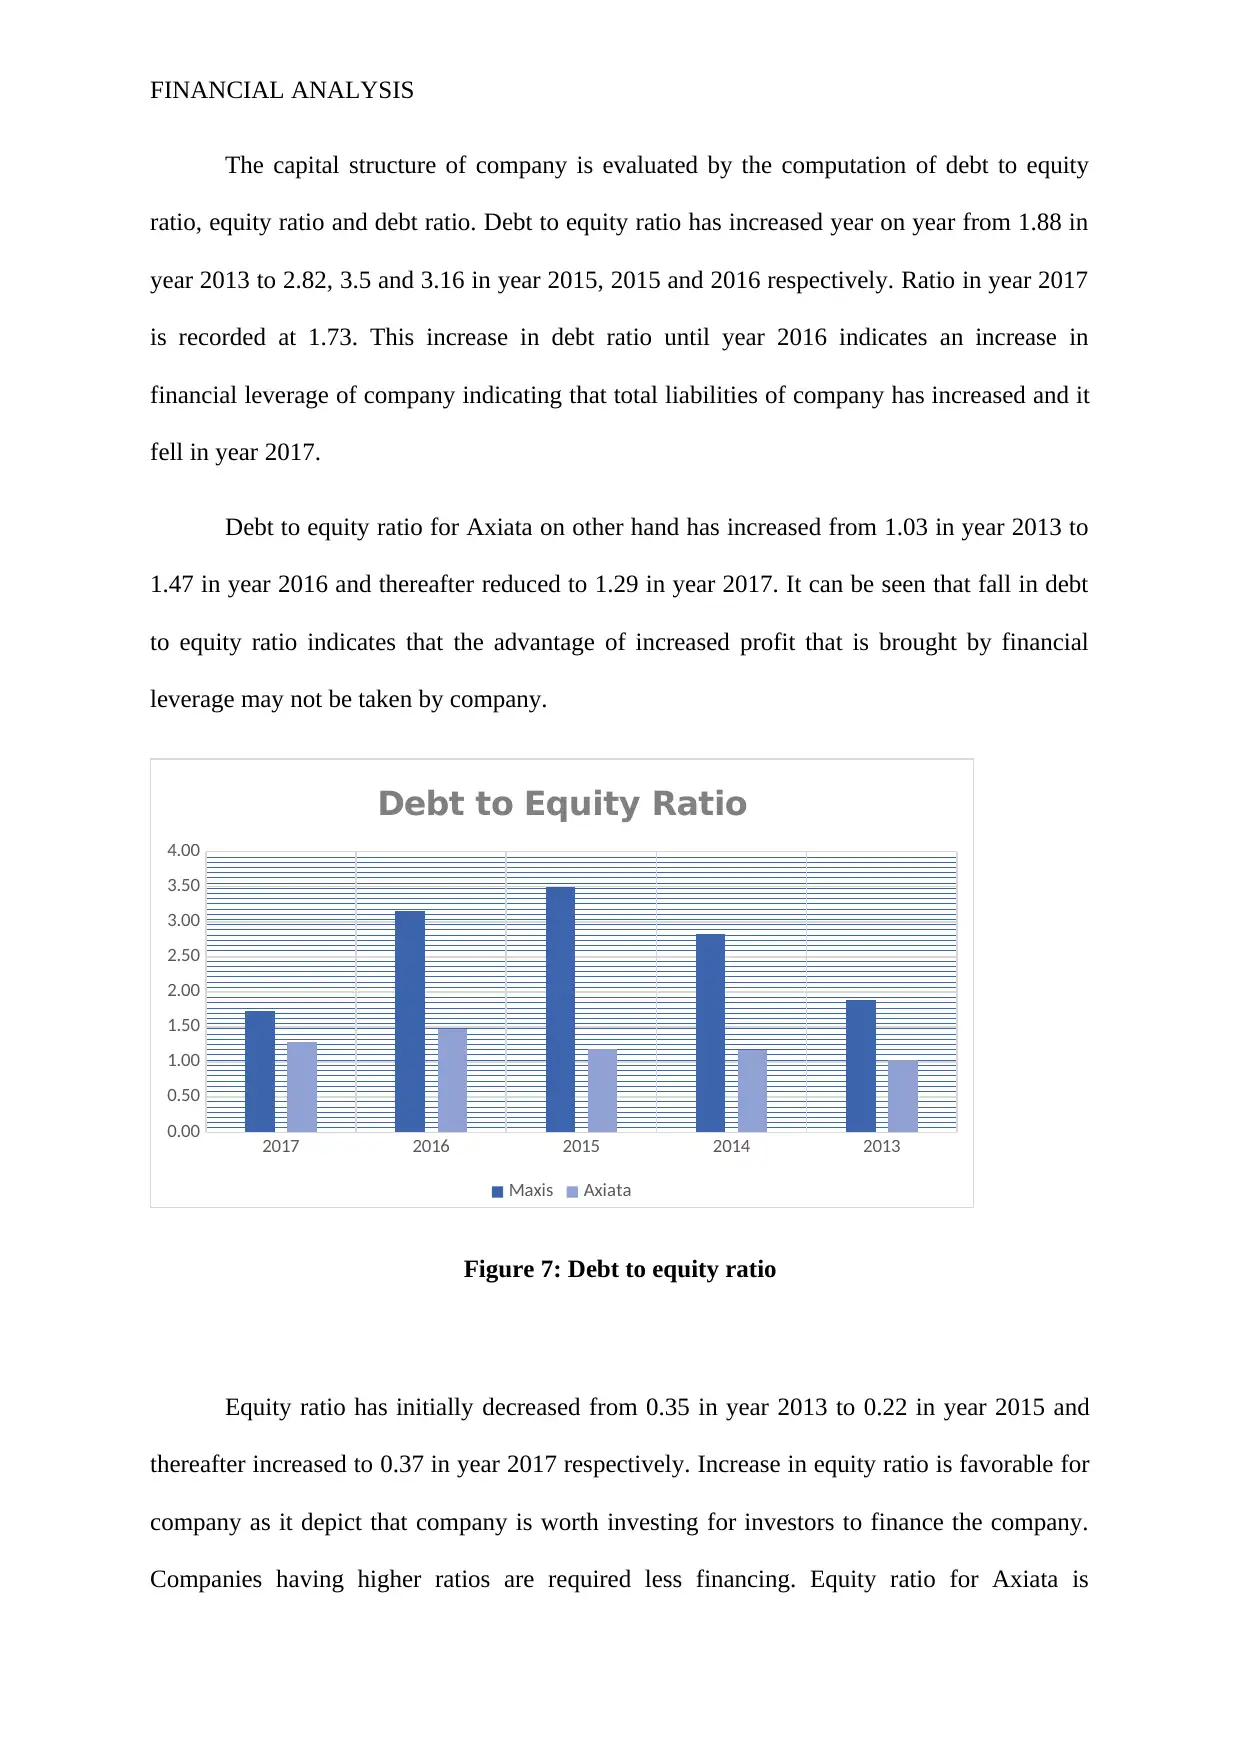
The capital structure of company is evaluated by the computation of debt to equity
ratio, equity ratio and debt ratio. Debt to equity ratio has increased year on year from 1.88 in
year 2013 to 2.82, 3.5 and 3.16 in year 2015, 2015 and 2016 respectively. Ratio in year 2017
is recorded at 1.73. This increase in debt ratio until year 2016 indicates an increase in
financial leverage of company indicating that total liabilities of company has increased and it
fell in year 2017.
Debt to equity ratio for Axiata on other hand has increased from 1.03 in year 2013 to
1.47 in year 2016 and thereafter reduced to 1.29 in year 2017. It can be seen that fall in debt
to equity ratio indicates that the advantage of increased profit that is brought by financial
leverage may not be taken by company.
2017 2016 2015 2014 2013
0.00
0.50
1.00
1.50
2.00
2.50
3.00
3.50
4.00
Debt to Equity Ratio
Maxis Axiata
Figure 7: Debt to equity ratio
Equity ratio has initially decreased from 0.35 in year 2013 to 0.22 in year 2015 and
thereafter increased to 0.37 in year 2017 respectively. Increase in equity ratio is favorable for
company as it depict that company is worth investing for investors to finance the company.
Companies having higher ratios are required less financing. Equity ratio for Axiata is
⊘ This is a preview!⊘
Do you want full access?
Subscribe today to unlock all pages.
Trusted by 1+ million students worldwide
1 out of 22
Related Documents


Your All-in-One AI-Powered Toolkit for Academic Success.
+13062052269
info@desklib.com
Available 24*7 on WhatsApp / Email
![[object Object]](/_next/static/media/star-bottom.7253800d.svg)
Unlock your academic potential
Copyright © 2020–2026 A2Z Services. All Rights Reserved. Developed and managed by ZUCOL.