Celcom Axiata Berhad: Financial, Strategic, and Competitive Analysis
VerifiedAdded on 2020/06/06
|21
|4379
|123
Report
AI Summary
This report provides a comprehensive business analysis of Celcom Axiata Berhad, a mobile telecommunications company in Malaysia. The analysis begins with an introduction to the company's background, key issues, and a comparison with competitors like MAXIS and DIGI, focusing on value propositions. A financial analysis is conducted using ratio analysis, including return on invested capital, net profit margin, return on assets, current ratio, and quick ratio, to assess the company's financial health and performance over several years. Strategic analysis incorporates a PESTLE analysis to evaluate political, economic, social, technological, legal, and environmental factors affecting the company, along with an examination of new forces like digitalization, globalization, and deregulation. The report also explores Celcom Axiata Berhad's operational strategies, including its focus on the 20-35 age group, and the identification of appropriate strategies using Ansoff's Matrix. Finally, it discusses the limitations of financial models and conventional analysis, providing recommendations based on the findings. The report is well-structured, including illustrations and references to support its findings, making it a valuable resource for understanding Celcom Axiata Berhad's business operations and strategic positioning within the telecommunications industry.
Business Analysis
Project
Project
Paraphrase This Document
Need a fresh take? Get an instant paraphrase of this document with our AI Paraphraser
Table of Contents
INTRODUCTION...........................................................................................................................1
1) COMPANY BACKGROUND....................................................................................................1
1.1 Key Issues.........................................................................................................................1
1.2 Comparison with competitors on the basis of value proposition.....................................1
1.3 Rationale of choice of company.......................................................................................2
2) FINANCIAL ANALYSIS...........................................................................................................2
2.1 Ration analysis and its importance...................................................................................2
2.2 Types of ratio analysis......................................................................................................2
3) STRATEGIC ANALYSIS..........................................................................................................8
3.1 PESTLE analysis..............................................................................................................8
3.2 New forces affect the organisation...................................................................................9
3.3 Operations perform by organisation.................................................................................9
3.4 Success factors................................................................................................................10
4) IDENTIFICATION OF APPROPRIATE STRATEGIES........................................................11
4.1 Ansoff's Matrix...............................................................................................................11
5) LIMITATION OF FINANCIAL MODEL AND CONVENTIONAL ANALYSIS.................12
5.1 Limitation of conventional analysis...............................................................................12
5.2 Limitation of financial model analysis...........................................................................12
RECOMMENDATION.................................................................................................................13
CONCLUSION..............................................................................................................................13
MODELLING................................................................................................................................13
REFERENCES..............................................................................................................................15
APPENDIX....................................................................................................................................17
Illustration Index
Illustration 1: Return on capital invested.........................................................................................3
Illustration 2: Net Profit Margin Ratio.............................................................................................4
Illustration 3: Return on Asset Ratio...............................................................................................5
Illustration 4: Current Ratio.............................................................................................................6

Illustration 5: Quick Ratio...............................................................................................................7
Illustration 6: Consumer price index................................................................................................8
Illustration 7: Ansoff Matrix..........................................................................................................11
Illustration 6: Consumer price index................................................................................................8
Illustration 7: Ansoff Matrix..........................................................................................................11
⊘ This is a preview!⊘
Do you want full access?
Subscribe today to unlock all pages.
Trusted by 1+ million students worldwide

INTRODUCTION
Business is a place in which good or services are exchange for money. It include those
activities which are used by the Celcom Axiata Berhad, Malaysia for achieving its desire goals
(Wesseling, Niesten and Hekkert, 2015).The present report analysis the financial position of
Celcom Axiata Berhad by comparing its position with their competitors. It describes the
company background and key issues which are arrived while analysing its conditions. It also
analysis the financial statements with the help of ratio. PESTLE, Ansoff's matrix and new forces
will also presents while determine the strategies of cited firm. Furthermore, it also explain the
limitation of conventional and financial model which make negative impact on the business
operational activity.
1) COMPANY BACKGROUND
Celcom Axiata Berhad is a mobile telecommunication services industry, which was
founded in 1988. Its headquarter is situated in Celcom Axiata Tower Kuala Lumpur, Malaysia.
Michael Kunehner is CEO of the company. It provides 2G, 3G, 4G and satellite mobile network
to the pepople.
1.1 Key Issues
Celcom Axiata Berhad is a company which deals their operations in local and
international markets. Here, key issues which company can achieve is to acquire the competitive
advantage in the markets. Cited firm faces problems of its competitors which offers substituents
products have same feature and quality in the marketplace (Amran, Ooi and Devi, 2015).
MAXIS and DIGI are the main competitors which highly affect the operational activity of cited
business. In order to face the competition and achieve the advantages, firm make several changes
in their strategies so that it would be able for its position by providing valuable products.
1.2 Comparison with competitors on the basis of value proposition
MAXIS DIGI
Targeting customers Customer's perspective such as
need and demand/taste
High Income customers with
conveniently arranged in a
high speed
Advantages Ozone-friendly environment Good structure and easy
1
Paraphrase This Document
Need a fresh take? Get an instant paraphrase of this document with our AI Paraphraser
and quality products design with quality
Price 15% premium 29% premium
Value for customers Good services in an affordable
price
Average telecommunication
services with normal price
1.3 Rationale of choice of company
Celcom Axiata Berhad is selected as a firm, aim of the study is to analysis the products
which offers to their customers in good quality with an affordable price. It respect to this, cited
firm decide to operates its function in those market which has been increases for over 10 years. It
can be said that it is essential for the organisation to understand the market trend and competition
which highly affect their managerial functions.
2) FINANCIAL ANALYSIS
2.1 Ration analysis and its importance
Ratio analysis is a form of financial statement. It is used to take information of final
performance of business. Ratio are of different types. The data which are provided by financial
statements are already available. The calculation of ratio are different in firms. It can be used to
compare with performance of industry (Isa and Mohamed, 2017). It is based upon accounting
information, its effectiveness is limited because of some complications which arise due to
historical cost accounting and inflation. And it can be used in a form of trends analysis to
identify the area which need to be investigated further.
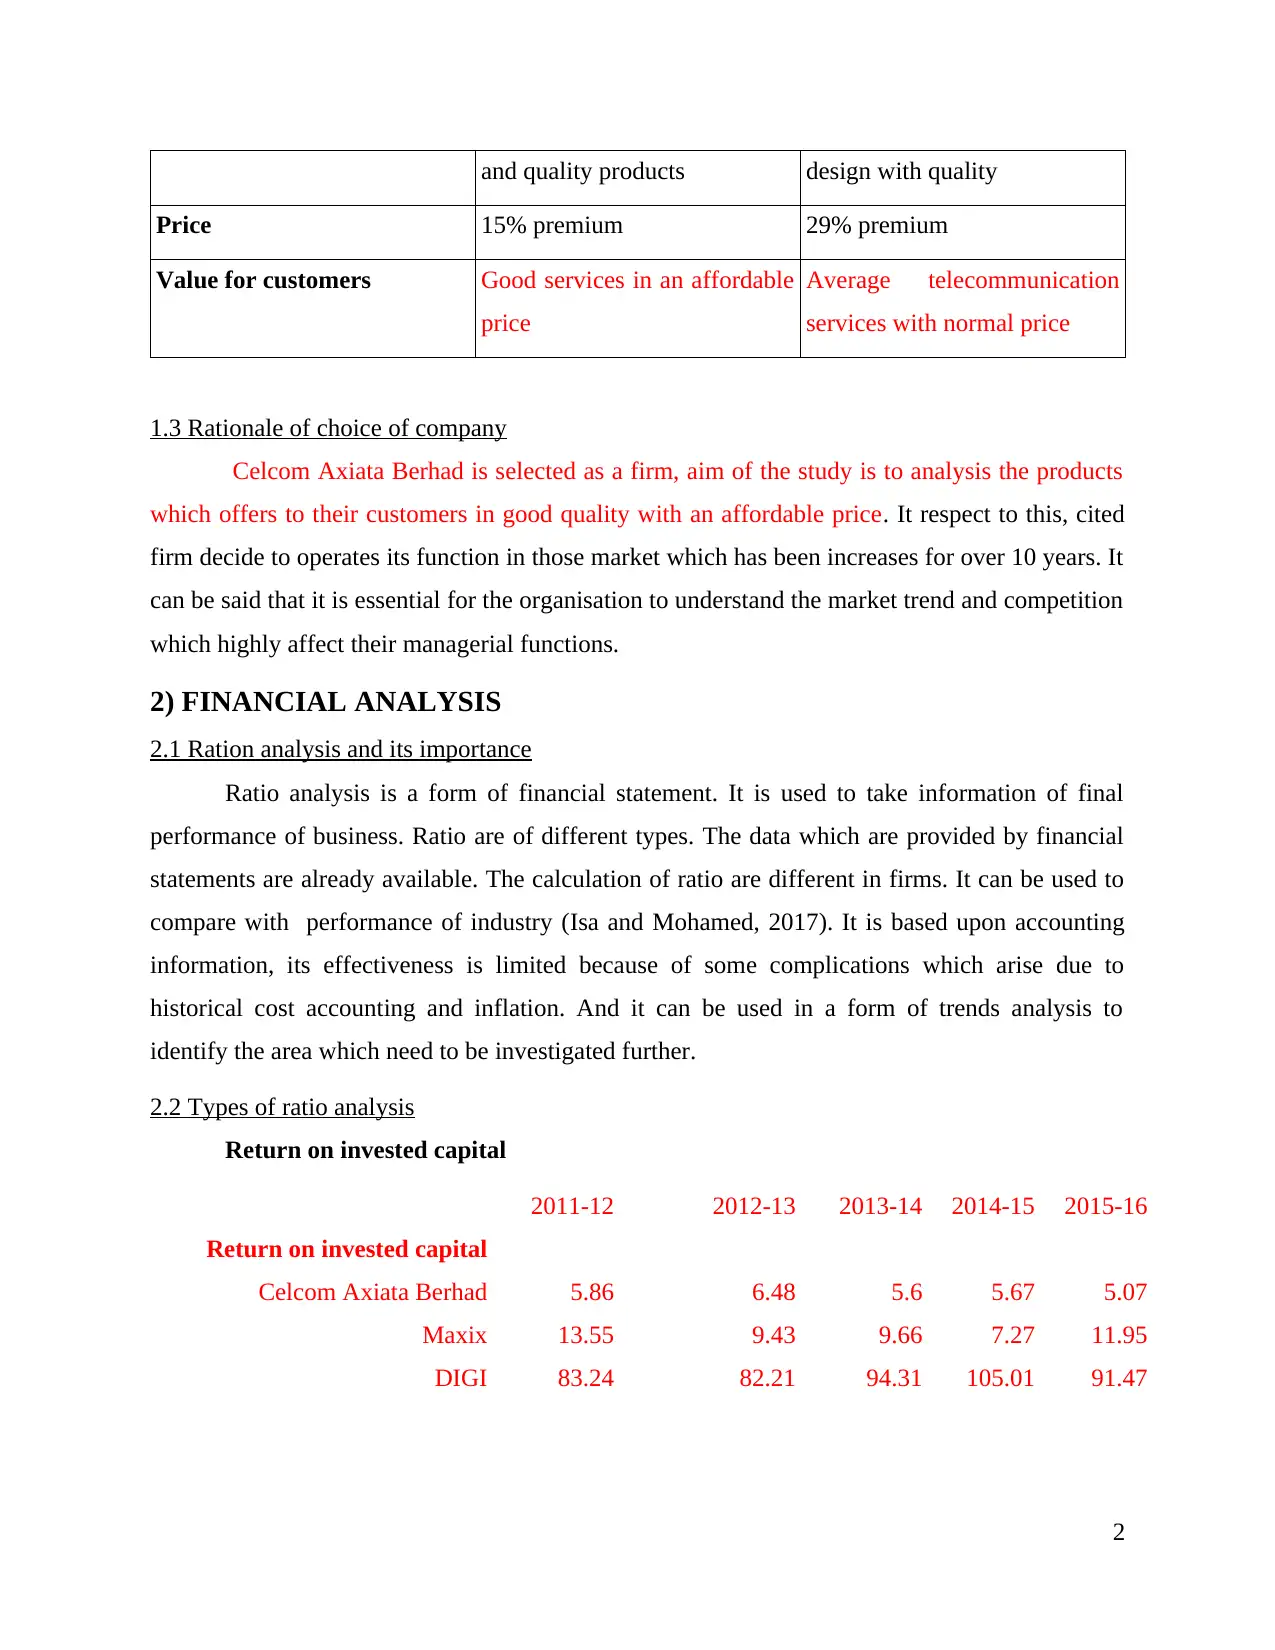
2.2 Types of ratio analysis
Return on invested capital
2011-12 2012-13 2013-14 2014-15 2015-16
Return on invested capital
Celcom Axiata Berhad 5.86 6.48 5.6 5.67 5.07
Maxix 13.55 9.43 9.66 7.27 11.95
DIGI 83.24 82.21 94.31 105.01 91.47
2
Price 15% premium 29% premium
Value for customers Good services in an affordable
price
Average telecommunication
services with normal price
1.3 Rationale of choice of company
Celcom Axiata Berhad is selected as a firm, aim of the study is to analysis the products
which offers to their customers in good quality with an affordable price. It respect to this, cited
firm decide to operates its function in those market which has been increases for over 10 years. It
can be said that it is essential for the organisation to understand the market trend and competition
which highly affect their managerial functions.
2) FINANCIAL ANALYSIS
2.1 Ration analysis and its importance
Ratio analysis is a form of financial statement. It is used to take information of final
performance of business. Ratio are of different types. The data which are provided by financial
statements are already available. The calculation of ratio are different in firms. It can be used to
compare with performance of industry (Isa and Mohamed, 2017). It is based upon accounting
information, its effectiveness is limited because of some complications which arise due to
historical cost accounting and inflation. And it can be used in a form of trends analysis to
identify the area which need to be investigated further.
2.2 Types of ratio analysis
Return on invested capital
2011-12 2012-13 2013-14 2014-15 2015-16
Return on invested capital
Celcom Axiata Berhad 5.86 6.48 5.6 5.67 5.07
Maxix 13.55 9.43 9.66 7.27 11.95
DIGI 83.24 82.21 94.31 105.01 91.47
2

Celcom Axiata Berhad Maxix DIGI
0
50
100
150
200
250
300
350
400
450
500
2015-16
2014-15
2013-14
2012-13
2011-12
Illustration 1: Return on capital invested
Profitability is calculated to find out the actual earning of a company. It indicate the
capability of percentage earning by comparing it last years. It is useful to the manager to forecast
in future. Above graph shows the return on capital invested by Celcom Axiata Berhad, Maxis
and Digi. It shows the decreasing phase of Celcom Axiata Berhad and fluctuation in case of
Kepong. It also present good financial position of DIGI in comparing to others.
Net Profit Margin Ratio
Net profit margin ratio
Celcom Axiata Berhad 27.91 29.66 24.77 25.97 24.96
Maxix 12.03 10.03 8.91 6.37 9.65
DIGI 18.28 18.23 18.81 19.86 19.2
3
⊘ This is a preview!⊘
Do you want full access?
Subscribe today to unlock all pages.
Trusted by 1+ million students worldwide

Celcom Axiata Berhad Maxix DIGI
0
20
40
60
80
100
120
140
2015-16
2014-15
2013-14
2012-13
2011-12
Illustration 2: Net Profit Margin Ratio
It is a part of profitability ratio which is calculated by dividing net income by sales. It is
expressed in percentage. From the above graph, among the three companies, Celcom Axiata
Berhad has highest net profit margin which shows the highest efficiency of firm by converting
sales into real profit. In 2017, company's net profit is recorded with 24.96.
Return on Asset Ratio
Return on asset ratio
Celcom Axiata Berhad 5.47 6.02 5.14 5.19 4.68
Maxix 10.84 7.94 8.05 5.77 8.95
DIGI 52.95 58.47 67.95 73.07 60.04
4
Paraphrase This Document
Need a fresh take? Get an instant paraphrase of this document with our AI Paraphraser

Celcom Axiata Berhad Maxix DIGI
0
50
100
150
200
250
300
350
2015-16
2014-15
2013-14
2012-13
2011-12
Illustration 3: Return on Asset Ratio
Its is an return on assets ratio calculating the return of shown in percentage ( Yin, 2016).
From above graph it is clear that , among the three companies, DIGI has highest return on assets
ratio margin 60.04, MAXIS recorded 8.95 and Celcom Axiata Berhad continuing its lowest
position recorded 4.68 percentage.
Current Ratio
Current ratio
Celcom Axiata Berhad 3.34 3.15 2.47 2.52 3.24
Maxix 3.05 2.52 2.01 1.82 1.98
DIGI 0.9 0.69 0.72 0.75 1.26
5

Celcom Axiata Berhad Maxix DIGI
0
2
4
6
8
10
12
14
16
2015-16
2014-15
2013-14
2012-13
2011-12
Illustration 4: Current Ratio
Above graph is presenting the current sales ratio of the three companies. The highest
current percentage data on sales ratio margin (3.24) is recorded by Celcom Axiata Berhad in
2015-16 year whereas MAXIS recorded 1.98 and DIGI recorded 1.26 ratio percentage.
Quick Ratio
Quick ratio
Celcom Axiata Berhad 2.49 1.9 1.75 1.89 2.47
Maxix 2.23 1.81 1.32 1.36 1.33
DIGI 0.43 0.33 0.35 0.38 0.68
6
⊘ This is a preview!⊘
Do you want full access?
Subscribe today to unlock all pages.
Trusted by 1+ million students worldwide
Celcom Axiata Berhad Maxix DIGI
0
2
4
6
8
10
12
2015-16
2014-15
2013-14
2012-13
2011-12
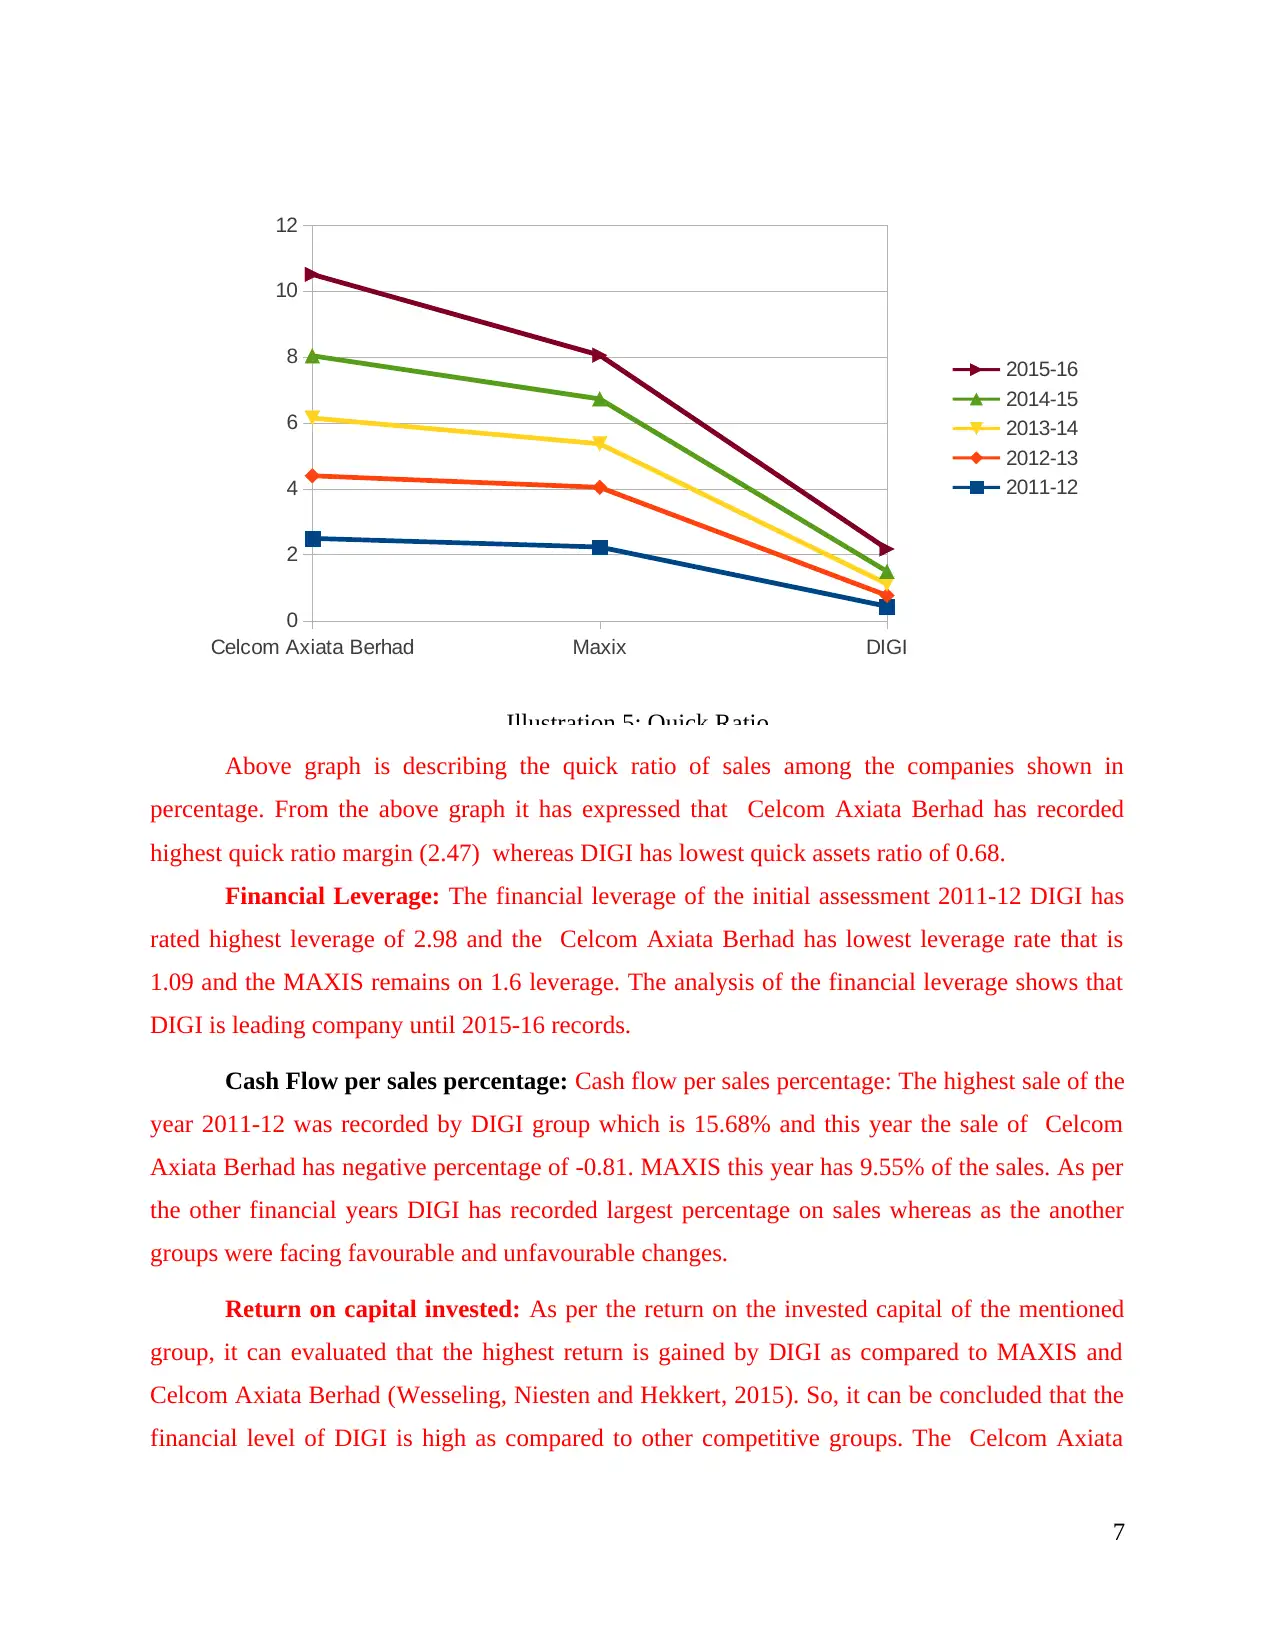
Illustration 5: Quick Ratio
Above graph is describing the quick ratio of sales among the companies shown in
percentage. From the above graph it has expressed that Celcom Axiata Berhad has recorded
highest quick ratio margin (2.47) whereas DIGI has lowest quick assets ratio of 0.68.
Financial Leverage: The financial leverage of the initial assessment 2011-12 DIGI has
rated highest leverage of 2.98 and the Celcom Axiata Berhad has lowest leverage rate that is
1.09 and the MAXIS remains on 1.6 leverage. The analysis of the financial leverage shows that
DIGI is leading company until 2015-16 records.
Cash Flow per sales percentage: Cash flow per sales percentage: The highest sale of the
year 2011-12 was recorded by DIGI group which is 15.68% and this year the sale of Celcom
Axiata Berhad has negative percentage of -0.81. MAXIS this year has 9.55% of the sales. As per
the other financial years DIGI has recorded largest percentage on sales whereas as the another
groups were facing favourable and unfavourable changes.
Return on capital invested: As per the return on the invested capital of the mentioned
group, it can evaluated that the highest return is gained by DIGI as compared to MAXIS and
Celcom Axiata Berhad (Wesseling, Niesten and Hekkert, 2015). So, it can be concluded that the
financial level of DIGI is high as compared to other competitive groups. The Celcom Axiata
7
0
2
4
6
8
10
12
2015-16
2014-15
2013-14
2012-13
2011-12
Illustration 5: Quick Ratio
Above graph is describing the quick ratio of sales among the companies shown in
percentage. From the above graph it has expressed that Celcom Axiata Berhad has recorded
highest quick ratio margin (2.47) whereas DIGI has lowest quick assets ratio of 0.68.
Financial Leverage: The financial leverage of the initial assessment 2011-12 DIGI has
rated highest leverage of 2.98 and the Celcom Axiata Berhad has lowest leverage rate that is
1.09 and the MAXIS remains on 1.6 leverage. The analysis of the financial leverage shows that
DIGI is leading company until 2015-16 records.
Cash Flow per sales percentage: Cash flow per sales percentage: The highest sale of the
year 2011-12 was recorded by DIGI group which is 15.68% and this year the sale of Celcom
Axiata Berhad has negative percentage of -0.81. MAXIS this year has 9.55% of the sales. As per
the other financial years DIGI has recorded largest percentage on sales whereas as the another
groups were facing favourable and unfavourable changes.
Return on capital invested: As per the return on the invested capital of the mentioned
group, it can evaluated that the highest return is gained by DIGI as compared to MAXIS and
Celcom Axiata Berhad (Wesseling, Niesten and Hekkert, 2015). So, it can be concluded that the
financial level of DIGI is high as compared to other competitive groups. The Celcom Axiata
7
Paraphrase This Document
Need a fresh take? Get an instant paraphrase of this document with our AI Paraphraser
Berhad is in decreasing position in the ratio while Kepong group is constantly on the
intermediate level.
3) STRATEGIC ANALYSIS
3.1 PESTLE analysis
Political factors: Malaysia is multicultural company. Political factor include entry
barriers, tax or tariffs structure etc. For example if Celcom Axiata Berhad targeted low to
medium income families than Celcom Axiata Berhad expand their global supply chain to that
family's so that taxation impact can be lower without violating political law. Celcom Axiata
Berhad has tremendous opportunity in Malaysia and company can capitalize this harmonious
political situation for further expenses.
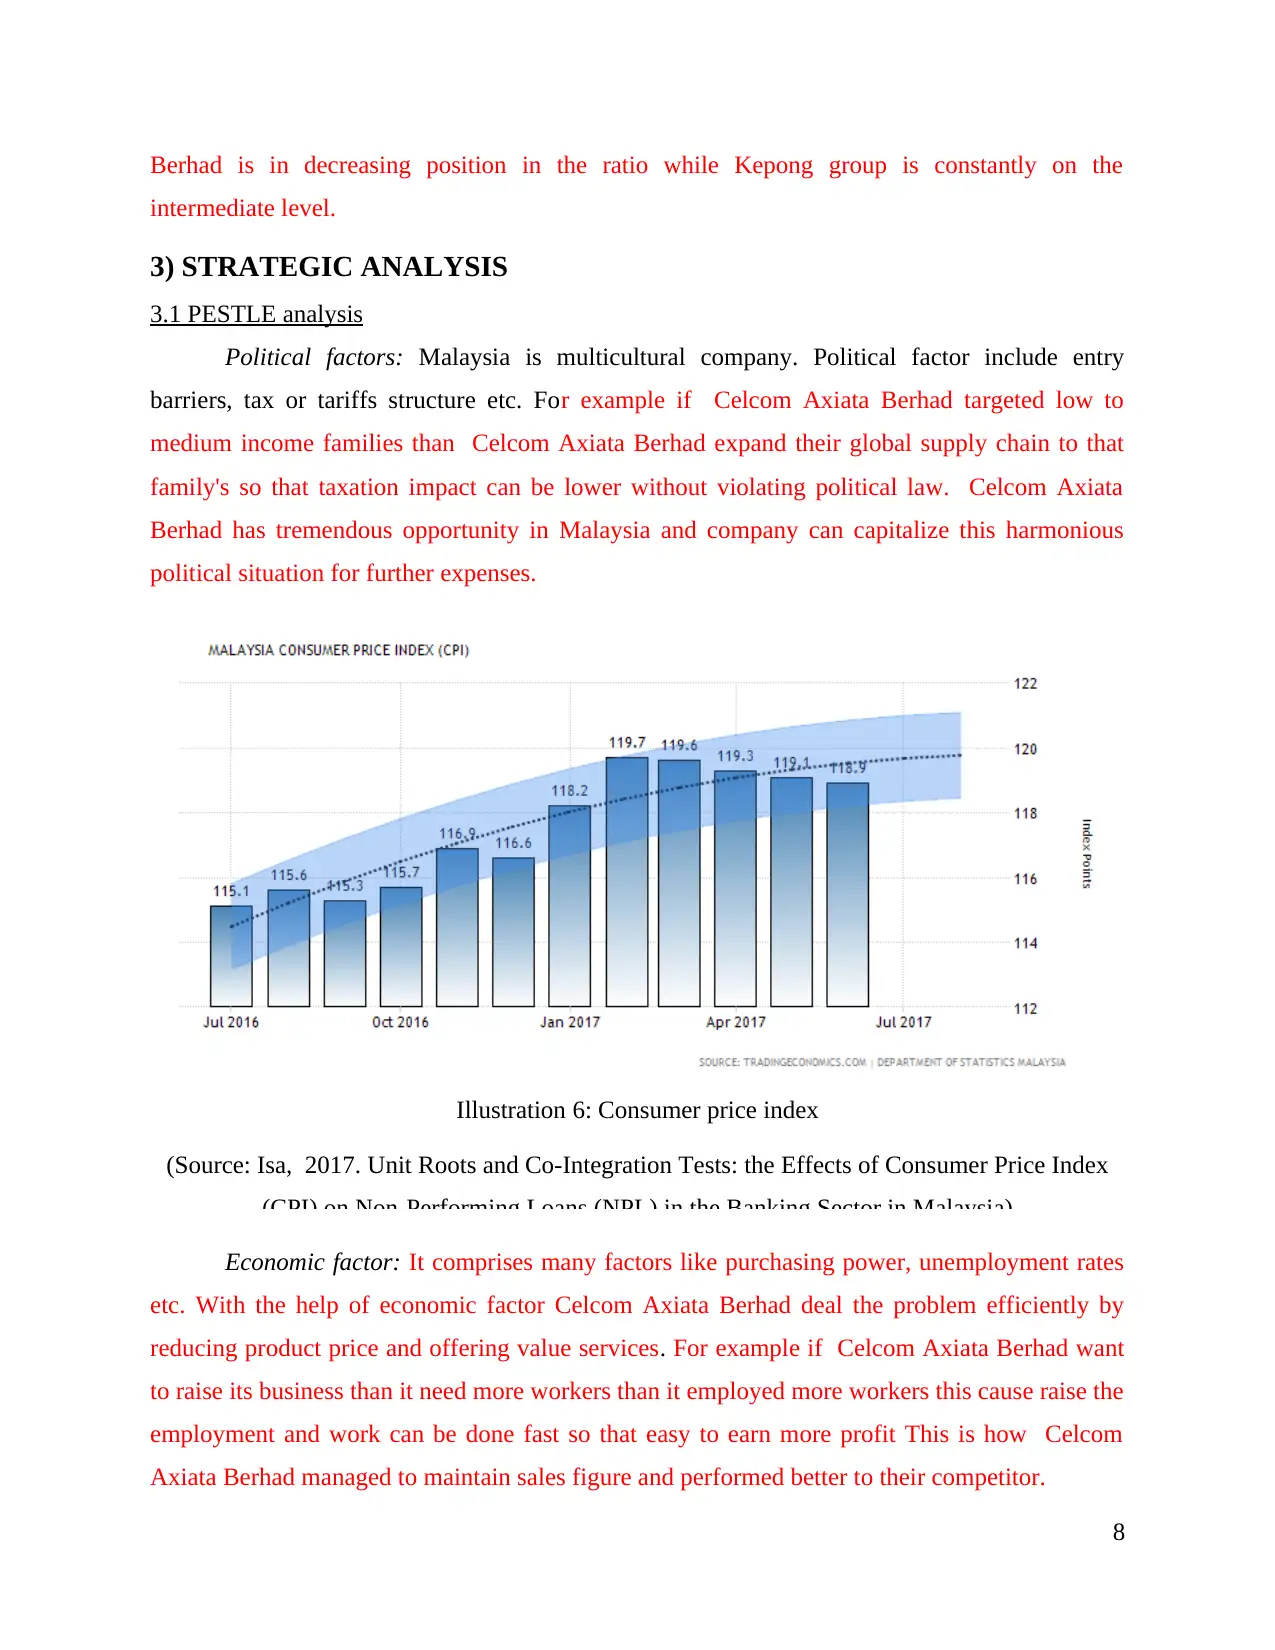
Illustration 6: Consumer price index
(Source: Isa, 2017. Unit Roots and Co-Integration Tests: the Effects of Consumer Price Index
(CPI) on Non-Performing Loans (NPL) in the Banking Sector in Malaysia)
Economic factor: It comprises many factors like purchasing power, unemployment rates
etc. With the help of economic factor Celcom Axiata Berhad deal the problem efficiently by
reducing product price and offering value services. For example if Celcom Axiata Berhad want
to raise its business than it need more workers than it employed more workers this cause raise the
employment and work can be done fast so that easy to earn more profit This is how Celcom
Axiata Berhad managed to maintain sales figure and performed better to their competitor.
8
intermediate level.
3) STRATEGIC ANALYSIS
3.1 PESTLE analysis
Political factors: Malaysia is multicultural company. Political factor include entry
barriers, tax or tariffs structure etc. For example if Celcom Axiata Berhad targeted low to
medium income families than Celcom Axiata Berhad expand their global supply chain to that
family's so that taxation impact can be lower without violating political law. Celcom Axiata
Berhad has tremendous opportunity in Malaysia and company can capitalize this harmonious
political situation for further expenses.
Illustration 6: Consumer price index
(Source: Isa, 2017. Unit Roots and Co-Integration Tests: the Effects of Consumer Price Index
(CPI) on Non-Performing Loans (NPL) in the Banking Sector in Malaysia)
Economic factor: It comprises many factors like purchasing power, unemployment rates
etc. With the help of economic factor Celcom Axiata Berhad deal the problem efficiently by
reducing product price and offering value services. For example if Celcom Axiata Berhad want
to raise its business than it need more workers than it employed more workers this cause raise the
employment and work can be done fast so that easy to earn more profit This is how Celcom
Axiata Berhad managed to maintain sales figure and performed better to their competitor.
8

Social Factor: Social factor refers demand and trends generally occurs due to nationality
religious and culture. To survive in this industry local liking and disliking should be followed
(Staake, Thiesse and Fleisch, 2012). It analysis life style, consumer attitude, consumer buying
pattern, their taste etc.
Technological factors: This factor shape the production output and efficiency plant and
operation. Celcom Axiata Berhad brought fruitful result in telecommunication industry after
using new technology. It have its own website and has a strong Facebook and other networking
presence. Celcom Axiata Berhad appropriate strategies to response the changing need of
customers.
Legal factors: Legal factor have both external and internal sides. With the help of this
factor Celcom Axiata Berhad know the safety of consumer, their laws, their labour laws. For
example: There are various services which are offered by the cited firm which cause the health
problem to the people. In respect to this various laws are framed which ensure the health and
safety to the people.
Environmental factors: This factor involved all factor which are surrounding
environment. It includes climate, whether, geographical location etc. Celcom Axiata Berhad
depends of those factor because business is totally depends on this factor.
3.2 New forces affect the organisation
PESTLE analysis helps the Celcom Axiata Berhad to identify the various factors which
affects its financial structure. In the present times, cited firm also face the major three issues such
as digitalisation, globalisation and deregulation which affects its operations adversely. For
example: People can get all the information like quality of products, substituents and their prices,
markets etc. Hence, organisation face the problem of digitalisation while operating its function.
Moreover, working with foreign markets and deregulation of managerial functions are the new
forces which affect the organisation (Mathur, Mathur and Kenyon, 2012).
3.3 Operations perform by organisation
Celcom Axiata Berhad adopt various innovative strategies by which it can expand its
structure in an international level. To make its position and achieve the competitive advantage
cited firm make various changes in their strategies. It deals their functions in a diversified level.
In order to this, business mainly focus to the 20-35 age group people or adult/young person for
9
⊘ This is a preview!⊘
Do you want full access?
Subscribe today to unlock all pages.
Trusted by 1+ million students worldwide
1 out of 21
Related Documents


Your All-in-One AI-Powered Toolkit for Academic Success.
+13062052269
info@desklib.com
Available 24*7 on WhatsApp / Email
![[object Object]](/_next/static/media/star-bottom.7253800d.svg)
Unlock your academic potential
Copyright © 2020–2026 A2Z Services. All Rights Reserved. Developed and managed by ZUCOL.