Masters Finance Project Report: Stock Analysis of AZV & BRC Companies
VerifiedAdded on 2023/06/16
|25
|5529
|91
Report
AI Summary
This report provides a financial analysis of Azure Healthcare Limited (AZV) and Brain Resource Ltd (BRC) to assess their investment potential. It evaluates performance ratios (liquidity, profitability, capital structure), stock price movements relative to the Australian index (AORD), and dividend policies. The analysis reveals that AZV generally exhibits better profitability and capital structure, while BRC demonstrates a lower liquidity risk. Stock price analysis indicates higher volatility in BRC compared to AZV, with AZV showing a more positive trend. The report concludes with a recommendation favoring AZV for investors seeking better returns due to its lower volatility and better return. The report also touches upon events impacting stock prices and calculates beta and cost of equity for both companies.
Running Head: Finance for business - Masters
1
Project Report: Finance for business - Masters
1
Project Report: Finance for business - Masters
Paraphrase This Document
Need a fresh take? Get an instant paraphrase of this document with our AI Paraphraser
Finance for business - Masters
2
Contents
Introduction.......................................................................................................................3
1.Description of company.................................................................................................3
a.AZURE HEALTHCARE LTD..................................................................................3
b.BRAIN RESOURCE LTD........................................................................................3
2.Performance ratio analysis.............................................................................................4
3.Stock price analysis.......................................................................................................7
4.Analysis on the changes into the stock price.................................................................9
5.Calculation on beta and cost of equity...........................................................................9
6.Dividend policies.........................................................................................................10
7.Recommendation letter................................................................................................11
References.......................................................................................................................14
Appendix.........................................................................................................................16
Finance for business - Masters
3
Introduction:
Evaluation on the financial position and the performance of the company is one of the
important aspects while making the financial investment decision in the company. The
financial analysis process makes a great base and helps the investors to reach over a
conclusion along with some solid reasons. Finance analysis is a broad concept which offers
various types of tools and techniques to the financial analyst and the investors to identify that
whether the position of the company is attractive or the investment into the particular stock
would lead the investment amount towards the loss (Gibson, 2011).
In the given report, the Azure health care limited (AZV) and Brain Resource Ltd
(BRC) has been taken into the concern in order to evaluate the financial analysis and offer a
recommendation to the investors that whether these stocks are good option for the purpose of
the investment or not. The performance ratio analysis, stock price analysis, changes in the
stock prices, beta, cost of equity, dividend policies etc of the stocks have been evaluated in
order to identify that whether the investment into the stock of the company would offer return
to the investors or not.
1. Description of companies:
The description about the history, activities, market area etc of the business has been
measured. The descriptions of Azure health care limited (AZV) and Brain Resource Ltd
(BRC) are as follows:
a. AZURE HEALTHCARE LTD:
AZURE HEALTHCARE LIMITED is an Australian and New Zealand company which
deals in offering the service related to the healthcare to its client. The company offers the
clinical management solution in New Zealand and Australian market. The company offer
various nurse call system such as Tecera (it is for healthcare professionals), Medicom (it is
for hospitals and nursing home), CellGuard (it is for audio communication solutions) etc. the
services of the business also includes the door intercom, discrete monitoring etc. the company
has changed its name in the year of 2012 from YSV holdings limited and the company is
mainly situated at South Australia (Bloomberg, 218). Currently, various changes have been
done by the business in its internal process to improve the overall performance of the
business.
⊘ This is a preview!⊘
Do you want full access?
Subscribe today to unlock all pages.
Trusted by 1+ million students worldwide
Finance for business - Masters
4
b. BRAIN RESOURCE LTD:
Further, the BRAIN RESOURCE LTD is also an Australian company which offers the
medical services and brain products in the Australian market and US market. The main area
of service of the company is Australian and US market. The various subsidiaries are run by
the business to manage the activities and operations (Home, 2018). The company has been
founded in the year of 2005 and since then, performance of the company has been changed a
lot. The total number of employees of the company according to the annual report (2017) is
185.
Both the companies are working in the same industry and thus the evaluation and
comparison among the companies could offer better result about the market and the
investment.
2. Performance ratio analysis:
Performance ratio analysis is a financial tool which is applied by the companies, analyst
and their investors to measure the performance and the investment level of the business. It is
a board concept of the business which evaluates the liquidity, investment and profitability
level of the business and compares it with the performance of the last year or with the
competitors to identify that whether the investment into the company would offer long return
to the investors of the company (Higgins, 2012). The below are the calculations and the
analysis of performance ratios:
Liquidity ratios:
Liquidity ratios are the financial performance ratio which focuses on the balance sheet
of the company to evaluate the liquidity risk of the company and measure that whether the
company is able to pay all the current debt of the company on the basis of the available
current assets and fund of the business (Higgins, 2012).
The current assets and current liabilities head of the business has mainly been focused
in order to measure the liquidity position of the business. Current ratio and quick ratio of the
business has been calculated and compared with the other company. on the basis of the
current ratio of Azure health care limited (AZV) and Brain Resource Ltd (BRC), it has been
found that the current ratio level of Brain Resource Ltd limited is higher in the industry which
Paraphrase This Document
Need a fresh take? Get an instant paraphrase of this document with our AI Paraphraser
Finance for business - Masters
5
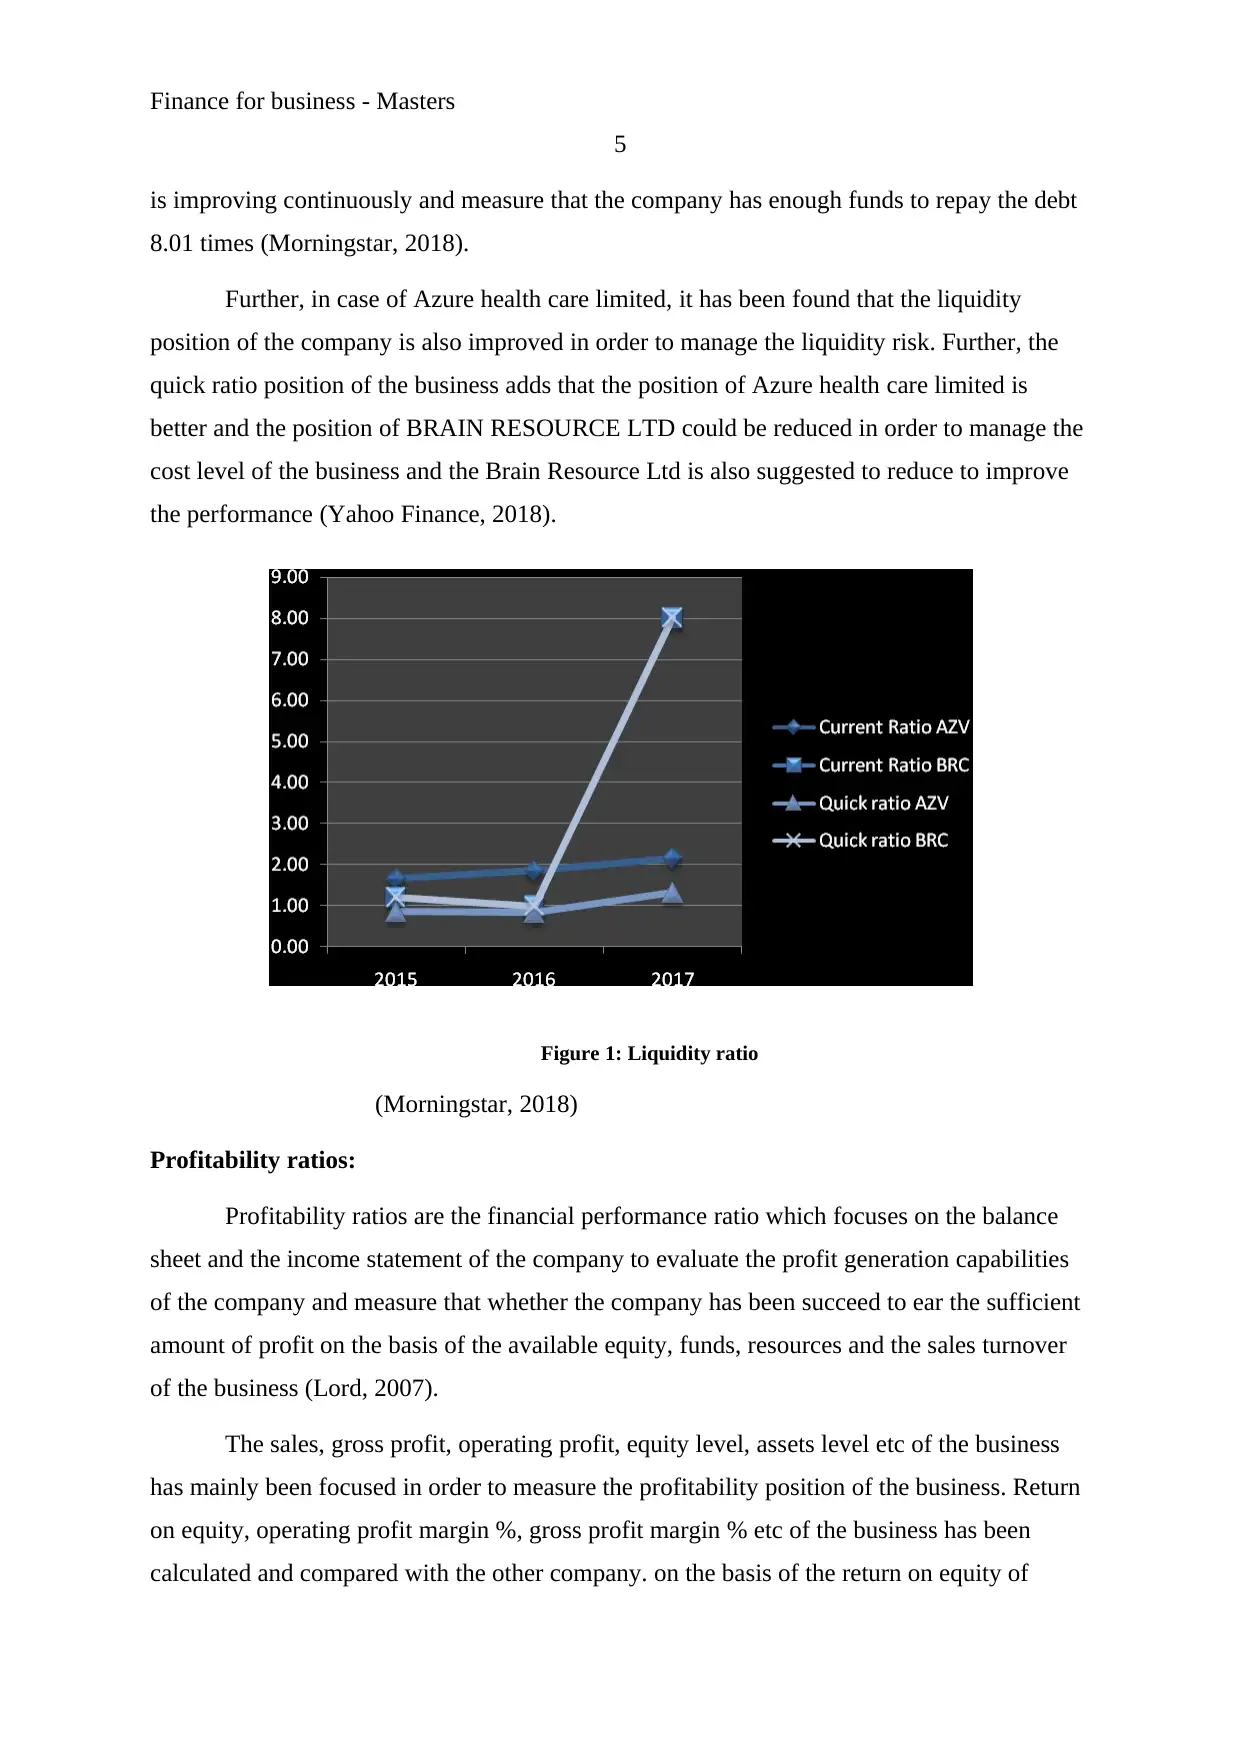
is improving continuously and measure that the company has enough funds to repay the debt
8.01 times (Morningstar, 2018).
Further, in case of Azure health care limited, it has been found that the liquidity
position of the company is also improved in order to manage the liquidity risk. Further, the
quick ratio position of the business adds that the position of Azure health care limited is
better and the position of BRAIN RESOURCE LTD could be reduced in order to manage the
cost level of the business and the Brain Resource Ltd is also suggested to reduce to improve
the performance (Yahoo Finance, 2018).
Figure 1: Liquidity ratio
(Morningstar, 2018)
Profitability ratios:
Profitability ratios are the financial performance ratio which focuses on the balance
sheet and the income statement of the company to evaluate the profit generation capabilities
of the company and measure that whether the company has been succeed to ear the sufficient
amount of profit on the basis of the available equity, funds, resources and the sales turnover
of the business (Lord, 2007).
The sales, gross profit, operating profit, equity level, assets level etc of the business
has mainly been focused in order to measure the profitability position of the business. Return
on equity, operating profit margin %, gross profit margin % etc of the business has been
calculated and compared with the other company. on the basis of the return on equity of
5
is improving continuously and measure that the company has enough funds to repay the debt
8.01 times (Morningstar, 2018).
Further, in case of Azure health care limited, it has been found that the liquidity
position of the company is also improved in order to manage the liquidity risk. Further, the
quick ratio position of the business adds that the position of Azure health care limited is
better and the position of BRAIN RESOURCE LTD could be reduced in order to manage the
cost level of the business and the Brain Resource Ltd is also suggested to reduce to improve
the performance (Yahoo Finance, 2018).
Figure 1: Liquidity ratio
(Morningstar, 2018)
Profitability ratios:
Profitability ratios are the financial performance ratio which focuses on the balance
sheet and the income statement of the company to evaluate the profit generation capabilities
of the company and measure that whether the company has been succeed to ear the sufficient
amount of profit on the basis of the available equity, funds, resources and the sales turnover
of the business (Lord, 2007).
The sales, gross profit, operating profit, equity level, assets level etc of the business
has mainly been focused in order to measure the profitability position of the business. Return
on equity, operating profit margin %, gross profit margin % etc of the business has been
calculated and compared with the other company. on the basis of the return on equity of
Finance for business - Masters
6
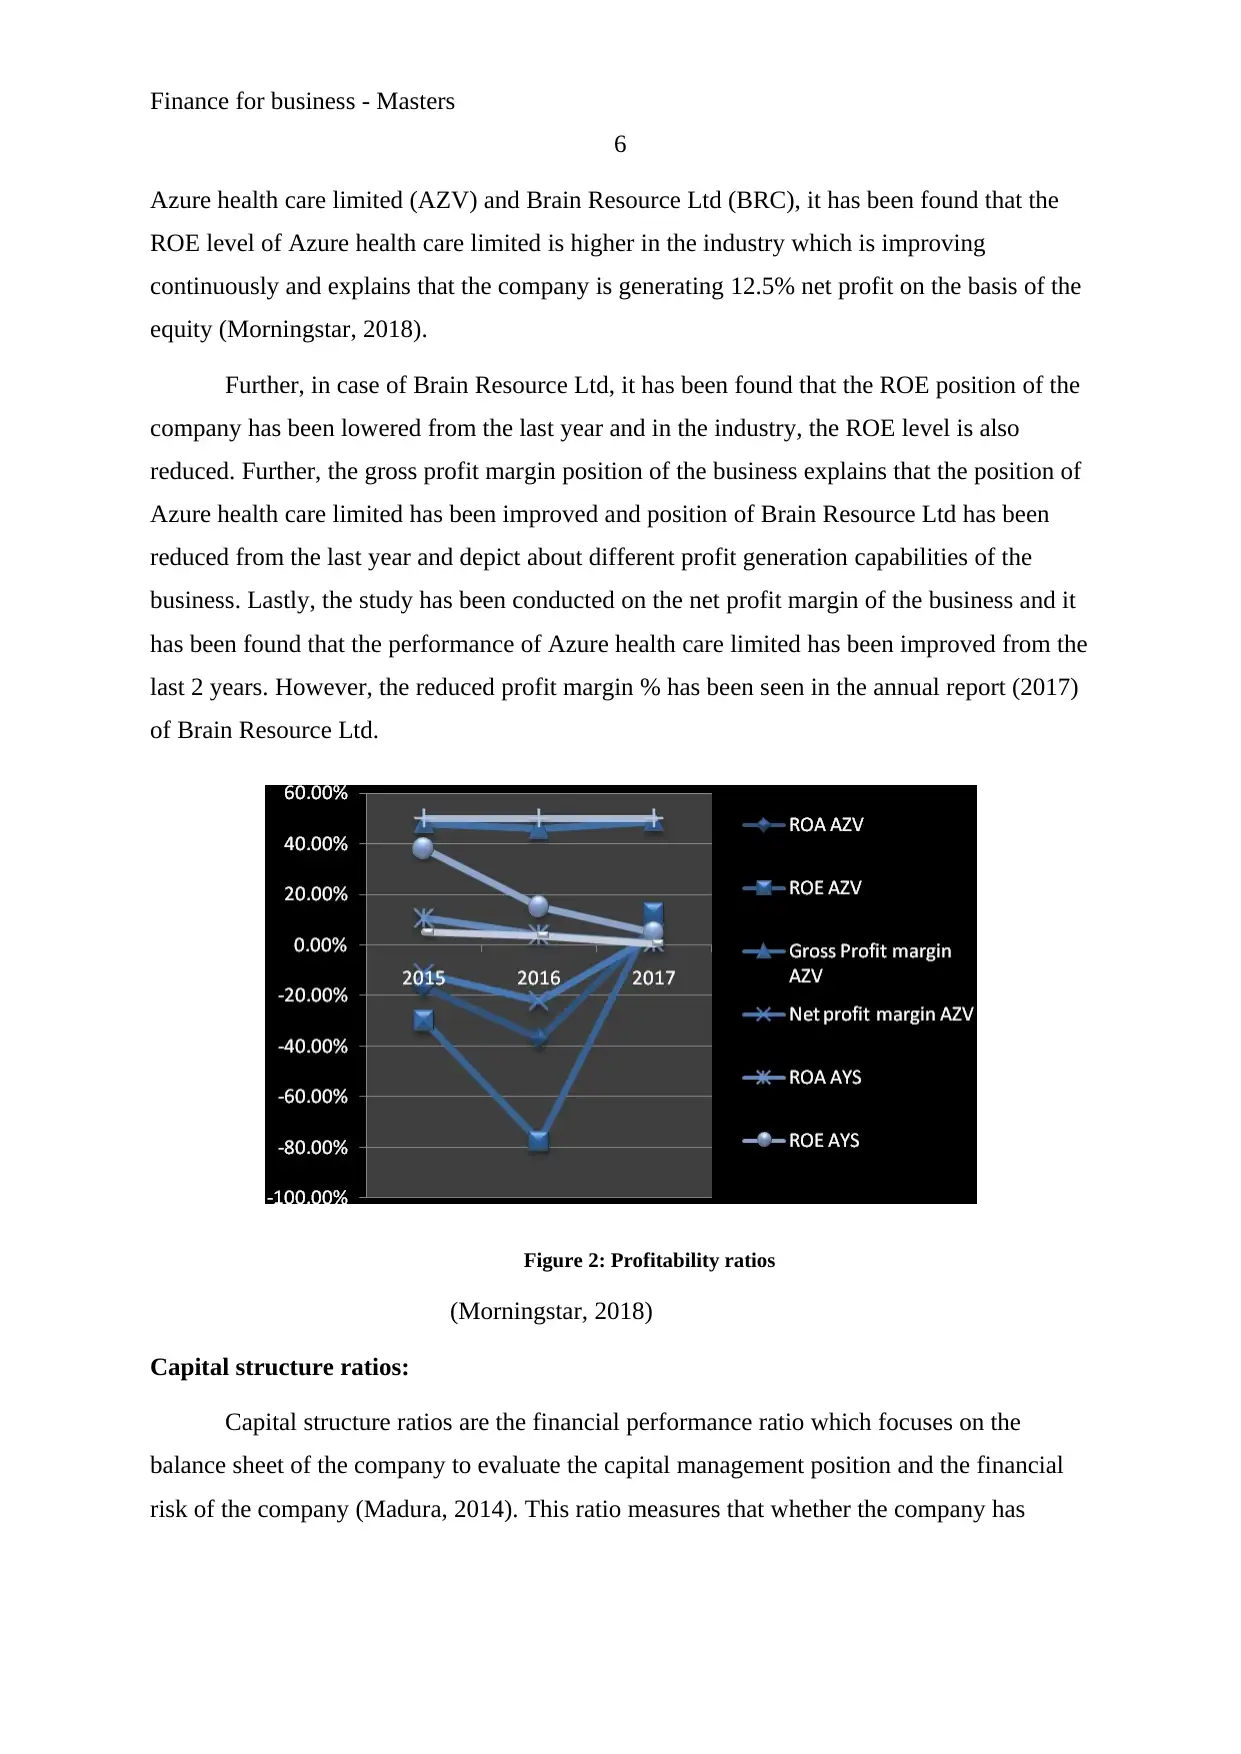
Azure health care limited (AZV) and Brain Resource Ltd (BRC), it has been found that the
ROE level of Azure health care limited is higher in the industry which is improving
continuously and explains that the company is generating 12.5% net profit on the basis of the
equity (Morningstar, 2018).
Further, in case of Brain Resource Ltd, it has been found that the ROE position of the
company has been lowered from the last year and in the industry, the ROE level is also
reduced. Further, the gross profit margin position of the business explains that the position of
Azure health care limited has been improved and position of Brain Resource Ltd has been
reduced from the last year and depict about different profit generation capabilities of the
business. Lastly, the study has been conducted on the net profit margin of the business and it
has been found that the performance of Azure health care limited has been improved from the
last 2 years. However, the reduced profit margin % has been seen in the annual report (2017)
of Brain Resource Ltd.
Figure 2: Profitability ratios
(Morningstar, 2018)
Capital structure ratios:
Capital structure ratios are the financial performance ratio which focuses on the
balance sheet of the company to evaluate the capital management position and the financial
risk of the company (Madura, 2014). This ratio measures that whether the company has
6
Azure health care limited (AZV) and Brain Resource Ltd (BRC), it has been found that the
ROE level of Azure health care limited is higher in the industry which is improving
continuously and explains that the company is generating 12.5% net profit on the basis of the
equity (Morningstar, 2018).
Further, in case of Brain Resource Ltd, it has been found that the ROE position of the
company has been lowered from the last year and in the industry, the ROE level is also
reduced. Further, the gross profit margin position of the business explains that the position of
Azure health care limited has been improved and position of Brain Resource Ltd has been
reduced from the last year and depict about different profit generation capabilities of the
business. Lastly, the study has been conducted on the net profit margin of the business and it
has been found that the performance of Azure health care limited has been improved from the
last 2 years. However, the reduced profit margin % has been seen in the annual report (2017)
of Brain Resource Ltd.
Figure 2: Profitability ratios
(Morningstar, 2018)
Capital structure ratios:
Capital structure ratios are the financial performance ratio which focuses on the
balance sheet of the company to evaluate the capital management position and the financial
risk of the company (Madura, 2014). This ratio measures that whether the company has
⊘ This is a preview!⊘
Do you want full access?
Subscribe today to unlock all pages.
Trusted by 1+ million students worldwide
Finance for business - Masters
7
raised the debt and equity in a proper way so that the cost and the risk of the business could
be reduced.
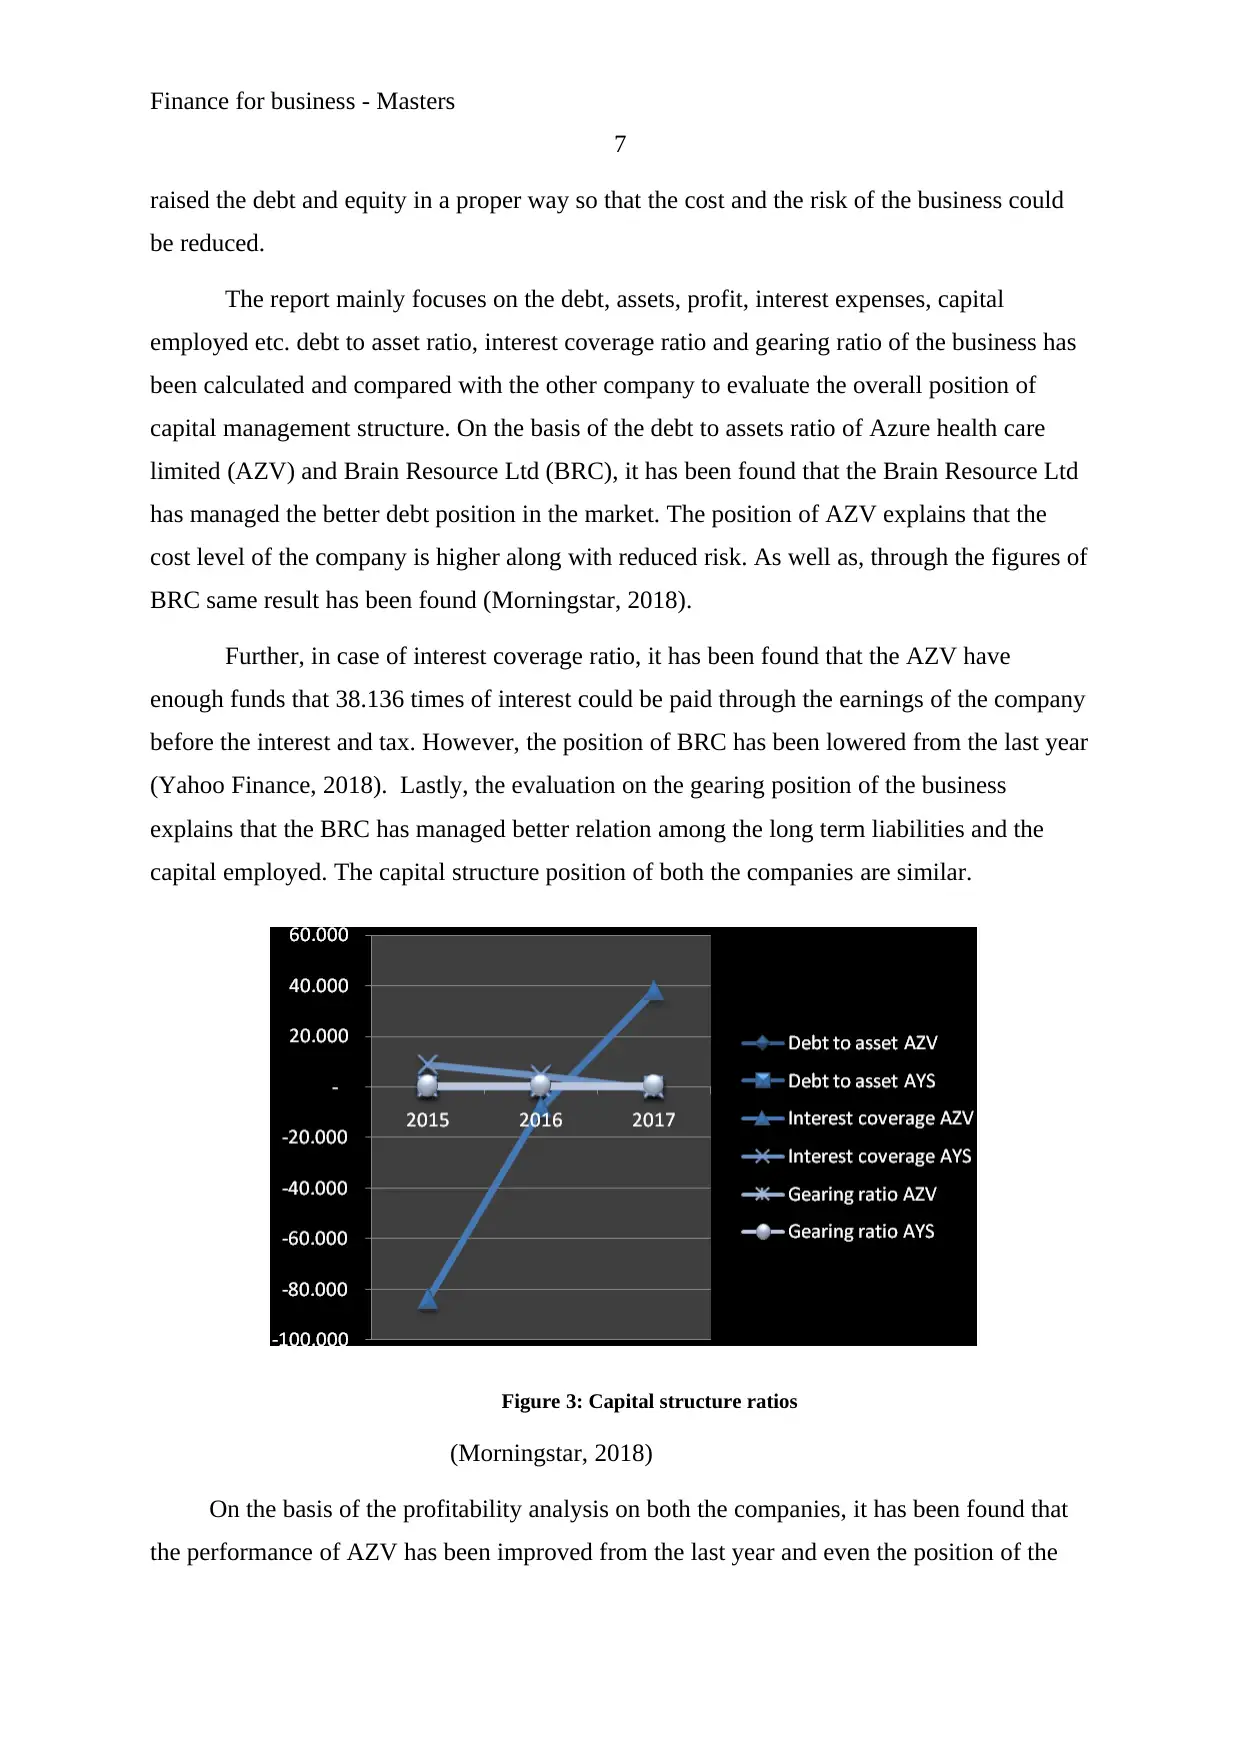
The report mainly focuses on the debt, assets, profit, interest expenses, capital
employed etc. debt to asset ratio, interest coverage ratio and gearing ratio of the business has
been calculated and compared with the other company to evaluate the overall position of
capital management structure. On the basis of the debt to assets ratio of Azure health care
limited (AZV) and Brain Resource Ltd (BRC), it has been found that the Brain Resource Ltd
has managed the better debt position in the market. The position of AZV explains that the
cost level of the company is higher along with reduced risk. As well as, through the figures of
BRC same result has been found (Morningstar, 2018).
Further, in case of interest coverage ratio, it has been found that the AZV have
enough funds that 38.136 times of interest could be paid through the earnings of the company
before the interest and tax. However, the position of BRC has been lowered from the last year
(Yahoo Finance, 2018). Lastly, the evaluation on the gearing position of the business
explains that the BRC has managed better relation among the long term liabilities and the
capital employed. The capital structure position of both the companies are similar.
Figure 3: Capital structure ratios
(Morningstar, 2018)
On the basis of the profitability analysis on both the companies, it has been found that
the performance of AZV has been improved from the last year and even the position of the
7
raised the debt and equity in a proper way so that the cost and the risk of the business could
be reduced.
The report mainly focuses on the debt, assets, profit, interest expenses, capital
employed etc. debt to asset ratio, interest coverage ratio and gearing ratio of the business has
been calculated and compared with the other company to evaluate the overall position of
capital management structure. On the basis of the debt to assets ratio of Azure health care
limited (AZV) and Brain Resource Ltd (BRC), it has been found that the Brain Resource Ltd
has managed the better debt position in the market. The position of AZV explains that the
cost level of the company is higher along with reduced risk. As well as, through the figures of
BRC same result has been found (Morningstar, 2018).
Further, in case of interest coverage ratio, it has been found that the AZV have
enough funds that 38.136 times of interest could be paid through the earnings of the company
before the interest and tax. However, the position of BRC has been lowered from the last year
(Yahoo Finance, 2018). Lastly, the evaluation on the gearing position of the business
explains that the BRC has managed better relation among the long term liabilities and the
capital employed. The capital structure position of both the companies are similar.
Figure 3: Capital structure ratios
(Morningstar, 2018)
On the basis of the profitability analysis on both the companies, it has been found that
the performance of AZV has been improved from the last year and even the position of the
Paraphrase This Document
Need a fresh take? Get an instant paraphrase of this document with our AI Paraphraser
Finance for business - Masters
8
company is better than BRC. Further, the liquidity position of the business adds that the risk
level of BRC is lowest and the cost level of AZV is bit higher (Bloomberg, 2018). Both the
companies are required to make the changes in the current assets of the business to manage
the liquidity risk position. Lastly, the study has been performed on the capital structure level.
The calculations and the analysis express the better capital structure position of AZV in the
market.
3. Stock price analysis:
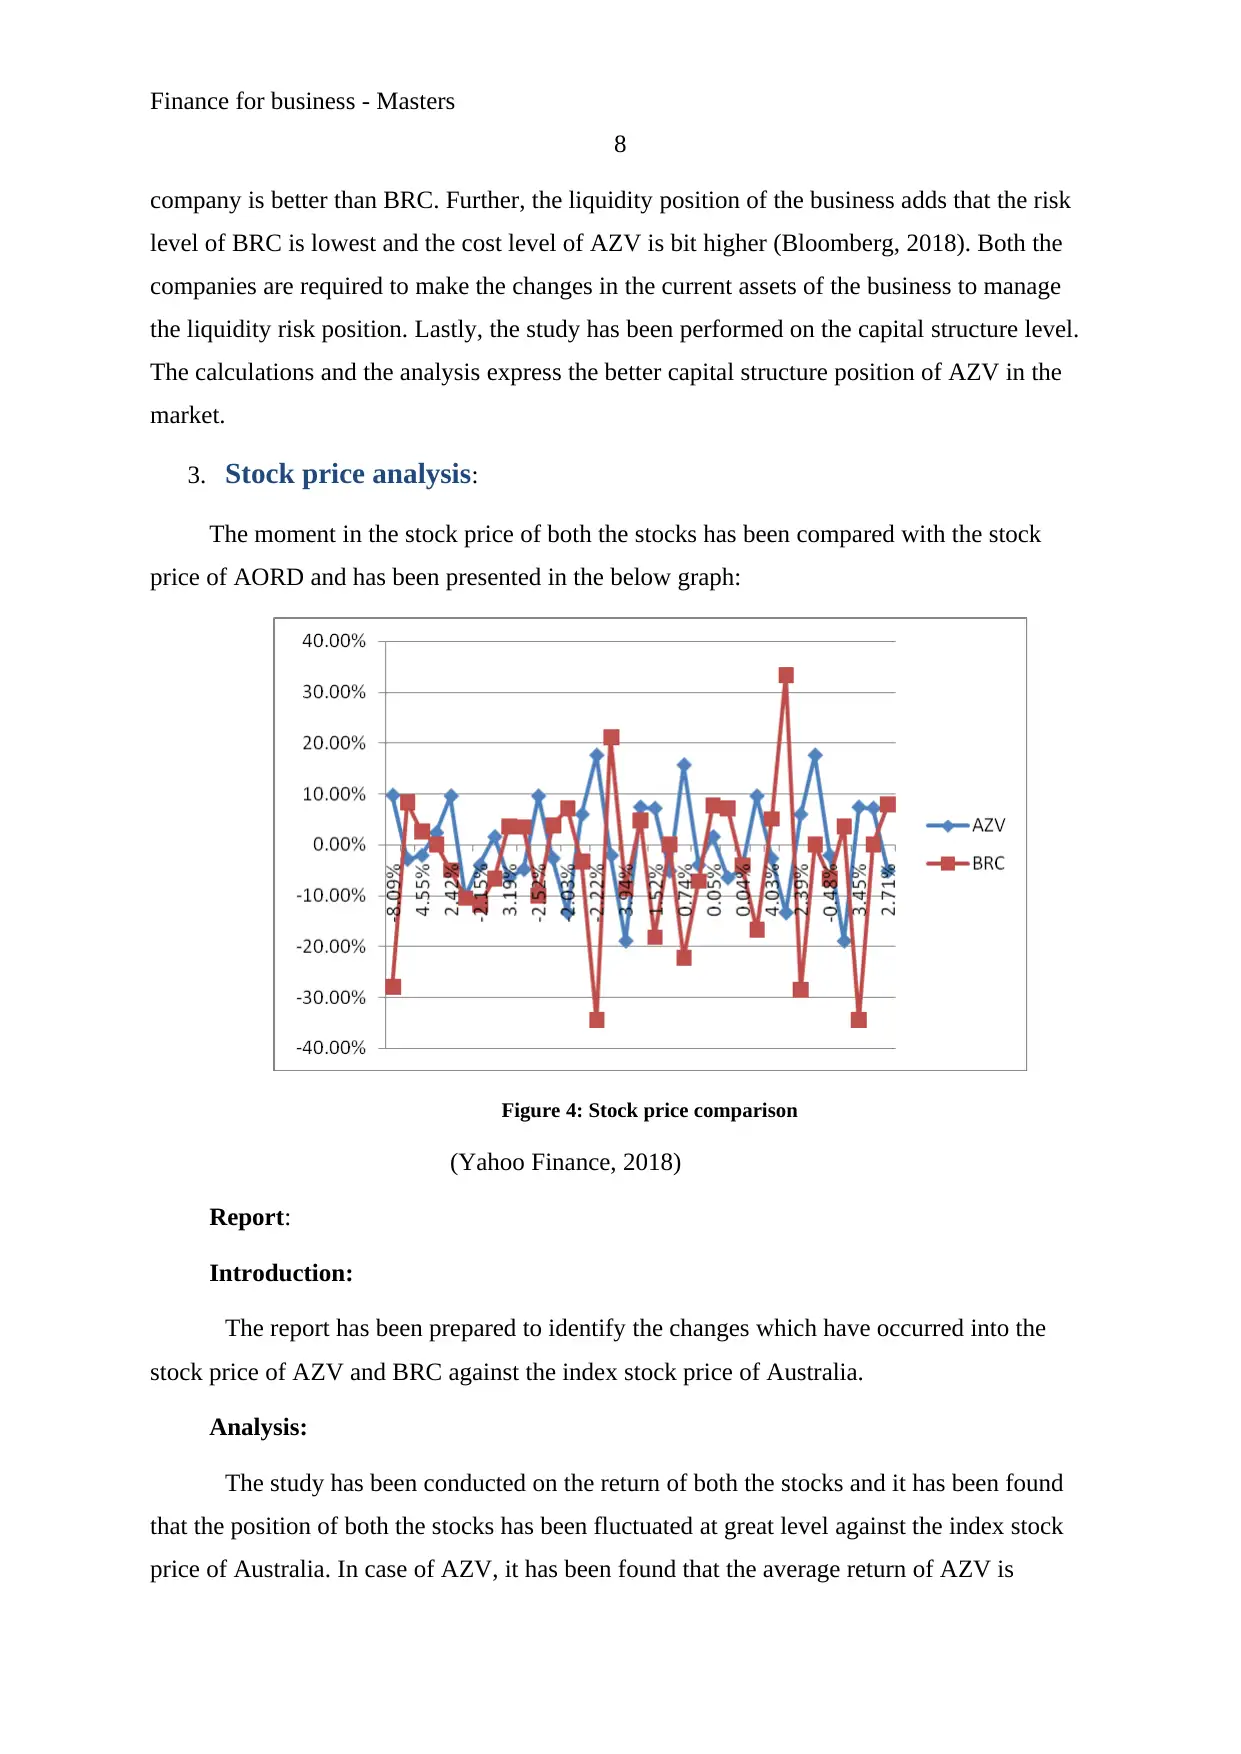
The moment in the stock price of both the stocks has been compared with the stock
price of AORD and has been presented in the below graph:
Figure 4: Stock price comparison
(Yahoo Finance, 2018)
Report:
Introduction:
The report has been prepared to identify the changes which have occurred into the
stock price of AZV and BRC against the index stock price of Australia.
Analysis:
The study has been conducted on the return of both the stocks and it has been found
that the position of both the stocks has been fluctuated at great level against the index stock
price of Australia. In case of AZV, it has been found that the average return of AZV is
8
company is better than BRC. Further, the liquidity position of the business adds that the risk
level of BRC is lowest and the cost level of AZV is bit higher (Bloomberg, 2018). Both the
companies are required to make the changes in the current assets of the business to manage
the liquidity risk position. Lastly, the study has been performed on the capital structure level.
The calculations and the analysis express the better capital structure position of AZV in the
market.
3. Stock price analysis:
The moment in the stock price of both the stocks has been compared with the stock
price of AORD and has been presented in the below graph:
Figure 4: Stock price comparison
(Yahoo Finance, 2018)
Report:
Introduction:
The report has been prepared to identify the changes which have occurred into the
stock price of AZV and BRC against the index stock price of Australia.
Analysis:
The study has been conducted on the return of both the stocks and it has been found
that the position of both the stocks has been fluctuated at great level against the index stock
price of Australia. In case of AZV, it has been found that the average return of AZV is
Finance for business - Masters
9
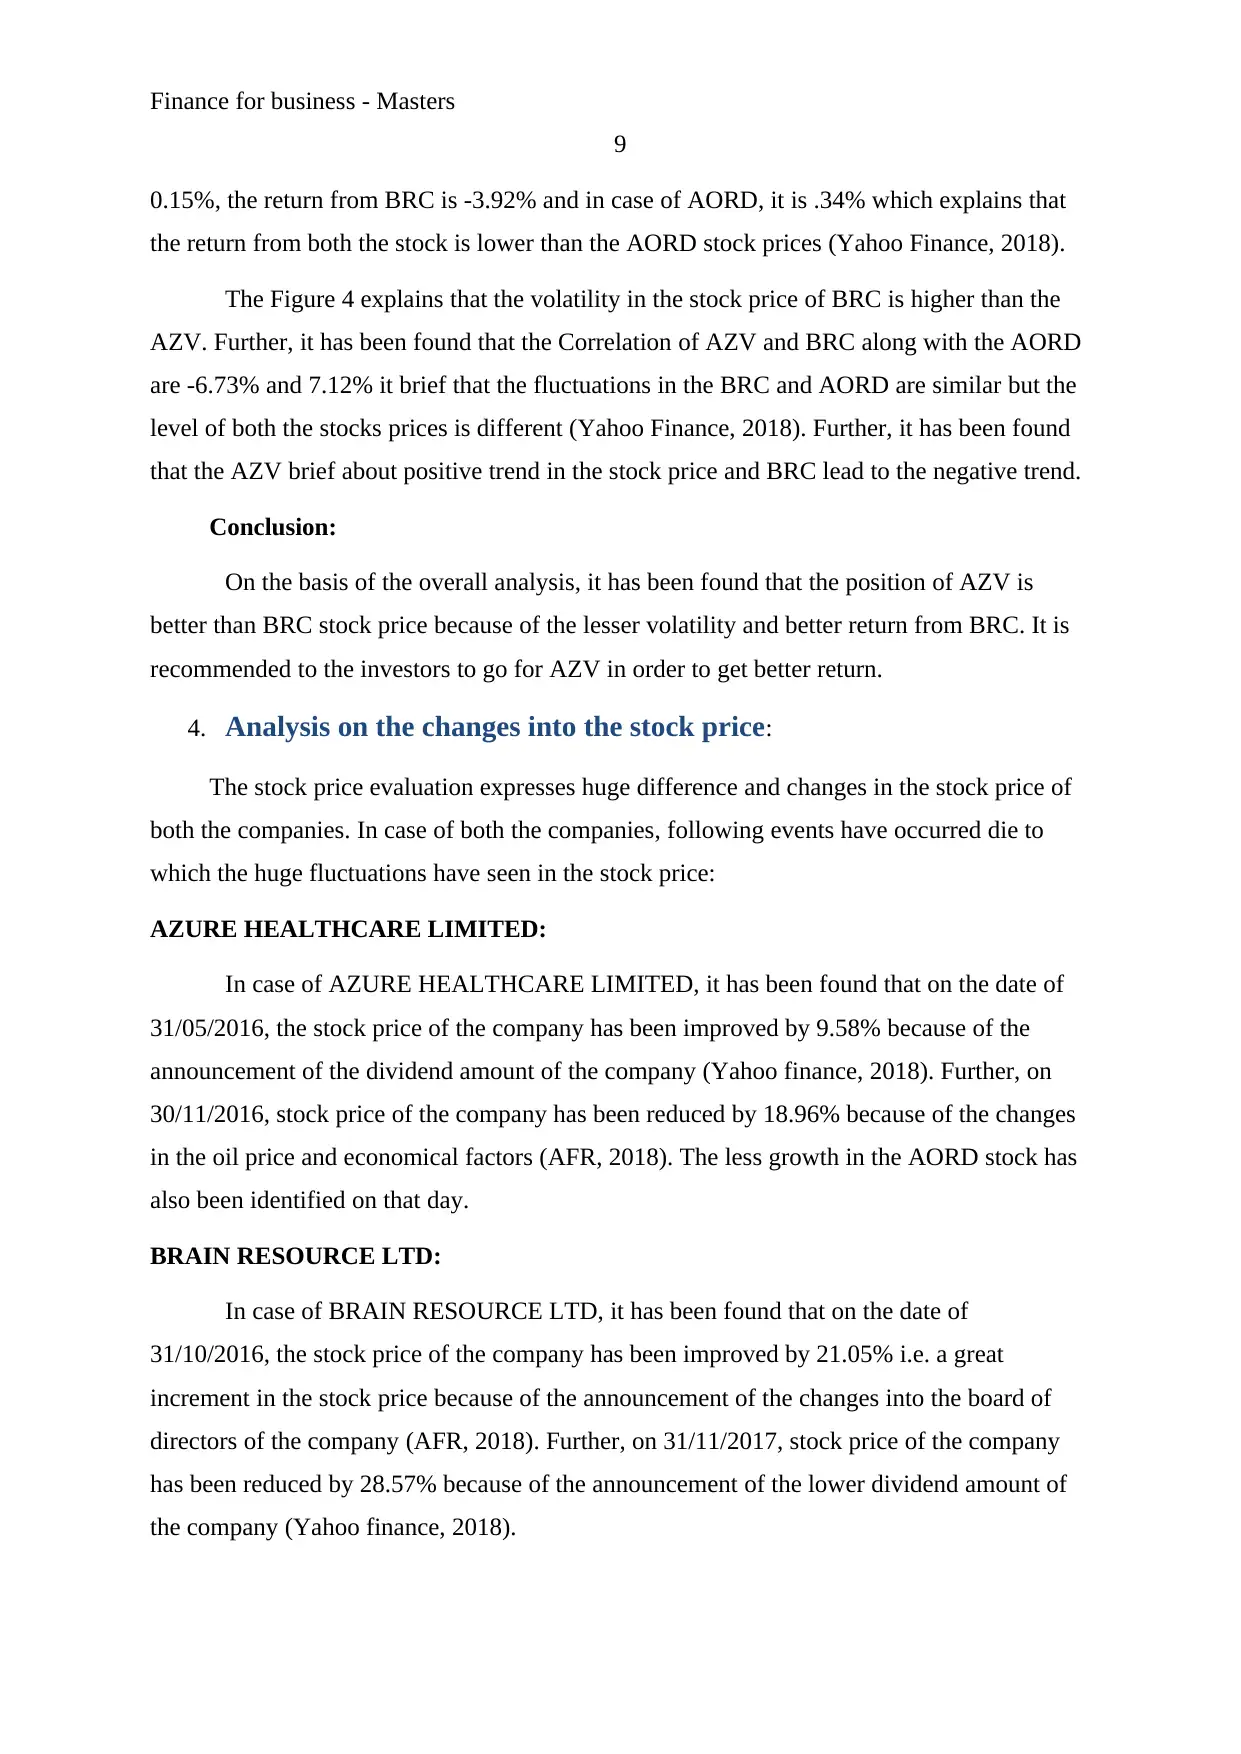
0.15%, the return from BRC is -3.92% and in case of AORD, it is .34% which explains that
the return from both the stock is lower than the AORD stock prices (Yahoo Finance, 2018).
The Figure 4 explains that the volatility in the stock price of BRC is higher than the
AZV. Further, it has been found that the Correlation of AZV and BRC along with the AORD
are -6.73% and 7.12% it brief that the fluctuations in the BRC and AORD are similar but the
level of both the stocks prices is different (Yahoo Finance, 2018). Further, it has been found
that the AZV brief about positive trend in the stock price and BRC lead to the negative trend.
Conclusion:
On the basis of the overall analysis, it has been found that the position of AZV is
better than BRC stock price because of the lesser volatility and better return from BRC. It is
recommended to the investors to go for AZV in order to get better return.
4. Analysis on the changes into the stock price:
The stock price evaluation expresses huge difference and changes in the stock price of
both the companies. In case of both the companies, following events have occurred die to
which the huge fluctuations have seen in the stock price:
AZURE HEALTHCARE LIMITED:
In case of AZURE HEALTHCARE LIMITED, it has been found that on the date of
31/05/2016, the stock price of the company has been improved by 9.58% because of the
announcement of the dividend amount of the company (Yahoo finance, 2018). Further, on
30/11/2016, stock price of the company has been reduced by 18.96% because of the changes
in the oil price and economical factors (AFR, 2018). The less growth in the AORD stock has
also been identified on that day.
BRAIN RESOURCE LTD:
In case of BRAIN RESOURCE LTD, it has been found that on the date of
31/10/2016, the stock price of the company has been improved by 21.05% i.e. a great
increment in the stock price because of the announcement of the changes into the board of
directors of the company (AFR, 2018). Further, on 31/11/2017, stock price of the company
has been reduced by 28.57% because of the announcement of the lower dividend amount of
the company (Yahoo finance, 2018).
9
0.15%, the return from BRC is -3.92% and in case of AORD, it is .34% which explains that
the return from both the stock is lower than the AORD stock prices (Yahoo Finance, 2018).
The Figure 4 explains that the volatility in the stock price of BRC is higher than the
AZV. Further, it has been found that the Correlation of AZV and BRC along with the AORD
are -6.73% and 7.12% it brief that the fluctuations in the BRC and AORD are similar but the
level of both the stocks prices is different (Yahoo Finance, 2018). Further, it has been found
that the AZV brief about positive trend in the stock price and BRC lead to the negative trend.
Conclusion:
On the basis of the overall analysis, it has been found that the position of AZV is
better than BRC stock price because of the lesser volatility and better return from BRC. It is
recommended to the investors to go for AZV in order to get better return.
4. Analysis on the changes into the stock price:
The stock price evaluation expresses huge difference and changes in the stock price of
both the companies. In case of both the companies, following events have occurred die to
which the huge fluctuations have seen in the stock price:
AZURE HEALTHCARE LIMITED:
In case of AZURE HEALTHCARE LIMITED, it has been found that on the date of
31/05/2016, the stock price of the company has been improved by 9.58% because of the
announcement of the dividend amount of the company (Yahoo finance, 2018). Further, on
30/11/2016, stock price of the company has been reduced by 18.96% because of the changes
in the oil price and economical factors (AFR, 2018). The less growth in the AORD stock has
also been identified on that day.
BRAIN RESOURCE LTD:
In case of BRAIN RESOURCE LTD, it has been found that on the date of
31/10/2016, the stock price of the company has been improved by 21.05% i.e. a great
increment in the stock price because of the announcement of the changes into the board of
directors of the company (AFR, 2018). Further, on 31/11/2017, stock price of the company
has been reduced by 28.57% because of the announcement of the lower dividend amount of
the company (Yahoo finance, 2018).
⊘ This is a preview!⊘
Do you want full access?
Subscribe today to unlock all pages.
Trusted by 1+ million students worldwide
Finance for business - Masters
10
It expresses that various changes have takes place in both the businesses which has
affected the stock position of both the companies at great level.
5. Calculation on beta and cost of equity:
The Reuters (2018) explains that the beta of AZV is 2.48 and the beta of BRC is 0.36.
The beta of AZV explains about huge risk and the volatility in the stock price of the business.
It expresses that the fluctuation in the stock of the business is very much higher in context
with the AORD stock price.
On the basis of the beta from Reuters (2018) and the market risk premium 6% and the
risk free rate of 5%, the CAPM calculations have been done on both the companies to
measure the cost of equity of the business.
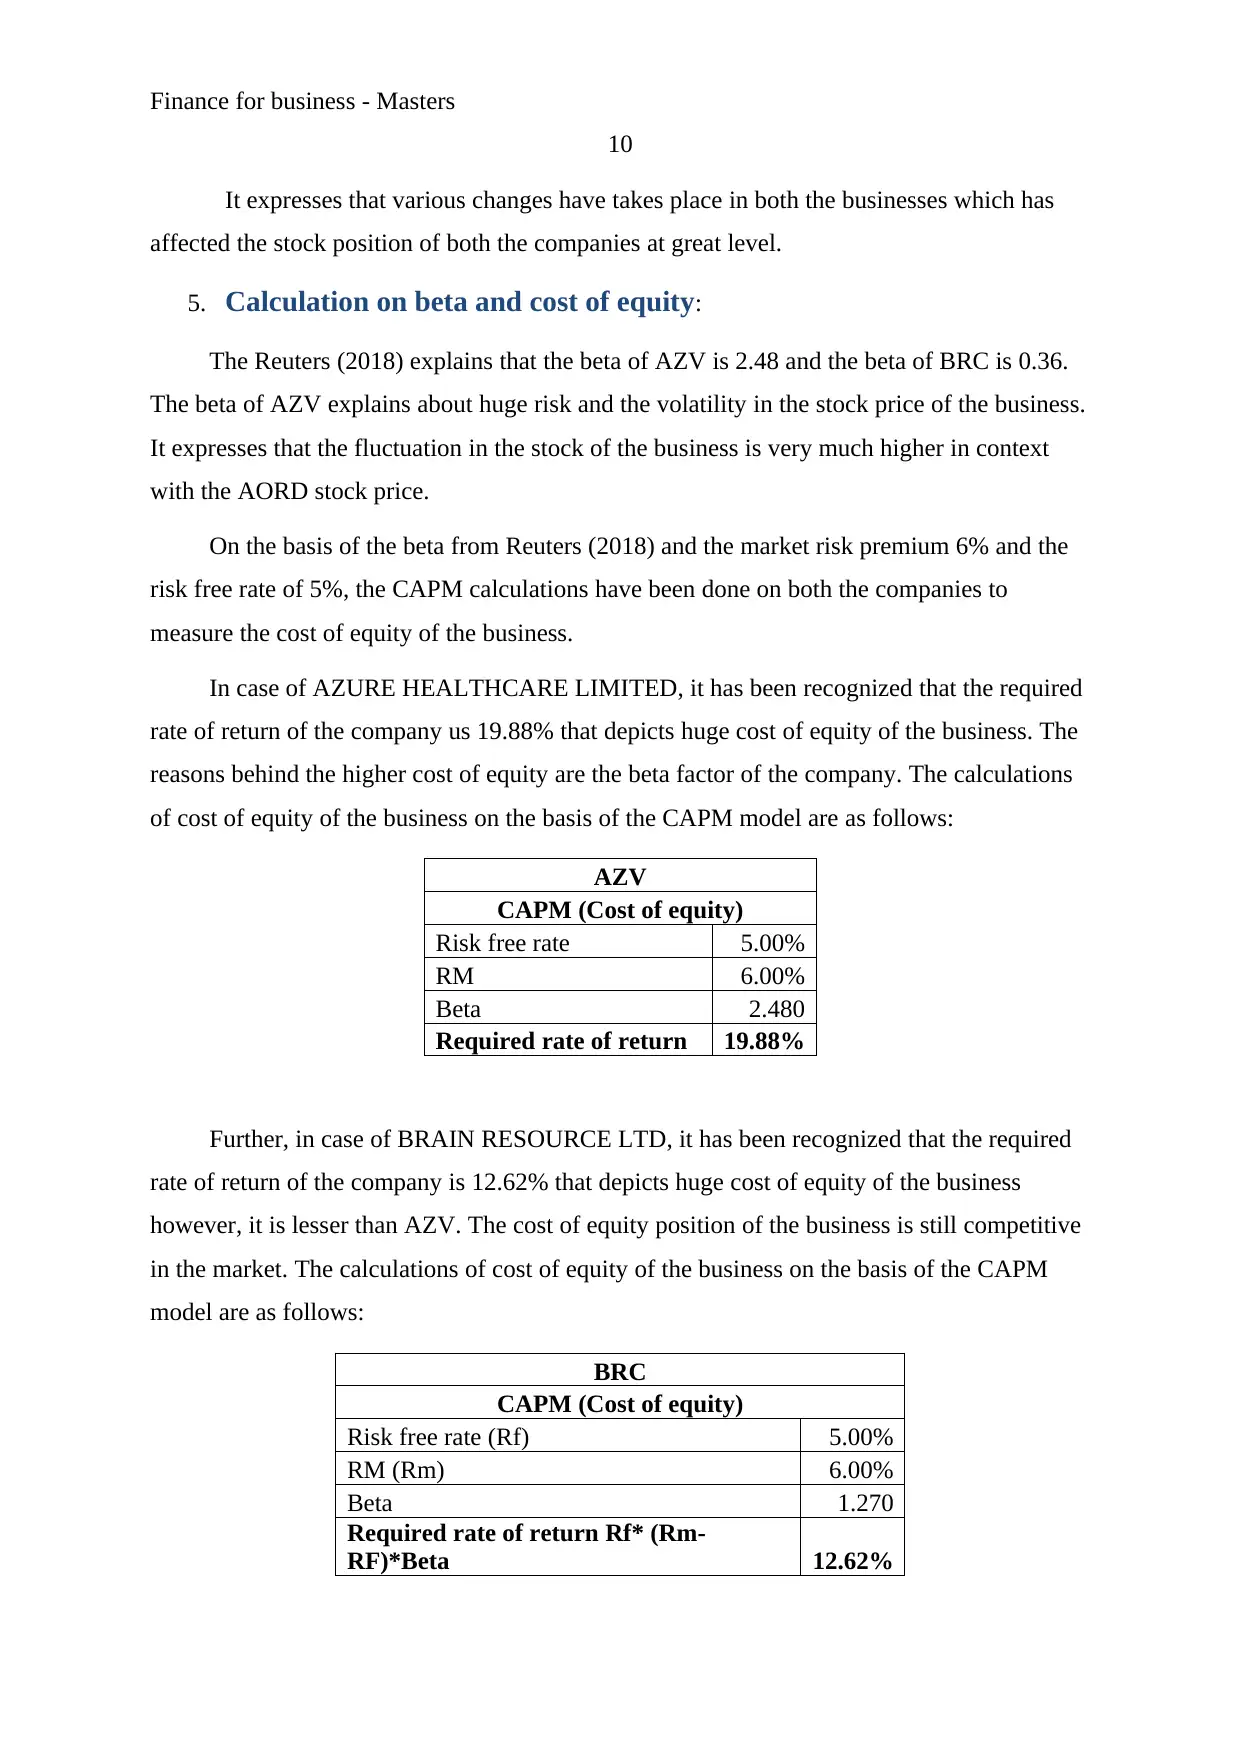
In case of AZURE HEALTHCARE LIMITED, it has been recognized that the required
rate of return of the company us 19.88% that depicts huge cost of equity of the business. The
reasons behind the higher cost of equity are the beta factor of the company. The calculations
of cost of equity of the business on the basis of the CAPM model are as follows:
AZV
CAPM (Cost of equity)
Risk free rate 5.00%
RM 6.00%
Beta 2.480
Required rate of return 19.88%
Further, in case of BRAIN RESOURCE LTD, it has been recognized that the required
rate of return of the company is 12.62% that depicts huge cost of equity of the business
however, it is lesser than AZV. The cost of equity position of the business is still competitive
in the market. The calculations of cost of equity of the business on the basis of the CAPM
model are as follows:
BRC
CAPM (Cost of equity)
Risk free rate (Rf) 5.00%
RM (Rm) 6.00%
Beta 1.270
Required rate of return Rf* (Rm-
RF)*Beta 12.62%
10
It expresses that various changes have takes place in both the businesses which has
affected the stock position of both the companies at great level.
5. Calculation on beta and cost of equity:
The Reuters (2018) explains that the beta of AZV is 2.48 and the beta of BRC is 0.36.
The beta of AZV explains about huge risk and the volatility in the stock price of the business.
It expresses that the fluctuation in the stock of the business is very much higher in context
with the AORD stock price.
On the basis of the beta from Reuters (2018) and the market risk premium 6% and the
risk free rate of 5%, the CAPM calculations have been done on both the companies to
measure the cost of equity of the business.
In case of AZURE HEALTHCARE LIMITED, it has been recognized that the required
rate of return of the company us 19.88% that depicts huge cost of equity of the business. The
reasons behind the higher cost of equity are the beta factor of the company. The calculations
of cost of equity of the business on the basis of the CAPM model are as follows:
AZV
CAPM (Cost of equity)
Risk free rate 5.00%
RM 6.00%
Beta 2.480
Required rate of return 19.88%
Further, in case of BRAIN RESOURCE LTD, it has been recognized that the required
rate of return of the company is 12.62% that depicts huge cost of equity of the business
however, it is lesser than AZV. The cost of equity position of the business is still competitive
in the market. The calculations of cost of equity of the business on the basis of the CAPM
model are as follows:
BRC
CAPM (Cost of equity)
Risk free rate (Rf) 5.00%
RM (Rm) 6.00%
Beta 1.270
Required rate of return Rf* (Rm-
RF)*Beta 12.62%
Paraphrase This Document
Need a fresh take? Get an instant paraphrase of this document with our AI Paraphraser
Finance for business - Masters
11
6. Dividend policies:
The dividend policies of each of the business are different. The managers of the
company decide the dividend policies on the basis of the nature of the business and the
market position. Basically the most common dividend theories are relevant dividend theory
and irrelevant dividend theory. The relevant dividend theory of a business expresses that a
business must offer a great amount of net profit to the shareholders of the company in order
to retain them, attract new stockholders and manage the stock price of the company in the
capital market (Madura, 2014). The more the dividend would be offered to the stockholders
the more the rational shareholders would be attracted towards the business.
Further, the irrelevant theory of a business expresses that a business must offer a
nominal amount of net profit to the shareholders or must not pay at all profit of the company
in order to retain the amount for the future investment and internal funds of the business. The
theory explains that the more profitability position of the business would increase, the more
the stock price of the business would be increased (Lord, 2007). And thus the business is not
required to pay the dividend to the shareholders in order to keep them.
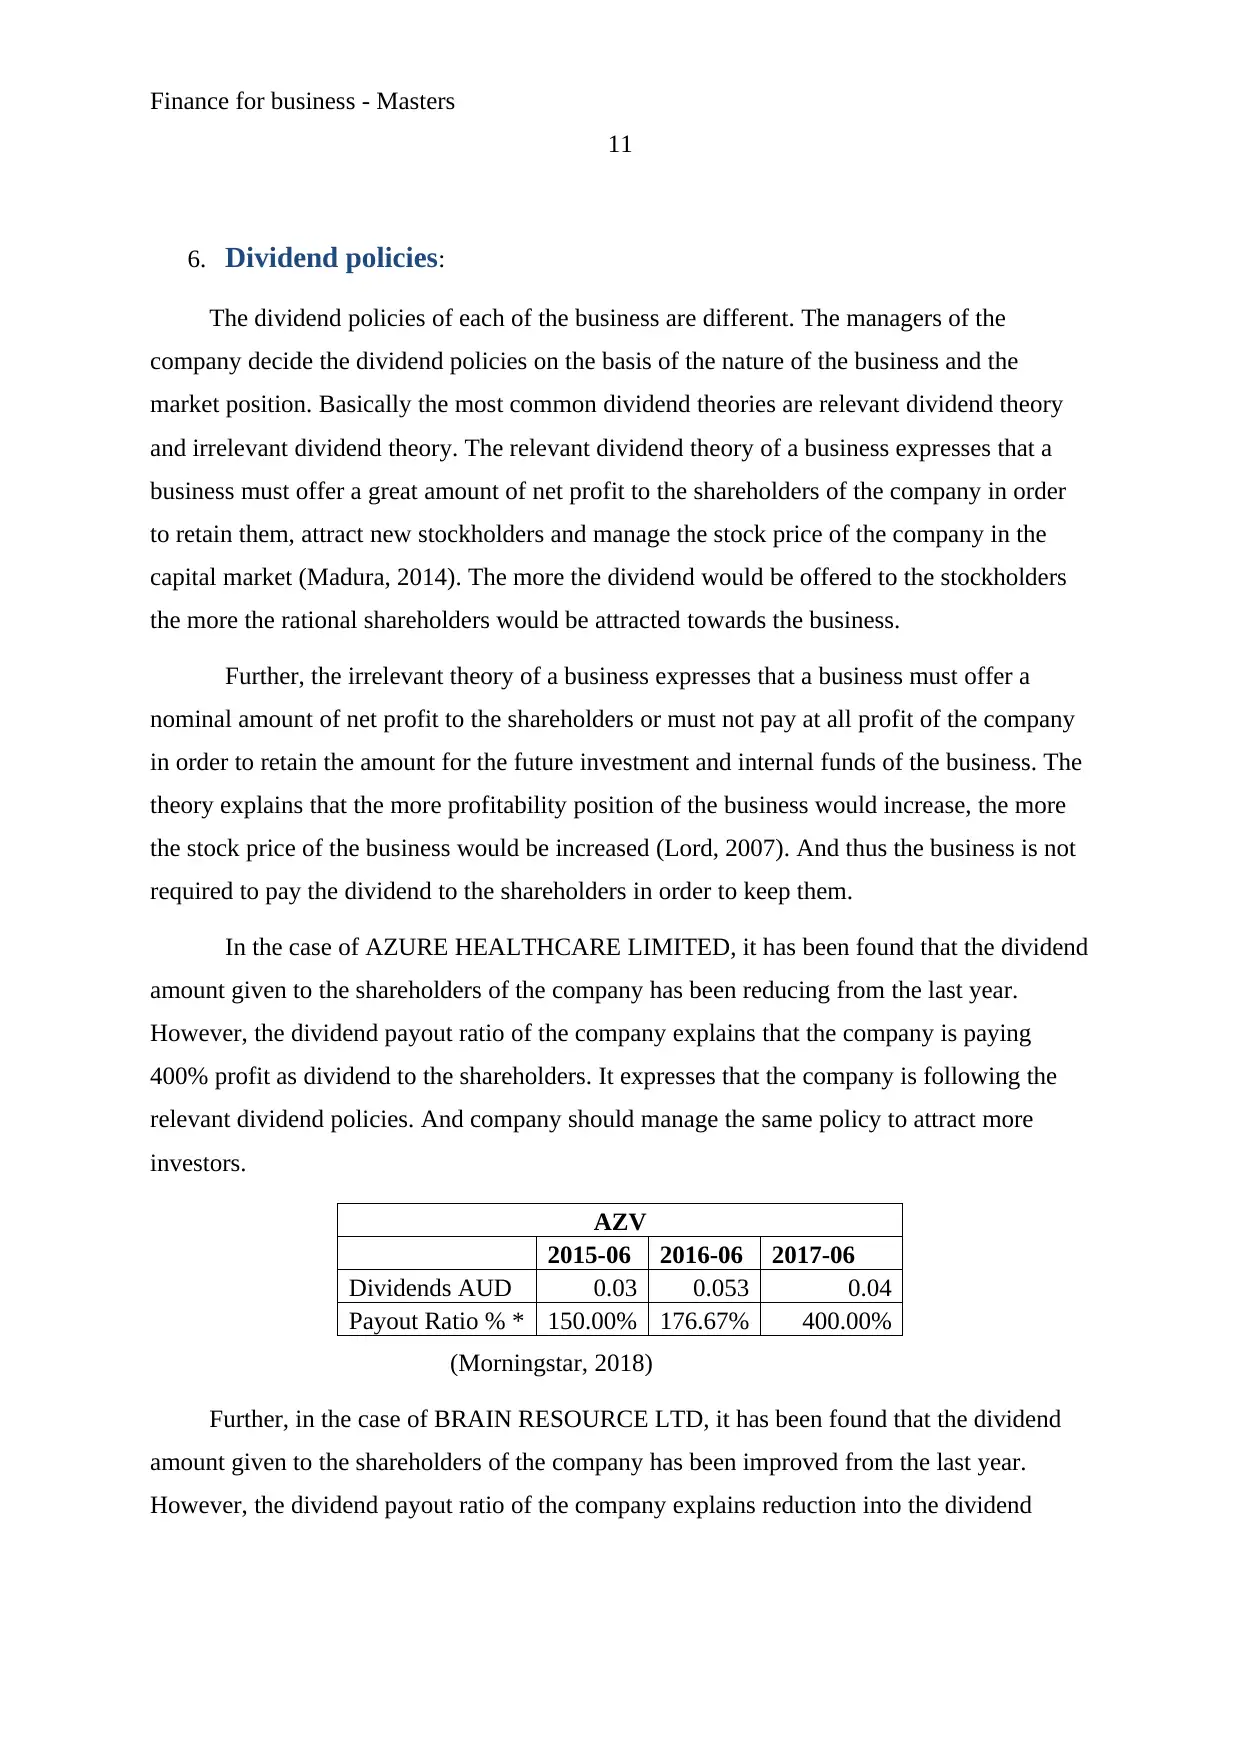
In the case of AZURE HEALTHCARE LIMITED, it has been found that the dividend
amount given to the shareholders of the company has been reducing from the last year.
However, the dividend payout ratio of the company explains that the company is paying
400% profit as dividend to the shareholders. It expresses that the company is following the
relevant dividend policies. And company should manage the same policy to attract more
investors.
AZV
2015-06 2016-06 2017-06
Dividends AUD 0.03 0.053 0.04
Payout Ratio % * 150.00% 176.67% 400.00%
(Morningstar, 2018)
Further, in the case of BRAIN RESOURCE LTD, it has been found that the dividend
amount given to the shareholders of the company has been improved from the last year.
However, the dividend payout ratio of the company explains reduction into the dividend
11
6. Dividend policies:
The dividend policies of each of the business are different. The managers of the
company decide the dividend policies on the basis of the nature of the business and the
market position. Basically the most common dividend theories are relevant dividend theory
and irrelevant dividend theory. The relevant dividend theory of a business expresses that a
business must offer a great amount of net profit to the shareholders of the company in order
to retain them, attract new stockholders and manage the stock price of the company in the
capital market (Madura, 2014). The more the dividend would be offered to the stockholders
the more the rational shareholders would be attracted towards the business.
Further, the irrelevant theory of a business expresses that a business must offer a
nominal amount of net profit to the shareholders or must not pay at all profit of the company
in order to retain the amount for the future investment and internal funds of the business. The
theory explains that the more profitability position of the business would increase, the more
the stock price of the business would be increased (Lord, 2007). And thus the business is not
required to pay the dividend to the shareholders in order to keep them.
In the case of AZURE HEALTHCARE LIMITED, it has been found that the dividend
amount given to the shareholders of the company has been reducing from the last year.
However, the dividend payout ratio of the company explains that the company is paying
400% profit as dividend to the shareholders. It expresses that the company is following the
relevant dividend policies. And company should manage the same policy to attract more
investors.
AZV
2015-06 2016-06 2017-06
Dividends AUD 0.03 0.053 0.04
Payout Ratio % * 150.00% 176.67% 400.00%
(Morningstar, 2018)
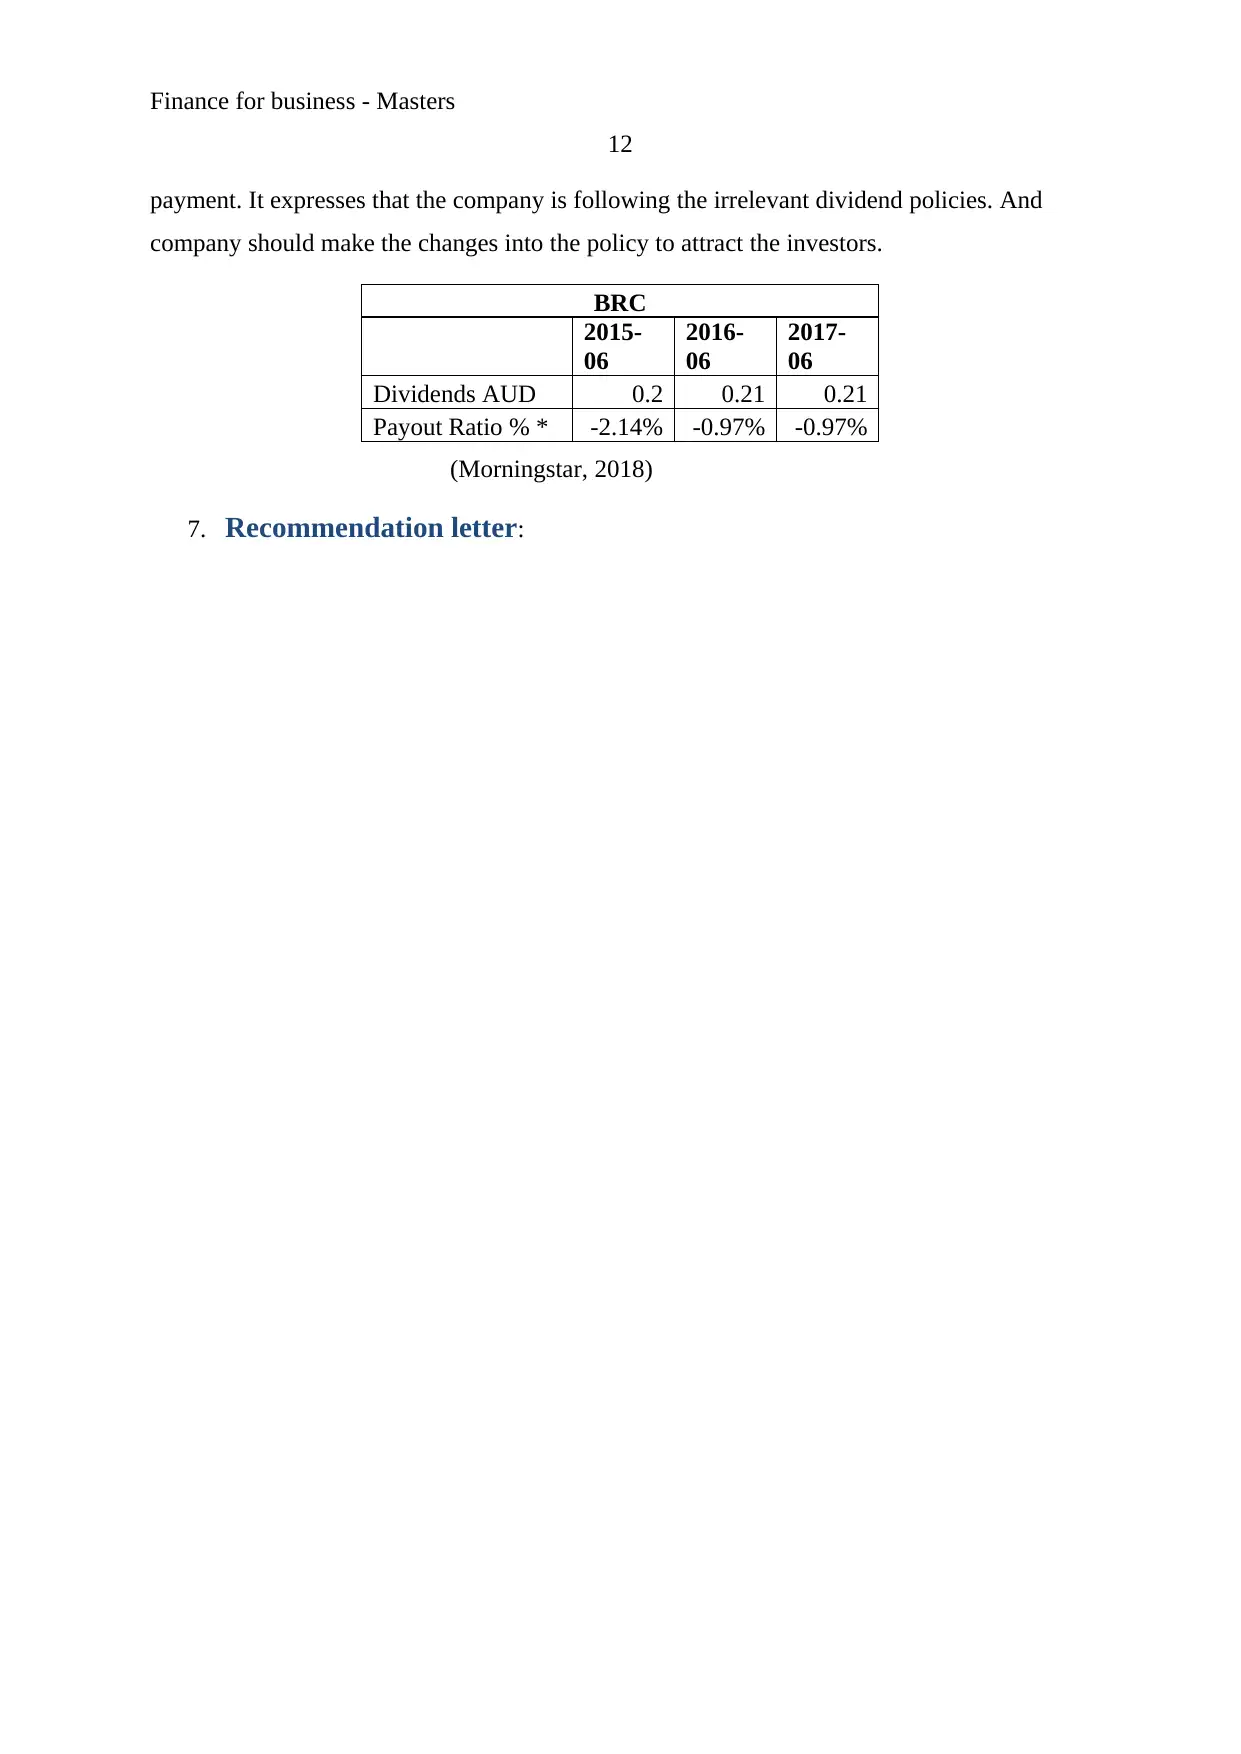
Further, in the case of BRAIN RESOURCE LTD, it has been found that the dividend
amount given to the shareholders of the company has been improved from the last year.
However, the dividend payout ratio of the company explains reduction into the dividend
Finance for business - Masters
12
payment. It expresses that the company is following the irrelevant dividend policies. And
company should make the changes into the policy to attract the investors.
BRC
2015-
06
2016-
06
2017-
06
Dividends AUD 0.2 0.21 0.21
Payout Ratio % * -2.14% -0.97% -0.97%
(Morningstar, 2018)
7. Recommendation letter:
⊘ This is a preview!⊘
Do you want full access?
Subscribe today to unlock all pages.
Trusted by 1+ million students worldwide
1 out of 25
Related Documents


Your All-in-One AI-Powered Toolkit for Academic Success.
+13062052269
info@desklib.com
Available 24*7 on WhatsApp / Email
![[object Object]](/_next/static/media/star-bottom.7253800d.svg)
Unlock your academic potential
Copyright © 2020–2026 A2Z Services. All Rights Reserved. Developed and managed by ZUCOL.