Visualization and Statistical Analysis of B17 Housing Market Data
VerifiedAdded on  2022/12/22
|23
|2931
|1
Report
AI Summary
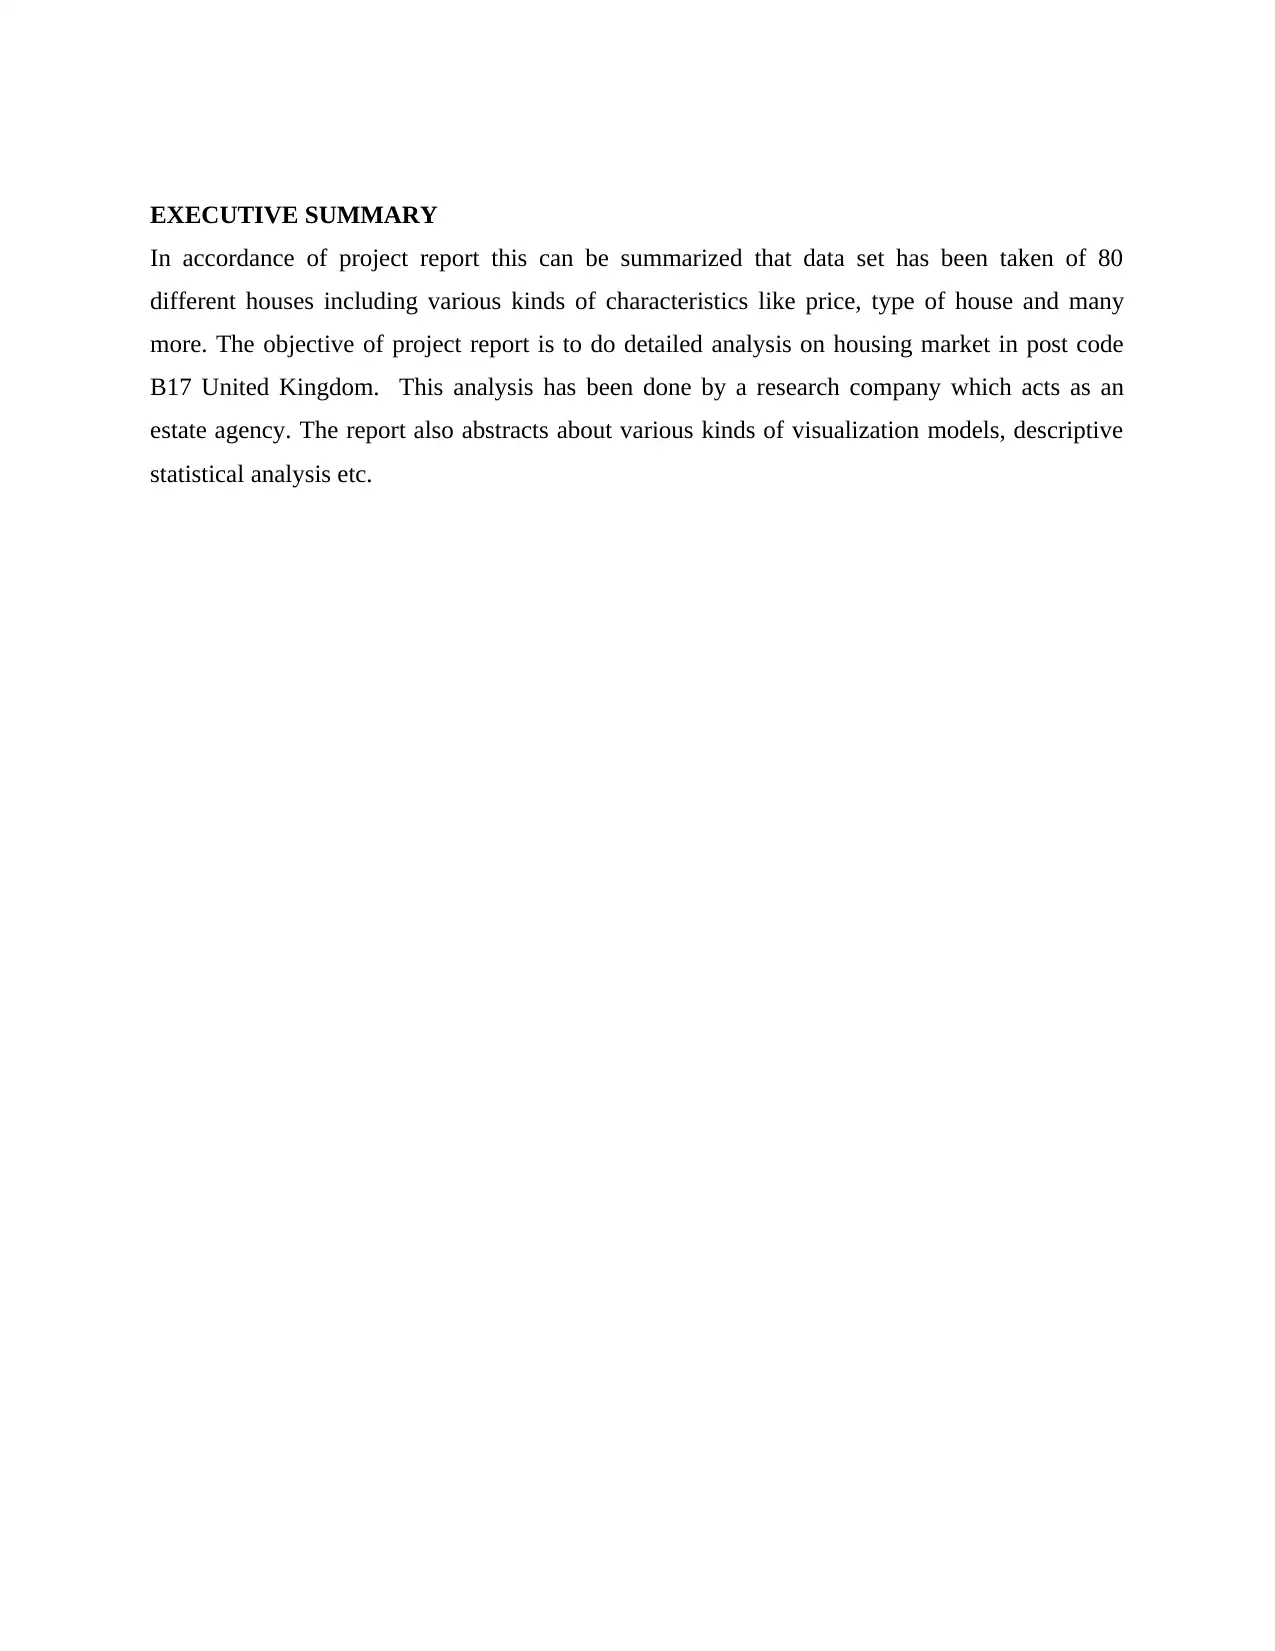
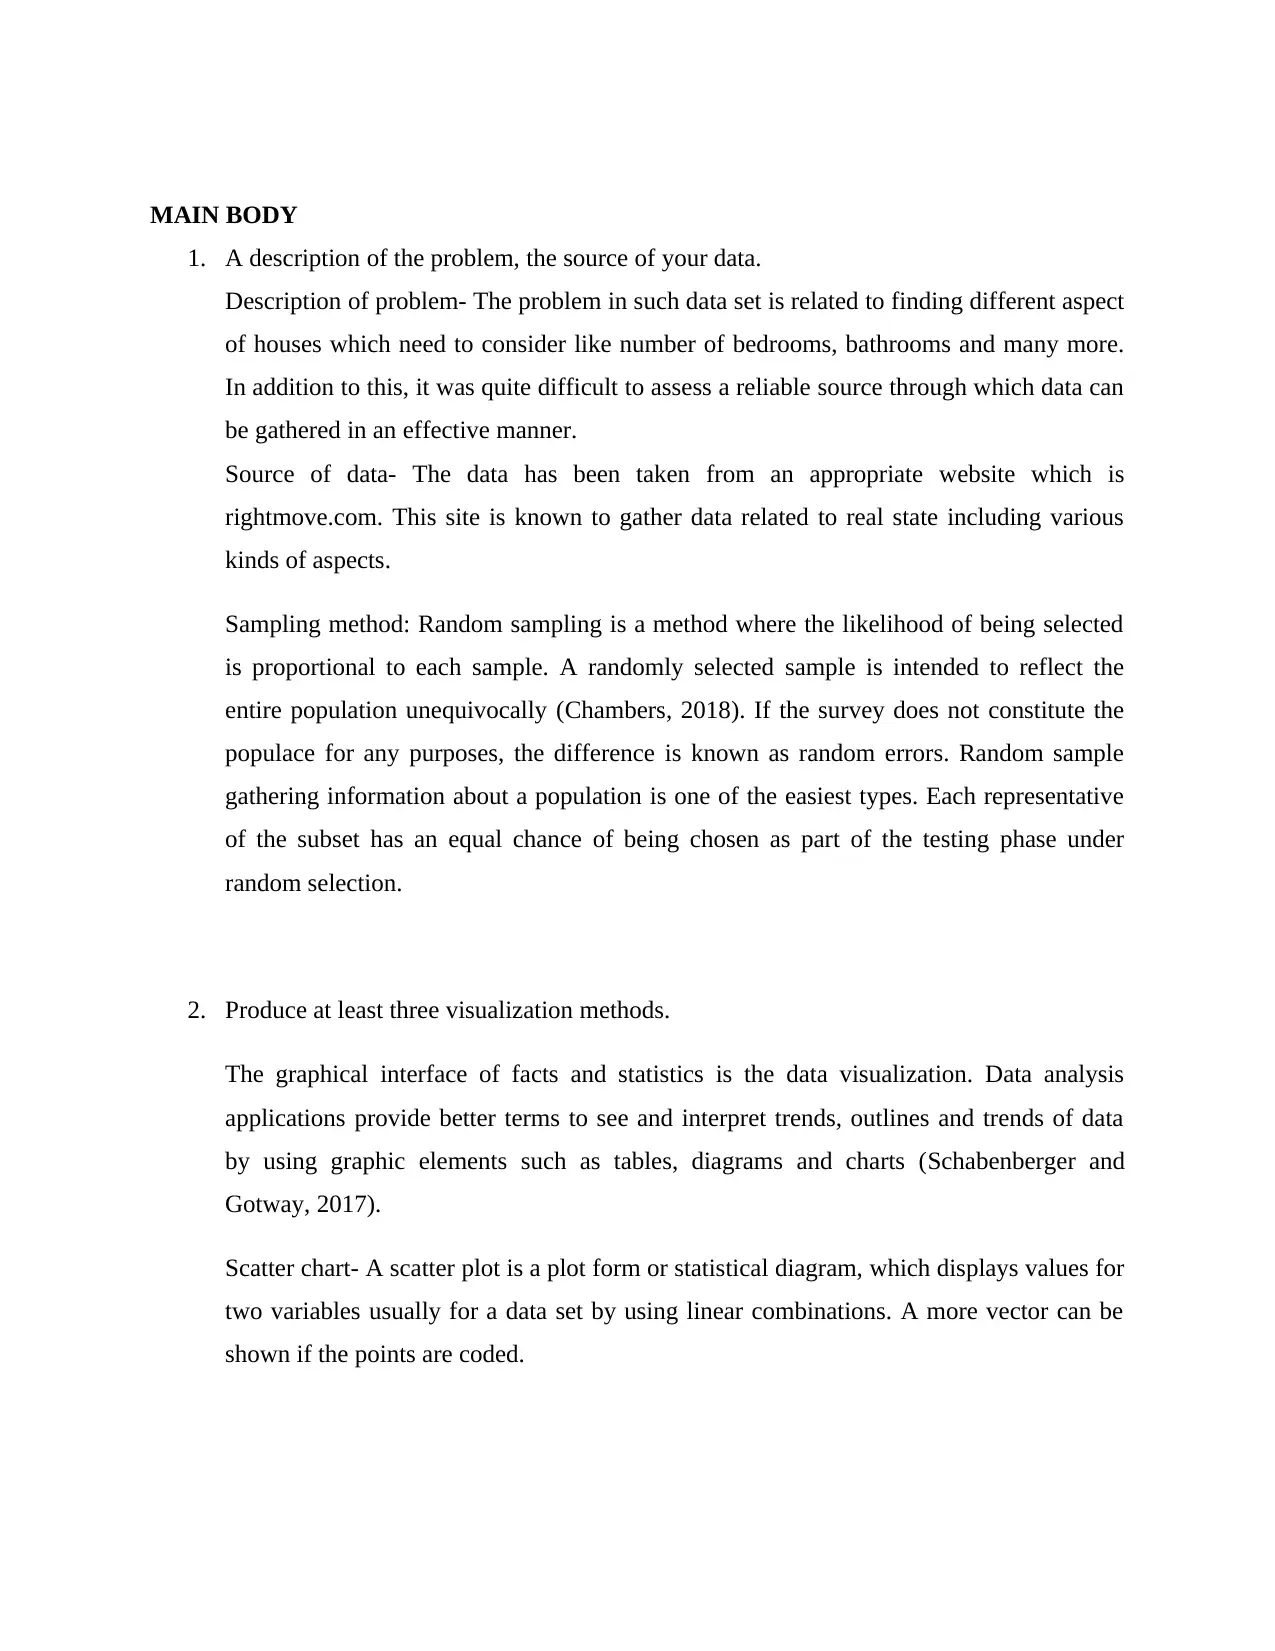
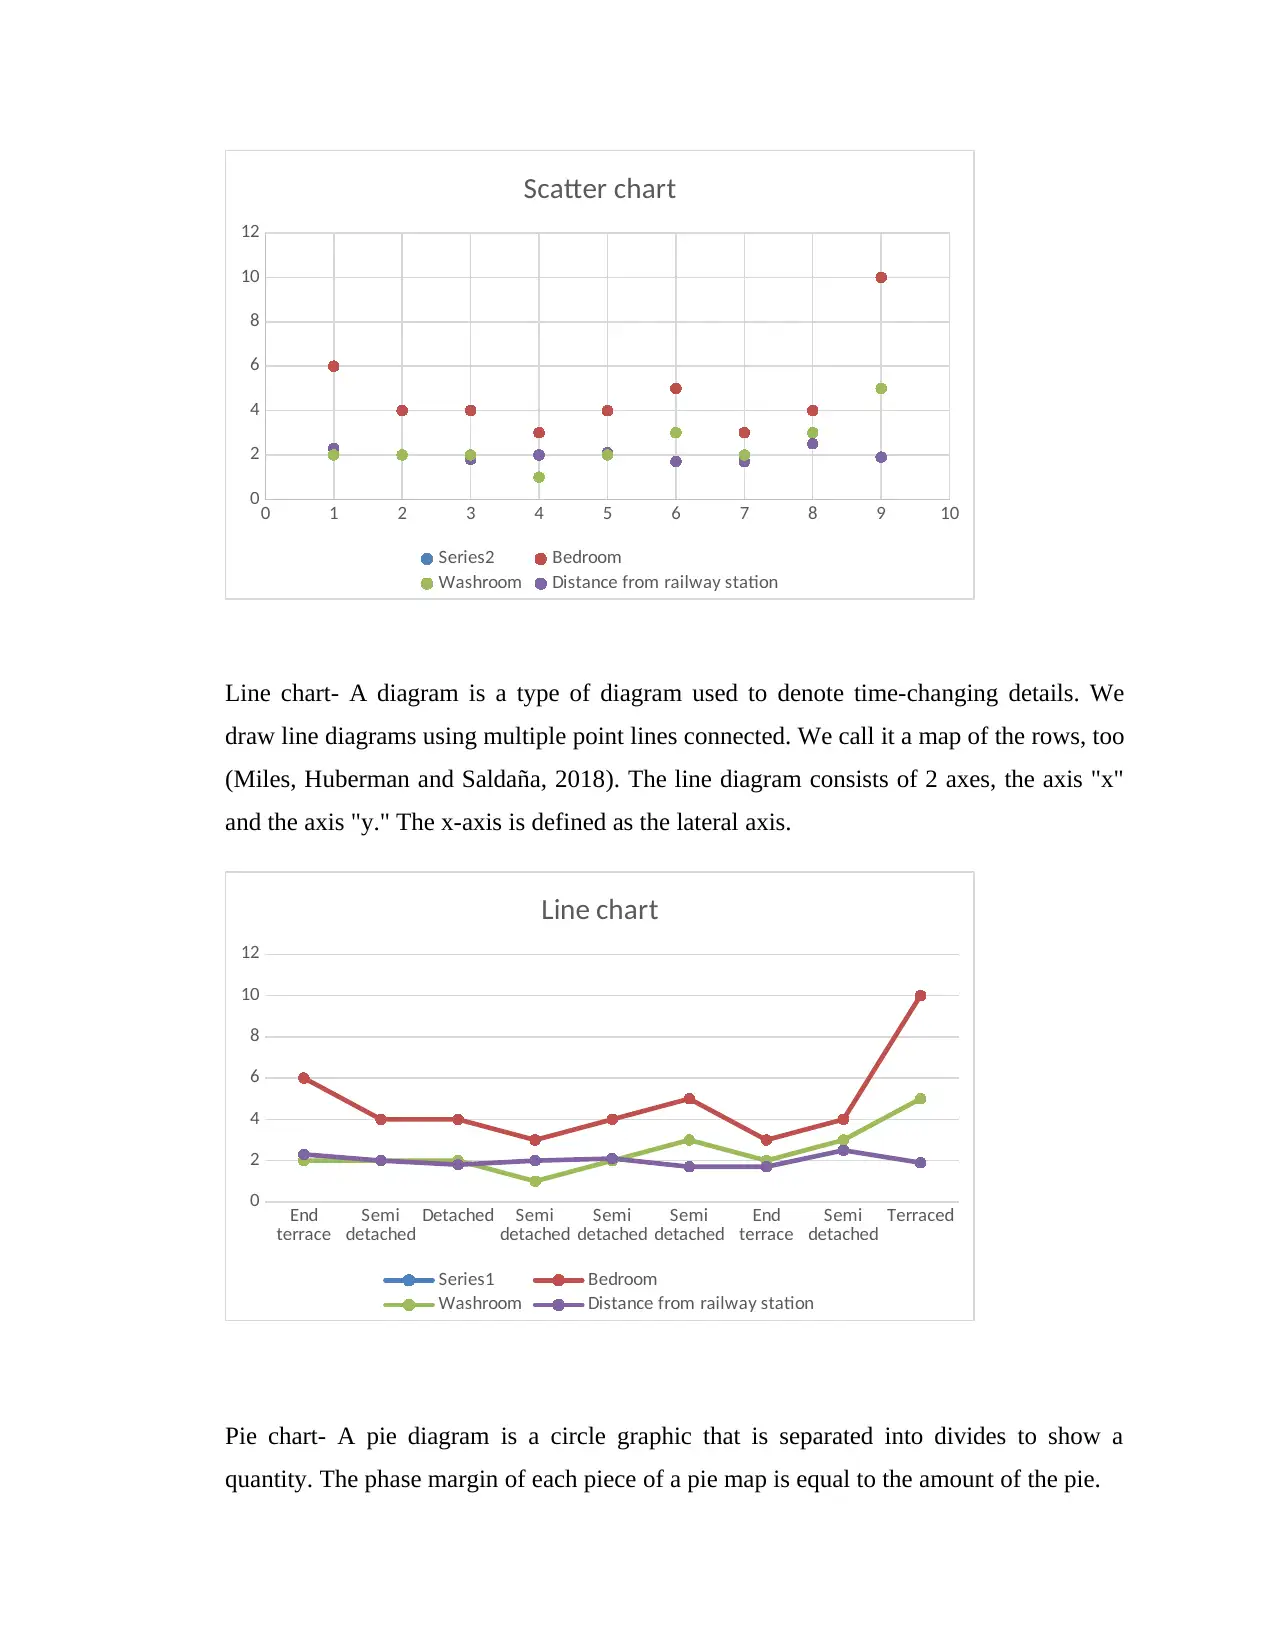
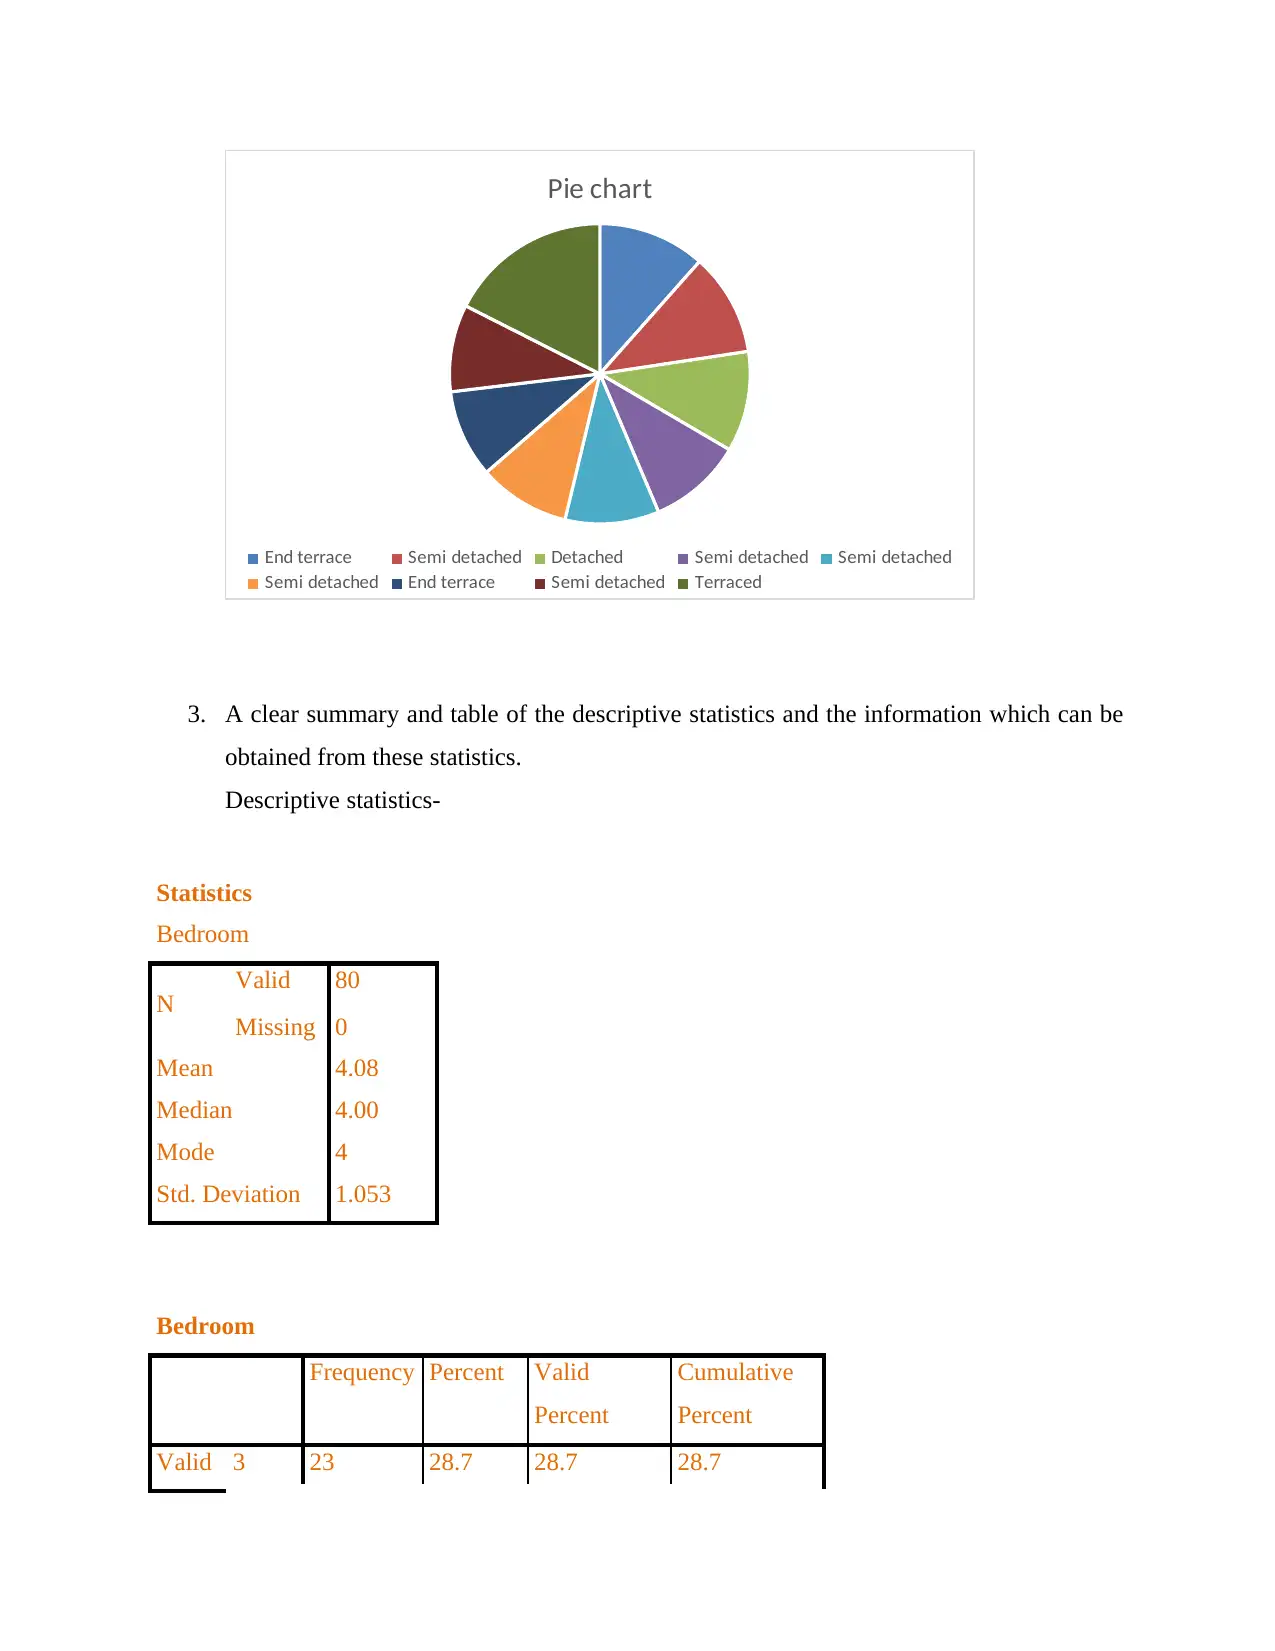
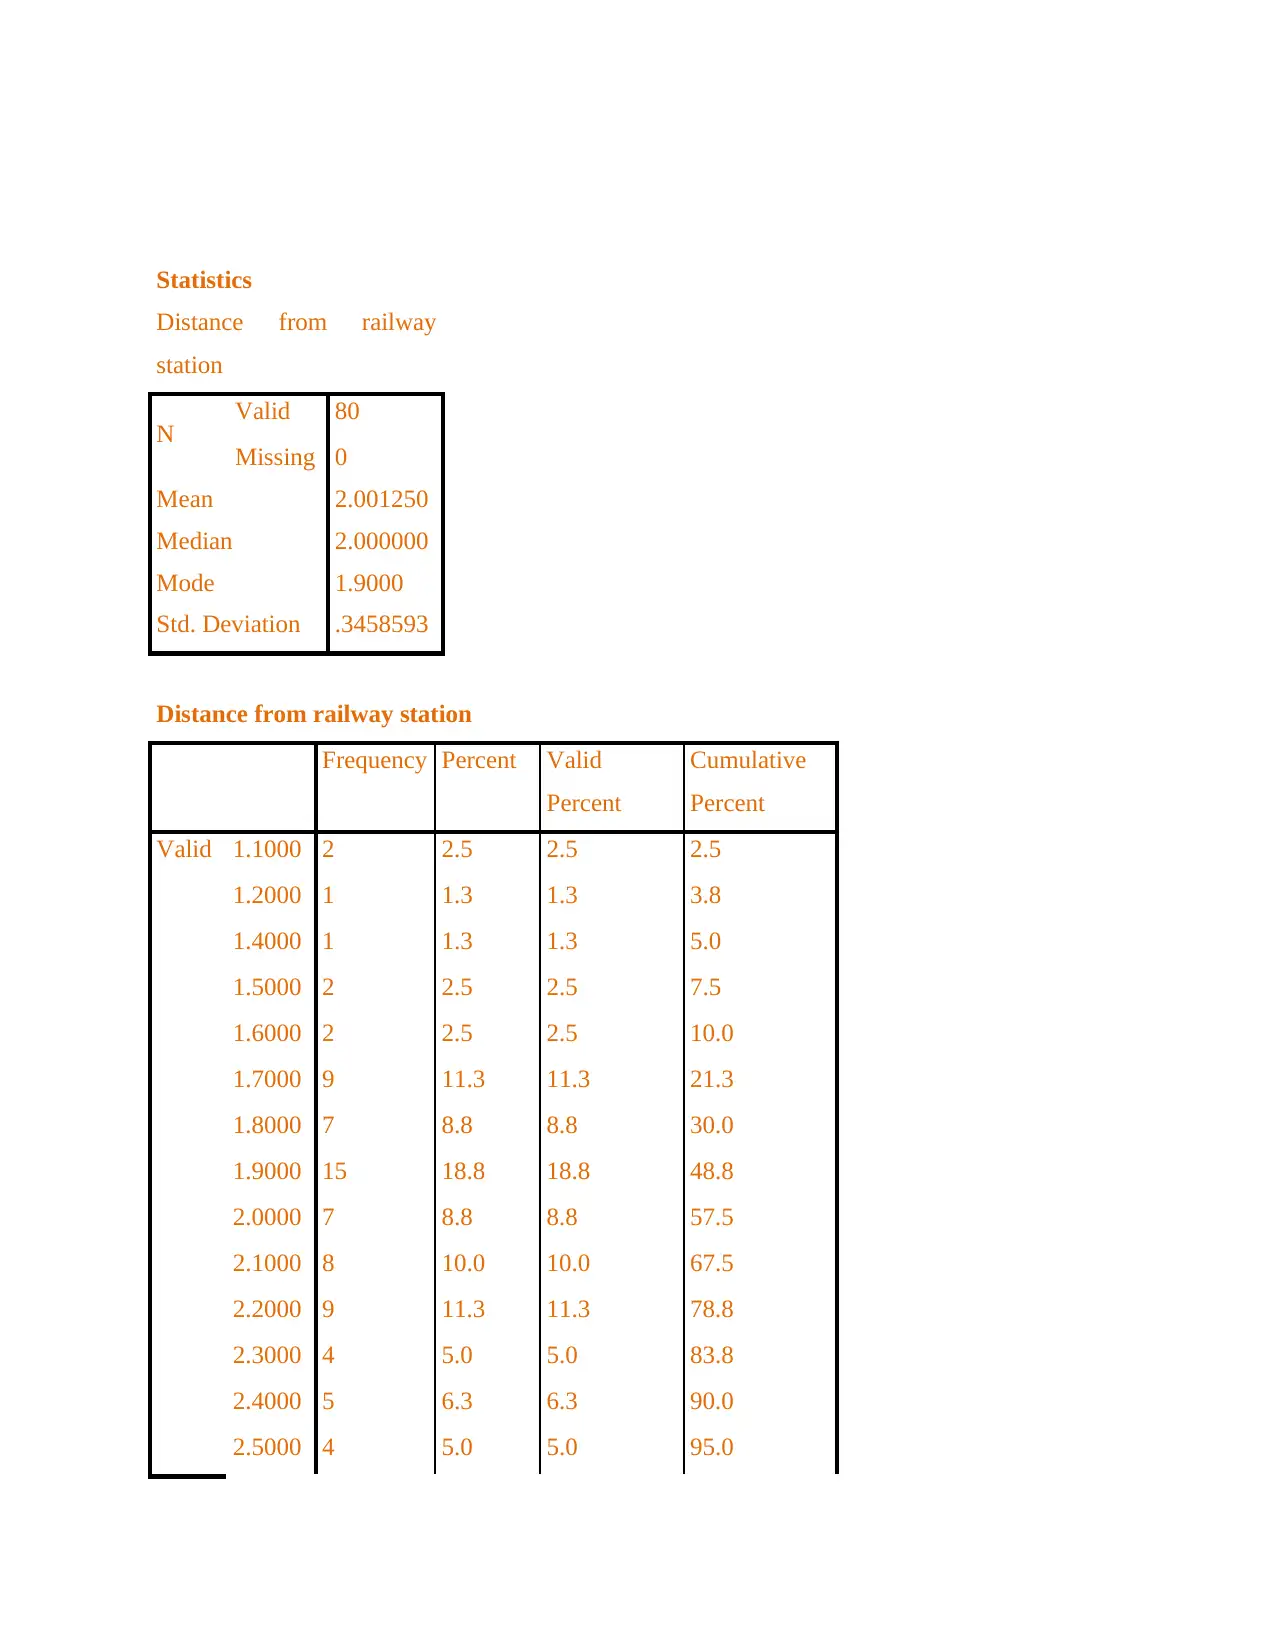
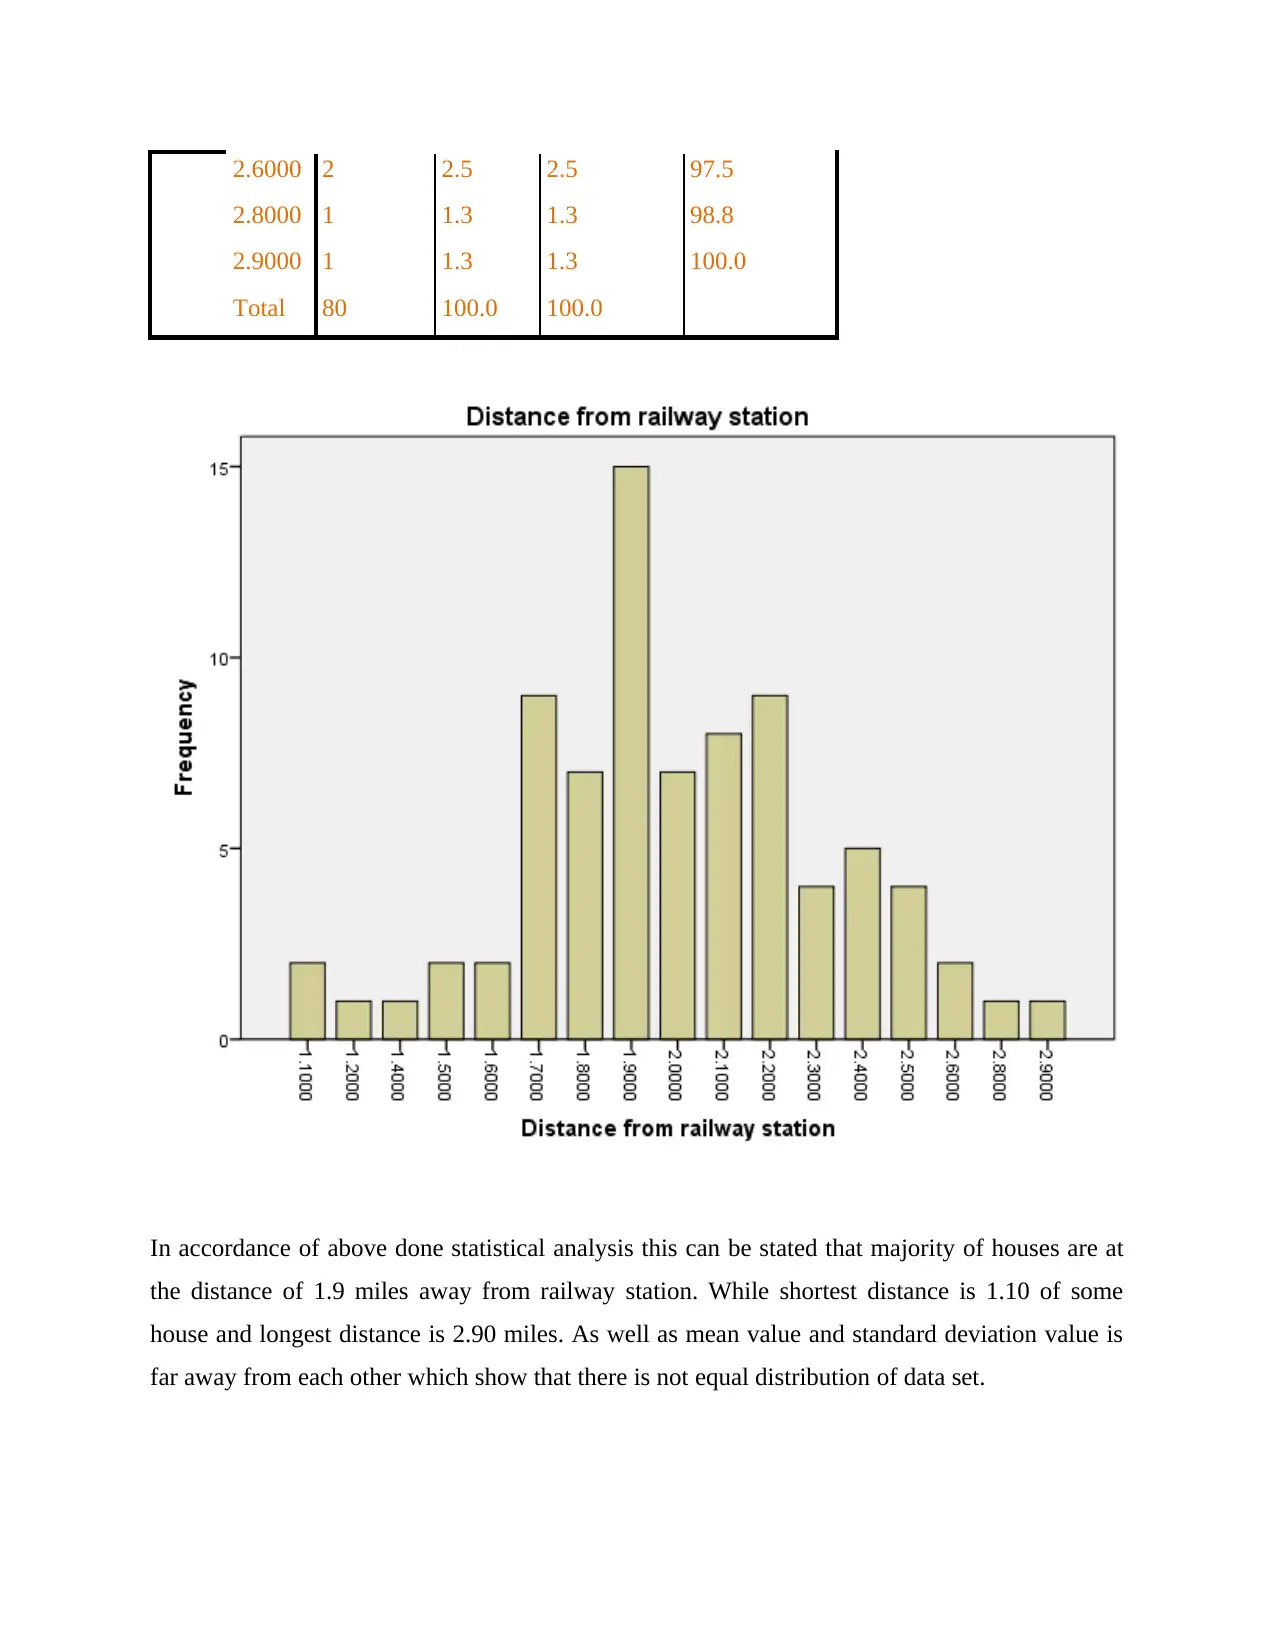
This report presents a comprehensive analysis of a real-world housing dataset focusing on the B17 postcode in the United Kingdom. The project begins with an overview of the data source and sampling method, followed by the creation of three visualization methods: scatter, line, and pie charts, to explore data trends. Descriptive statistics are then calculated and interpreted for key variables like number of bedrooms, bathrooms, price, and distance from the railway station. The report further investigates the relationship between house prices and house types through hypothesis testing and confidence intervals. Correlation and regression analyses are conducted to identify relationships between house prices and various house characteristics. The analysis includes a comparison of average house prices in the sample with UK averages and concludes with a discussion of the findings and their implications for understanding the local housing market.

Visualization and statistical analysis of a real world dataset
Paraphrase This Document
Need a fresh take? Get an instant paraphrase of this document with our AI Paraphraser

EXECUTIVE SUMMARY
In accordance of project report this can be summarized that data set has been taken of 80
different houses including various kinds of characteristics like price, type of house and many
more. The objective of project report is to do detailed analysis on housing market in post code
B17 United Kingdom. This analysis has been done by a research company which acts as an
estate agency. The report also abstracts about various kinds of visualization models, descriptive
statistical analysis etc.

Contents
EXECUTIVE SUMMARY.........................................................................................................................2
MAIN BODY..............................................................................................................................................4
REFERENCES..........................................................................................................................................20
⊘ This is a preview!⊘
Do you want full access?
Subscribe today to unlock all pages.

Trusted by 1+ million students worldwide

MAIN BODY
1. A description of the problem, the source of your data.
Description of problem- The problem in such data set is related to finding different aspect
of houses which need to consider like number of bedrooms, bathrooms and many more.
In addition to this, it was quite difficult to assess a reliable source through which data can
be gathered in an effective manner.
Source of data- The data has been taken from an appropriate website which is
rightmove.com. This site is known to gather data related to real state including various
kinds of aspects.
Sampling method: Random sampling is a method where the likelihood of being selected
is proportional to each sample. A randomly selected sample is intended to reflect the
entire population unequivocally (Chambers, 2018). If the survey does not constitute the
populace for any purposes, the difference is known as random errors. Random sample
gathering information about a population is one of the easiest types. Each representative
of the subset has an equal chance of being chosen as part of the testing phase under
random selection.
2. Produce at least three visualization methods.
The graphical interface of facts and statistics is the data visualization. Data analysis
applications provide better terms to see and interpret trends, outlines and trends of data
by using graphic elements such as tables, diagrams and charts (Schabenberger and
Gotway, 2017).
Scatter chart- A scatter plot is a plot form or statistical diagram, which displays values for
two variables usually for a data set by using linear combinations. A more vector can be
shown if the points are coded.
Paraphrase This Document
Need a fresh take? Get an instant paraphrase of this document with our AI Paraphraser

0 1 2 3 4 5 6 7 8 9 10
0
2
4
6
8
10
12
Scatter chart
Series2 Bedroom
Washroom Distance from railway station
Line chart- A diagram is a type of diagram used to denote time-changing details. We
draw line diagrams using multiple point lines connected. We call it a map of the rows, too
(Miles, Huberman and Saldaña, 2018). The line diagram consists of 2 axes, the axis "x"
and the axis "y." The x-axis is defined as the lateral axis.
End
terrace Semi
detached Detached Semi
detached Semi
detached Semi
detached End
terrace Semi
detached Terraced
0
2
4
6
8
10
12
Line chart
Series1 Bedroom
Washroom Distance from railway station
Pie chart- A pie diagram is a circle graphic that is separated into divides to show a
quantity. The phase margin of each piece of a pie map is equal to the amount of the pie.
0
2
4
6
8
10
12
Scatter chart
Series2 Bedroom
Washroom Distance from railway station
Line chart- A diagram is a type of diagram used to denote time-changing details. We
draw line diagrams using multiple point lines connected. We call it a map of the rows, too
(Miles, Huberman and Saldaña, 2018). The line diagram consists of 2 axes, the axis "x"
and the axis "y." The x-axis is defined as the lateral axis.
End
terrace Semi
detached Detached Semi
detached Semi
detached Semi
detached End
terrace Semi
detached Terraced
0
2
4
6
8
10
12
Line chart
Series1 Bedroom
Washroom Distance from railway station
Pie chart- A pie diagram is a circle graphic that is separated into divides to show a
quantity. The phase margin of each piece of a pie map is equal to the amount of the pie.

Pie chart
End terrace Semi detached Detached Semi detached Semi detached
Semi detached End terrace Semi detached Terraced
3. A clear summary and table of the descriptive statistics and the information which can be
obtained from these statistics.
Descriptive statistics-
Statistics
Bedroom
N Valid 80
Missing 0
Mean 4.08
Median 4.00
Mode 4
Std. Deviation 1.053
Bedroom
Frequency Percent Valid
Percent
Cumulative
Percent
Valid 3 23 28.7 28.7 28.7
⊘ This is a preview!⊘
Do you want full access?
Subscribe today to unlock all pages.

Trusted by 1+ million students worldwide

4 36 45.0 45.0 73.8
5 17 21.3 21.3 95.0
6 3 3.8 3.8 98.8
10 1 1.3 1.3 100.0
Total 80 100.0 100.0
Interpretation: In accordance of above done analysis this can be stated that among 80 houses,
number of average bedroom is 4. While there is less number of houses in which there are 10
rooms. In addition to this, mean value is 4.08 and standard deviation is of 1.05. It shows that data
is not equally distributed in line with mean value.
Paraphrase This Document
Need a fresh take? Get an instant paraphrase of this document with our AI Paraphraser

Statistics
Washroom
N Valid 80
Missing 0
Mean 2.00
Median 2.00
Mode 2
Std. Deviation .871
Washroom
Frequency Percent Valid
Percent
Cumulative
Percent
Valid
1 25 31.3 31.3 31.3
2 34 42.5 42.5 73.8
3 18 22.5 22.5 96.3
4 2 2.5 2.5 98.8
5 1 1.3 1.3 100.0
Total 80 100.0 100.0
Washroom
N Valid 80
Missing 0
Mean 2.00
Median 2.00
Mode 2
Std. Deviation .871
Washroom
Frequency Percent Valid
Percent
Cumulative
Percent
Valid
1 25 31.3 31.3 31.3
2 34 42.5 42.5 73.8
3 18 22.5 22.5 96.3
4 2 2.5 2.5 98.8
5 1 1.3 1.3 100.0
Total 80 100.0 100.0

Interpretation: In accordance of above done analysis this can be stated that among 80 houses,
number of average bathroom is 2. While there is less number of houses in which there are 5
bathrooms. In addition to this, mean value is 2 and standard deviation is of 0.871. It shows that
data is not equally distributed in line with mean value.
Statistics
Price
N Valid 80
Missing 0
Mean 573174.88
number of average bathroom is 2. While there is less number of houses in which there are 5
bathrooms. In addition to this, mean value is 2 and standard deviation is of 0.871. It shows that
data is not equally distributed in line with mean value.
Statistics
Price
N Valid 80
Missing 0
Mean 573174.88
⊘ This is a preview!⊘
Do you want full access?
Subscribe today to unlock all pages.

Trusted by 1+ million students worldwide

Median 575000.00
Mode 620000
Std. Deviation 132403.546
Interpretation-In accordance of above done statistical analysis this can be stated that majority of
houses are under 700000 pounds. While there is only one room whose price is of 1100000
pounds. As well as mean value and standard deviation value is far away from each other which
show that there is not equal distribution of data set.
Paraphrase This Document
Need a fresh take? Get an instant paraphrase of this document with our AI Paraphraser

Statistics
Distance from railway
station
N Valid 80
Missing 0
Mean 2.001250
Median 2.000000
Mode 1.9000
Std. Deviation .3458593
Distance from railway station
Frequency Percent Valid
Percent
Cumulative
Percent
Valid 1.1000 2 2.5 2.5 2.5
1.2000 1 1.3 1.3 3.8
1.4000 1 1.3 1.3 5.0
1.5000 2 2.5 2.5 7.5
1.6000 2 2.5 2.5 10.0
1.7000 9 11.3 11.3 21.3
1.8000 7 8.8 8.8 30.0
1.9000 15 18.8 18.8 48.8
2.0000 7 8.8 8.8 57.5
2.1000 8 10.0 10.0 67.5
2.2000 9 11.3 11.3 78.8
2.3000 4 5.0 5.0 83.8
2.4000 5 6.3 6.3 90.0
2.5000 4 5.0 5.0 95.0

2.6000 2 2.5 2.5 97.5
2.8000 1 1.3 1.3 98.8
2.9000 1 1.3 1.3 100.0
Total 80 100.0 100.0
In accordance of above done statistical analysis this can be stated that majority of houses are at
the distance of 1.9 miles away from railway station. While shortest distance is 1.10 of some
house and longest distance is 2.90 miles. As well as mean value and standard deviation value is
far away from each other which show that there is not equal distribution of data set.
⊘ This is a preview!⊘
Do you want full access?
Subscribe today to unlock all pages.

Trusted by 1+ million students worldwide
1 out of 23
Related Documents

Your All-in-One AI-Powered Toolkit for Academic Success.
 +13062052269
info@desklib.com
Available 24*7 on WhatsApp / Email
Unlock your academic potential
Copyright © 2020–2025 A2Z Services. All Rights Reserved. Developed and managed by ZUCOL.