B9AC106 - Financial Analysis: Unilever plc Performance Review
VerifiedAdded on 2023/06/15
|29
|5833
|304
Report
AI Summary
This report provides a comprehensive financial analysis of Unilever plc, evaluating its financial performance and position through ratio analysis over the past five years. Profitability ratios, including return on shareholder's fund, operating profit margin, and gross profit margin, are assessed and compared with competitors like P&G and PepsiCo. Liquidity ratios, such as current and acid-test ratios, are examined to determine the company's short-term debt obligation capacity. Efficiency ratios, including receivable collection period, payable payment days, and inventory days, are calculated to assess working capital management. The report also covers gearing and investment ratios, including earnings per share and price-earnings ratio, and offers recommendations for enhancing the company’s performance, considering competitor stakes and investment opportunities. The analysis uses financial data from Unilever plc's annual reports and stock prices to provide a thorough evaluation of the company's financial health.
Running Head: Finance
1
Project Report: Finance
1
Project Report: Finance
Paraphrase This Document
Need a fresh take? Get an instant paraphrase of this document with our AI Paraphraser
Finance
2
Contents
Introduction.......................................................................................................................4
Company overview...........................................................................................................4
Financial performance and financial position...................................................................4
Profitability ratio...........................................................................................................5
Return on shareholder’s fund....................................................................................5
Operating profit margin............................................................................................6
Gross profit margin...................................................................................................7
Liquidity ratio...............................................................................................................8
(Morningstar, 2018)..................................................................................................8
Current ratio..............................................................................................................8
Acid Test ratio..........................................................................................................9
Efficiency ratio...........................................................................................................11
Receivable collection period...................................................................................11
Payable payment days.............................................................................................12
Inventory days........................................................................................................13
Gearing ratio...............................................................................................................14
Investment ratio..........................................................................................................15
Earnings per share...................................................................................................16
Price earnings ratio.................................................................................................16
Initiative to enhance company’s performance................................................................17
Competitor’s stake in the company................................................................................18
Recommendation............................................................................................................19
References.......................................................................................................................21
Appendix.........................................................................................................................23
Finance
3
Figure 1: return on shareholders’ Fund............................................................................6
Figure 2: Operating profit margin.....................................................................................7
Figure 3: Gross Profit margin...........................................................................................8
Figure 4: Current ratio......................................................................................................9
Figure 5: Acid Test Ratio...............................................................................................10
Figure 6: Receivable collection period...........................................................................12
Figure 7: Payable collection period................................................................................13
Figure 8: Inventory days.................................................................................................14
Figure 9: Gearing ratio....................................................................................................15
Figure 10: Earnings per share.........................................................................................16
⊘ This is a preview!⊘
Do you want full access?
Subscribe today to unlock all pages.
Trusted by 1+ million students worldwide
Finance
4
Introduction:
This report paper has been prepared to evaluate the financial position, financial
performance, competitor position and the investment opportunity of Unilever plc. Financial
evaluation over an organization is significant as it assists the company to make better
decision about the position and the performance of the company. This report explains that it
becomes easier for the company and the stakeholders of the company to evaluate the position
of the organization and make better conclusion about the position, investment opportunity
and performance of the company. Further, it explains that the financial performance of the
company could be analyzed on the basis of annual report, financial statements of the
company, stock price of the company, competitor position of the company and the worth of
the company.
For this report, financial data of Unilever plc of last 5 years have been analyzed and
the ratio study has been conducted. Further, the competitors financial performance has been
compare with the financial performance of Uniliver plc and lastly, the stock performance and
the investment opportunity of the company has been evaluated.
Company overview:
Unilever plc is one of the fastest growing organizations in consumer goods market.
This company operates its business through foods, home care, personal care refreshment
segment etc. The company has diversified its market among 112 countries and the market
share of the company is huge. Personal segment of the company provides hair care and
skincare products, oral care products and deodorants. Food segment provides sauces, soup,
mayonnaise, margarines, salad dressings, spreads etc. the company has been founded in 1885.
Headquarter of the company is in London, UK (Home, 2018). The financial performance and
the position expresses about various positive and impressive changes into the organization.
Financial performance and financial position:
Financial performance and financial position of an organization could be evaluated
and measured through the financial statement and the market worth of the company.
Basically, it is a process in which the results of an organization are measured through
identifying the policies and the activities of the company in monetary terms (Davies and
Paraphrase This Document
Need a fresh take? Get an instant paraphrase of this document with our AI Paraphraser
Finance
5
Crawford, 2011). The study of financial performance and position of the Unilever plc is as
follows:
Profitability ratio:
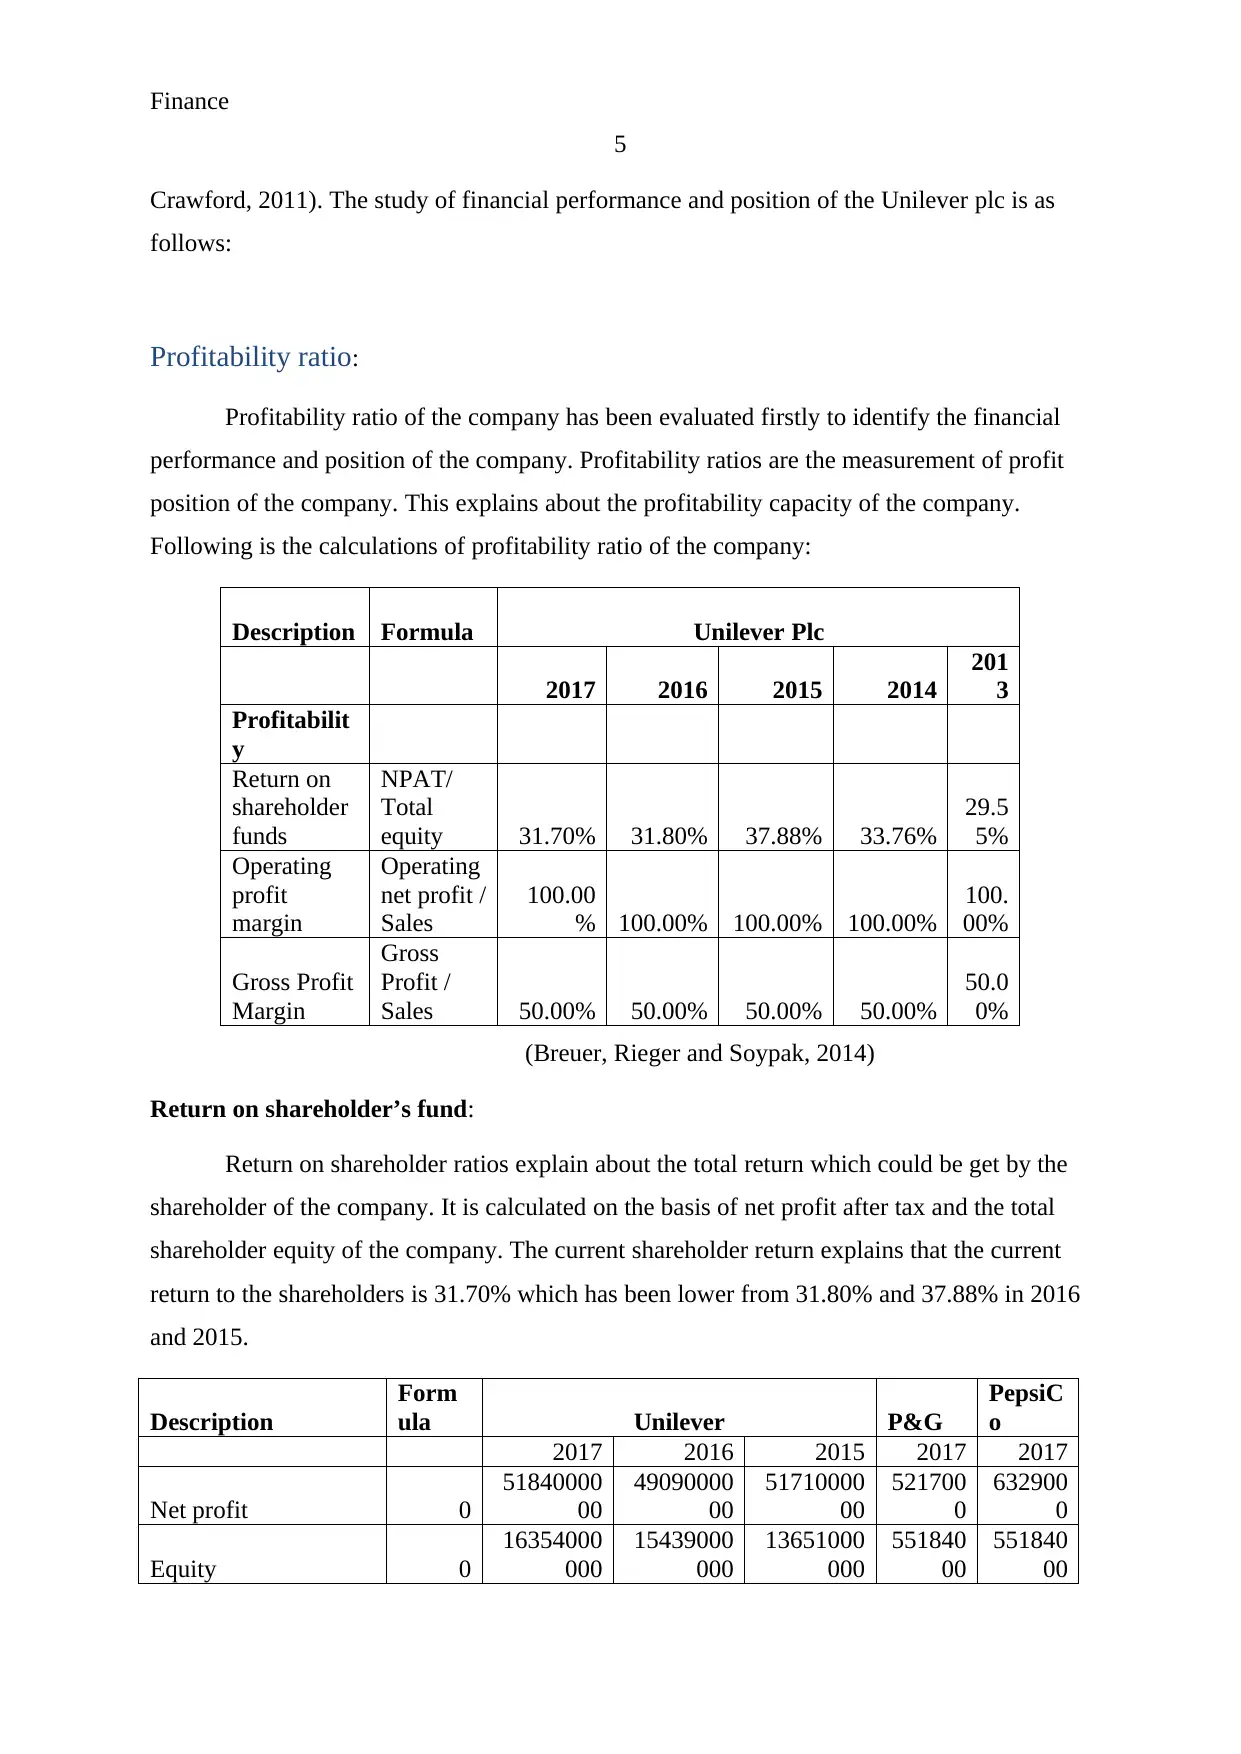
Profitability ratio of the company has been evaluated firstly to identify the financial
performance and position of the company. Profitability ratios are the measurement of profit
position of the company. This explains about the profitability capacity of the company.
Following is the calculations of profitability ratio of the company:
Description Formula Unilever Plc
2017 2016 2015 2014
201
3
Profitabilit
y
Return on
shareholder
funds
NPAT/
Total
equity 31.70% 31.80% 37.88% 33.76%
29.5
5%
Operating
profit
margin
Operating
net profit /
Sales
100.00
% 100.00% 100.00% 100.00%
100.
00%
Gross Profit
Margin
Gross
Profit /
Sales 50.00% 50.00% 50.00% 50.00%
50.0
0%
(Breuer, Rieger and Soypak, 2014)
Return on shareholder’s fund:
Return on shareholder ratios explain about the total return which could be get by the
shareholder of the company. It is calculated on the basis of net profit after tax and the total
shareholder equity of the company. The current shareholder return explains that the current
return to the shareholders is 31.70% which has been lower from 31.80% and 37.88% in 2016
and 2015.
Description
Form
ula Unilever P&G
PepsiC
o
2017 2016 2015 2017 2017
Net profit 0
51840000
00
49090000
00
51710000
00
521700
0
632900
0
Equity 0
16354000
000
15439000
000
13651000
000
551840
00
551840
00
5
Crawford, 2011). The study of financial performance and position of the Unilever plc is as
follows:
Profitability ratio:
Profitability ratio of the company has been evaluated firstly to identify the financial
performance and position of the company. Profitability ratios are the measurement of profit
position of the company. This explains about the profitability capacity of the company.
Following is the calculations of profitability ratio of the company:
Description Formula Unilever Plc
2017 2016 2015 2014
201
3
Profitabilit
y
Return on
shareholder
funds
NPAT/
Total
equity 31.70% 31.80% 37.88% 33.76%
29.5
5%
Operating
profit
margin
Operating
net profit /
Sales
100.00
% 100.00% 100.00% 100.00%
100.
00%
Gross Profit
Margin
Gross
Profit /
Sales 50.00% 50.00% 50.00% 50.00%
50.0
0%
(Breuer, Rieger and Soypak, 2014)
Return on shareholder’s fund:
Return on shareholder ratios explain about the total return which could be get by the
shareholder of the company. It is calculated on the basis of net profit after tax and the total
shareholder equity of the company. The current shareholder return explains that the current
return to the shareholders is 31.70% which has been lower from 31.80% and 37.88% in 2016
and 2015.
Description
Form
ula Unilever P&G
PepsiC
o
2017 2016 2015 2017 2017
Net profit 0
51840000
00
49090000
00
51710000
00
521700
0
632900
0
Equity 0
16354000
000
15439000
000
13651000
000
551840
00
551840
00
Finance
6
Return on shareholder
funds
NPAT/
Total
equity 31.70% 31.80% 37.88% 9.45% 11.47%
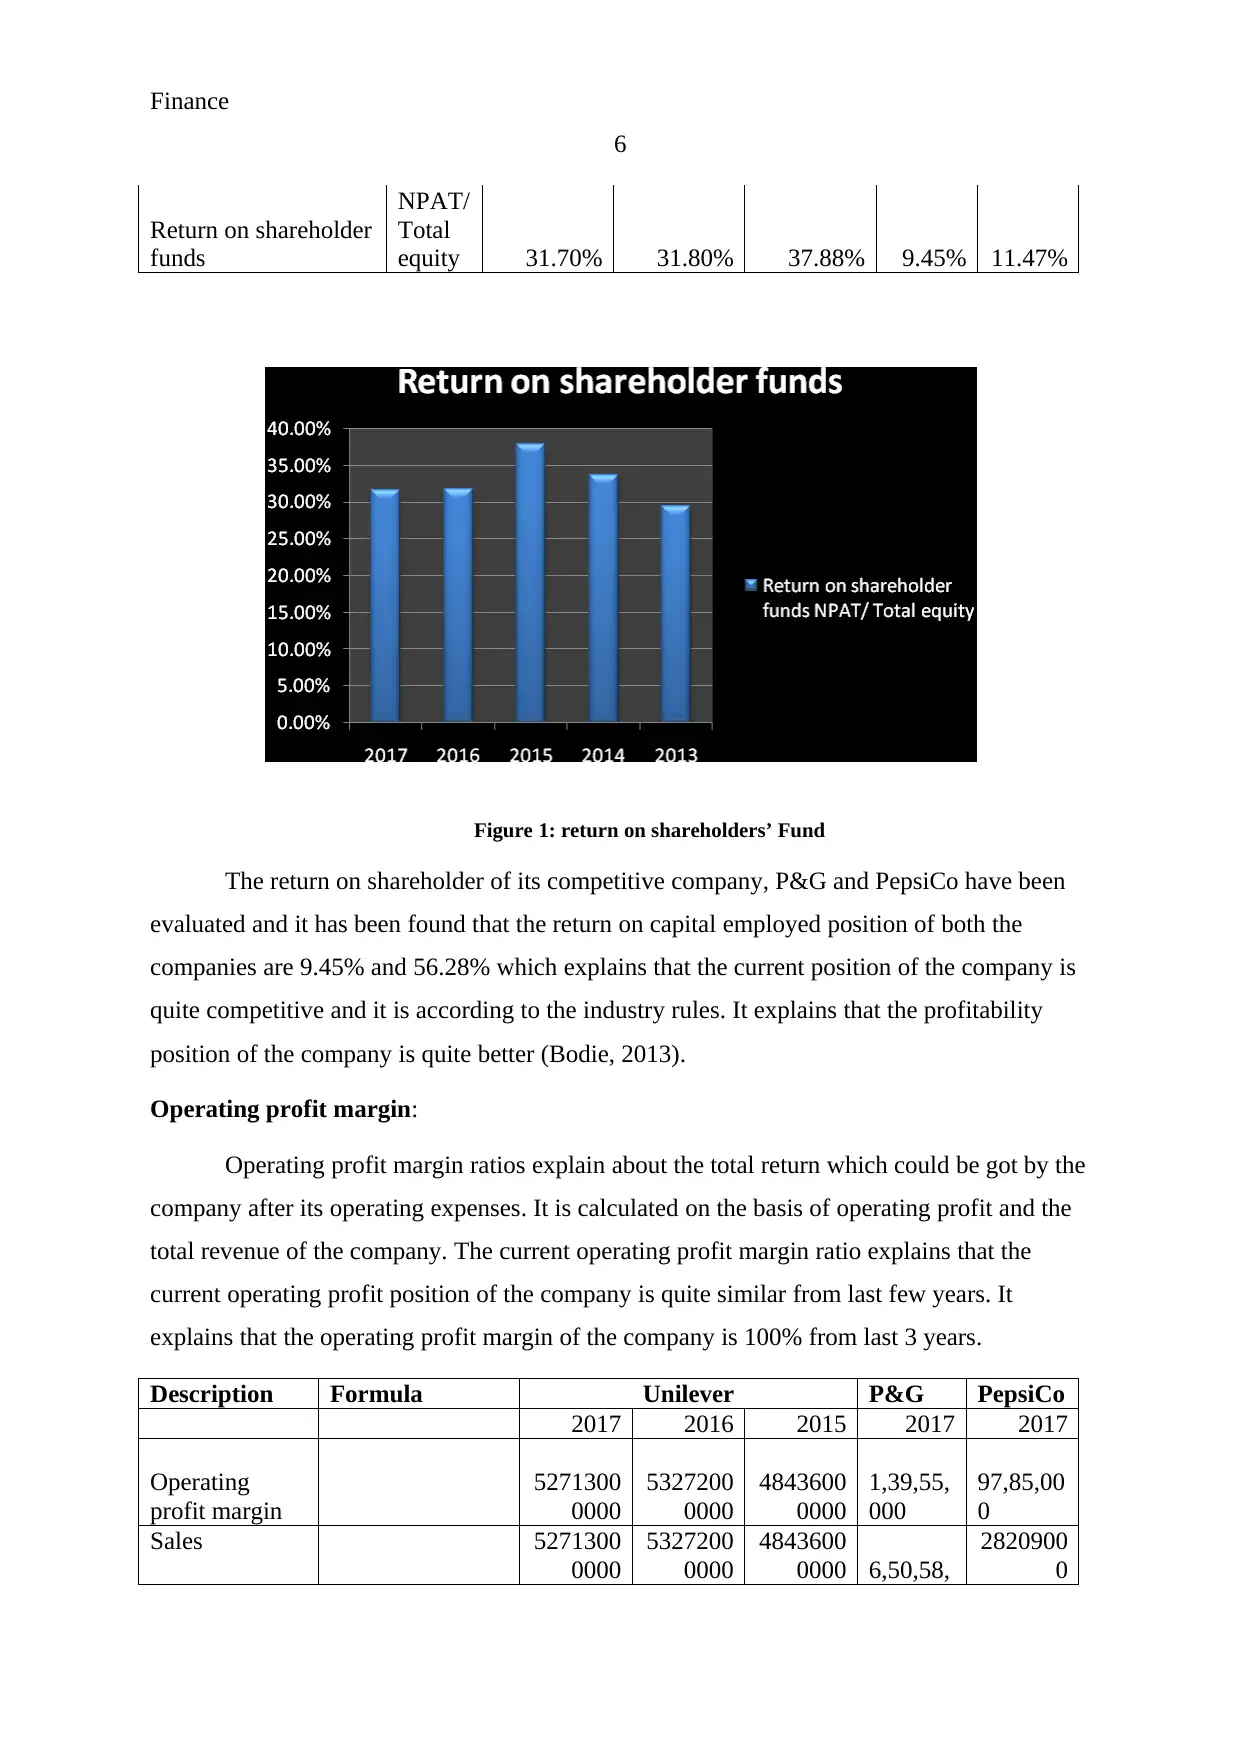
Figure 1: return on shareholders’ Fund
The return on shareholder of its competitive company, P&G and PepsiCo have been
evaluated and it has been found that the return on capital employed position of both the
companies are 9.45% and 56.28% which explains that the current position of the company is
quite competitive and it is according to the industry rules. It explains that the profitability
position of the company is quite better (Bodie, 2013).
Operating profit margin:
Operating profit margin ratios explain about the total return which could be got by the
company after its operating expenses. It is calculated on the basis of operating profit and the
total revenue of the company. The current operating profit margin ratio explains that the
current operating profit position of the company is quite similar from last few years. It
explains that the operating profit margin of the company is 100% from last 3 years.
Description Formula Unilever P&G PepsiCo
2017 2016 2015 2017 2017
Operating
profit margin
5271300
0000
5327200
0000
4843600
0000
1,39,55,
000
97,85,00
0
Sales 5271300
0000
5327200
0000
4843600
0000 6,50,58,
2820900
0
6
Return on shareholder
funds
NPAT/
Total
equity 31.70% 31.80% 37.88% 9.45% 11.47%
Figure 1: return on shareholders’ Fund
The return on shareholder of its competitive company, P&G and PepsiCo have been
evaluated and it has been found that the return on capital employed position of both the
companies are 9.45% and 56.28% which explains that the current position of the company is
quite competitive and it is according to the industry rules. It explains that the profitability
position of the company is quite better (Bodie, 2013).
Operating profit margin:
Operating profit margin ratios explain about the total return which could be got by the
company after its operating expenses. It is calculated on the basis of operating profit and the
total revenue of the company. The current operating profit margin ratio explains that the
current operating profit position of the company is quite similar from last few years. It
explains that the operating profit margin of the company is 100% from last 3 years.
Description Formula Unilever P&G PepsiCo
2017 2016 2015 2017 2017
Operating
profit margin
5271300
0000
5327200
0000
4843600
0000
1,39,55,
000
97,85,00
0
Sales 5271300
0000
5327200
0000
4843600
0000 6,50,58,
2820900
0
⊘ This is a preview!⊘
Do you want full access?
Subscribe today to unlock all pages.
Trusted by 1+ million students worldwide
Finance
7
000
Operating
profit margin
Operating net
profit / Sales 100.00% 100.00% 100.00% 21.45% 34.69%
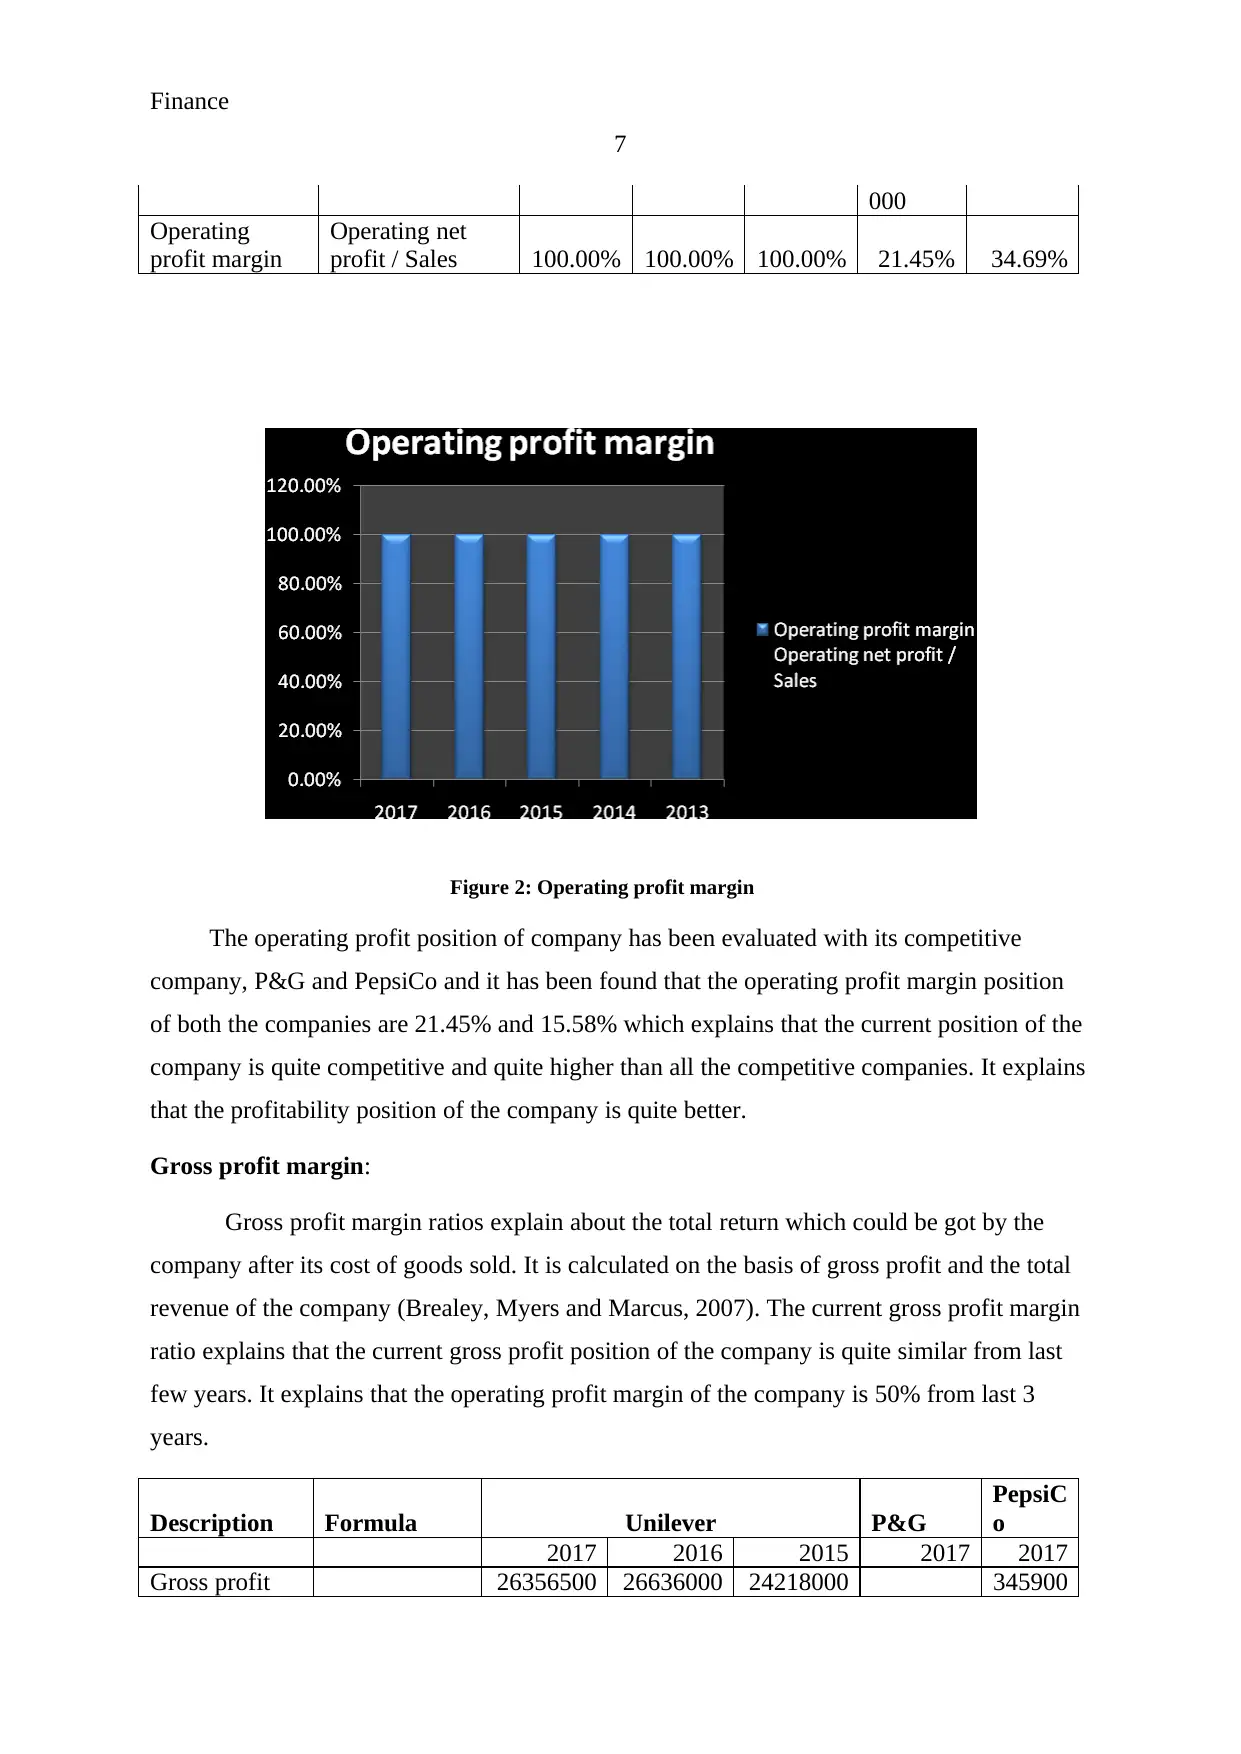
Figure 2: Operating profit margin
The operating profit position of company has been evaluated with its competitive
company, P&G and PepsiCo and it has been found that the operating profit margin position
of both the companies are 21.45% and 15.58% which explains that the current position of the
company is quite competitive and quite higher than all the competitive companies. It explains
that the profitability position of the company is quite better.
Gross profit margin:
Gross profit margin ratios explain about the total return which could be got by the
company after its cost of goods sold. It is calculated on the basis of gross profit and the total
revenue of the company (Brealey, Myers and Marcus, 2007). The current gross profit margin
ratio explains that the current gross profit position of the company is quite similar from last
few years. It explains that the operating profit margin of the company is 50% from last 3
years.
Description Formula Unilever P&G
PepsiC
o
2017 2016 2015 2017 2017
Gross profit 26356500 26636000 24218000 345900
7
000
Operating
profit margin
Operating net
profit / Sales 100.00% 100.00% 100.00% 21.45% 34.69%
Figure 2: Operating profit margin
The operating profit position of company has been evaluated with its competitive
company, P&G and PepsiCo and it has been found that the operating profit margin position
of both the companies are 21.45% and 15.58% which explains that the current position of the
company is quite competitive and quite higher than all the competitive companies. It explains
that the profitability position of the company is quite better.
Gross profit margin:
Gross profit margin ratios explain about the total return which could be got by the
company after its cost of goods sold. It is calculated on the basis of gross profit and the total
revenue of the company (Brealey, Myers and Marcus, 2007). The current gross profit margin
ratio explains that the current gross profit position of the company is quite similar from last
few years. It explains that the operating profit margin of the company is 50% from last 3
years.
Description Formula Unilever P&G
PepsiC
o
2017 2016 2015 2017 2017
Gross profit 26356500 26636000 24218000 345900
Paraphrase This Document
Need a fresh take? Get an instant paraphrase of this document with our AI Paraphraser
Finance
8
000 000 000
3,25,23,0
00 00
Sales
52713000
000
53272000
000
48436000
000
6505800
0
282090
00
Gross Profit
Margin
Gross Profit /
Sales 50.00% 50.00% 50.00% 49.99%
122.62
%
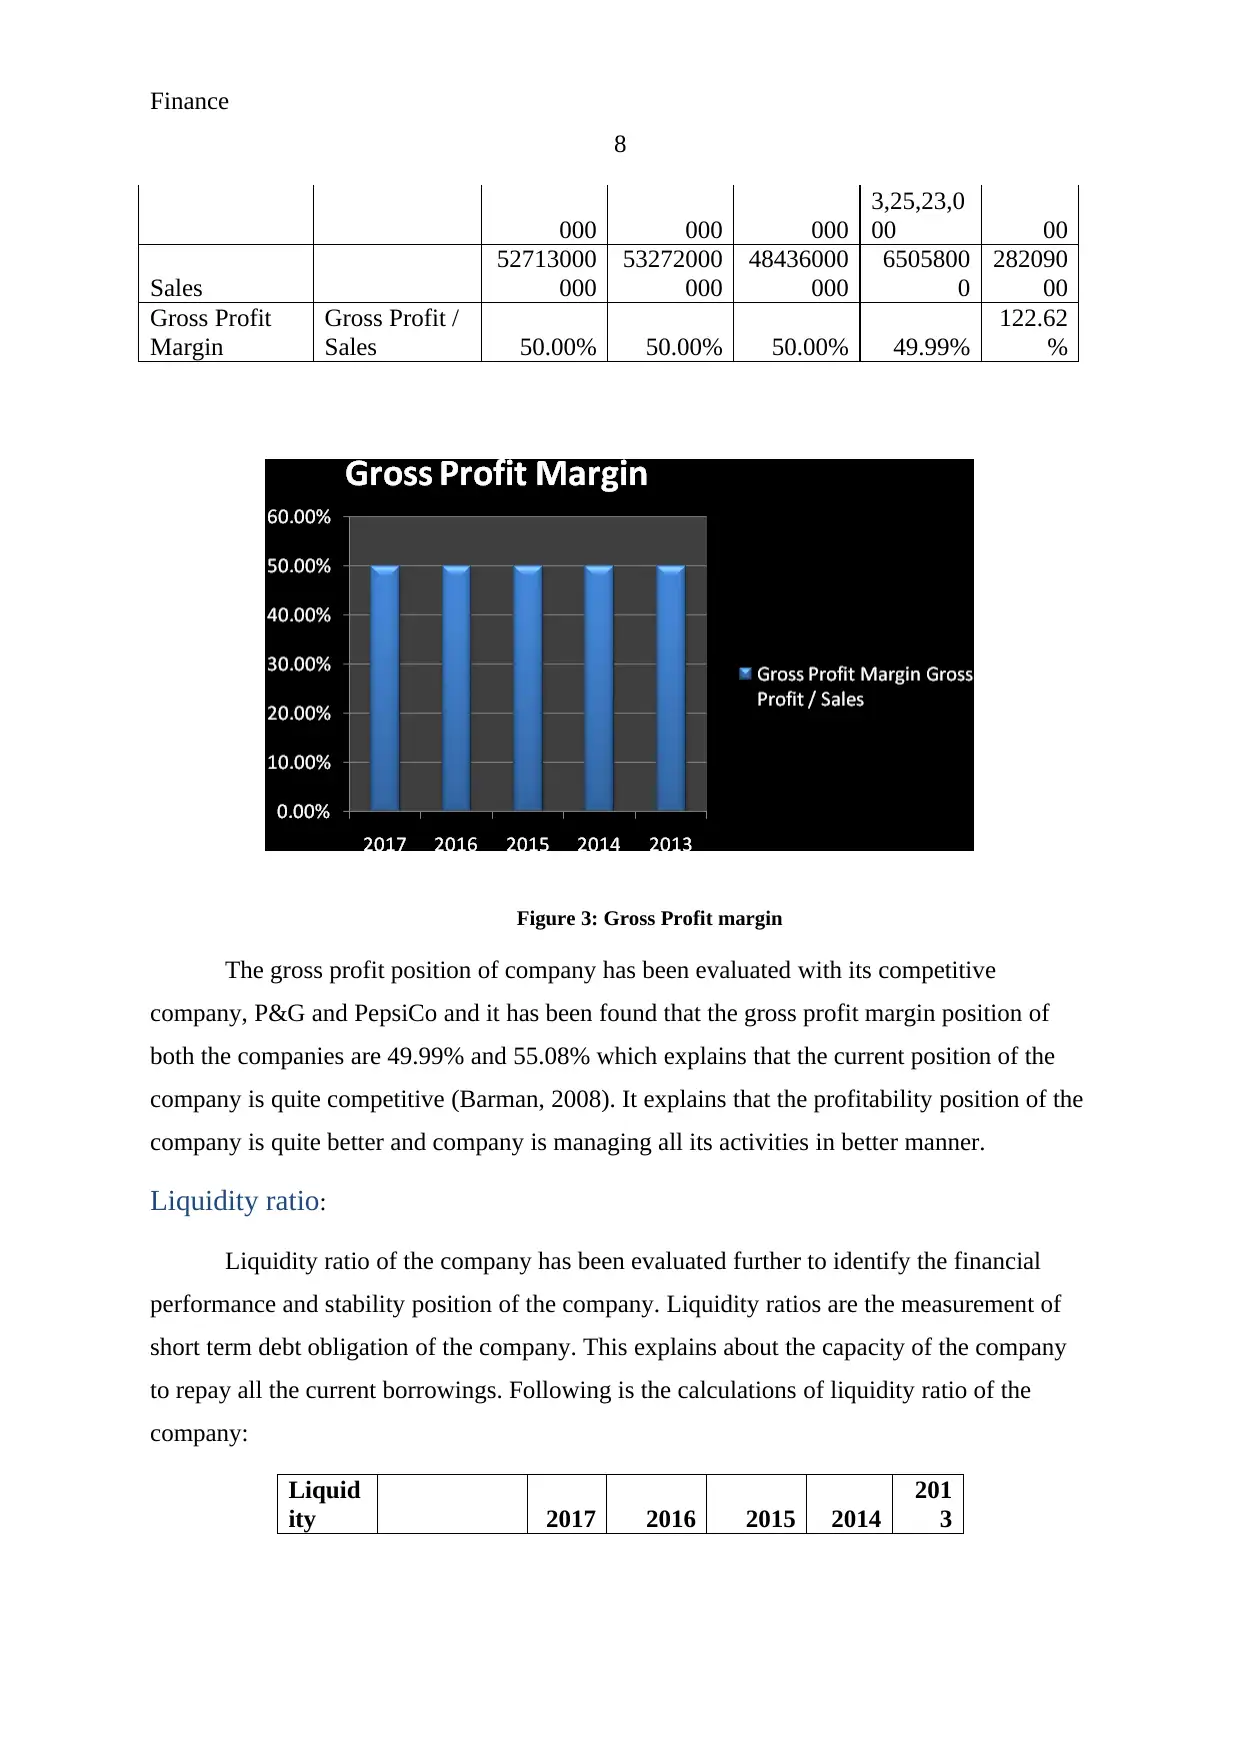
Figure 3: Gross Profit margin
The gross profit position of company has been evaluated with its competitive
company, P&G and PepsiCo and it has been found that the gross profit margin position of
both the companies are 49.99% and 55.08% which explains that the current position of the
company is quite competitive (Barman, 2008). It explains that the profitability position of the
company is quite better and company is managing all its activities in better manner.
Liquidity ratio:
Liquidity ratio of the company has been evaluated further to identify the financial
performance and stability position of the company. Liquidity ratios are the measurement of
short term debt obligation of the company. This explains about the capacity of the company
to repay all the current borrowings. Following is the calculations of liquidity ratio of the
company:
Liquid
ity 2017 2016 2015 2014
201
3
8
000 000 000
3,25,23,0
00 00
Sales
52713000
000
53272000
000
48436000
000
6505800
0
282090
00
Gross Profit
Margin
Gross Profit /
Sales 50.00% 50.00% 50.00% 49.99%
122.62
%
Figure 3: Gross Profit margin
The gross profit position of company has been evaluated with its competitive
company, P&G and PepsiCo and it has been found that the gross profit margin position of
both the companies are 49.99% and 55.08% which explains that the current position of the
company is quite competitive (Barman, 2008). It explains that the profitability position of the
company is quite better and company is managing all its activities in better manner.
Liquidity ratio:
Liquidity ratio of the company has been evaluated further to identify the financial
performance and stability position of the company. Liquidity ratios are the measurement of
short term debt obligation of the company. This explains about the capacity of the company
to repay all the current borrowings. Following is the calculations of liquidity ratio of the
company:
Liquid
ity 2017 2016 2015 2014
201
3
Finance
9
Current
ratio
Current
assets/curre
nt liabilities 0.68 0.63 0.63 0.70 0.77
Acid
test
ratios
Current
assets-
Inventory/cu
rrent
liabilities 0.47 0.63 0.63 0.47 0.49
(Morningstar, 2018)
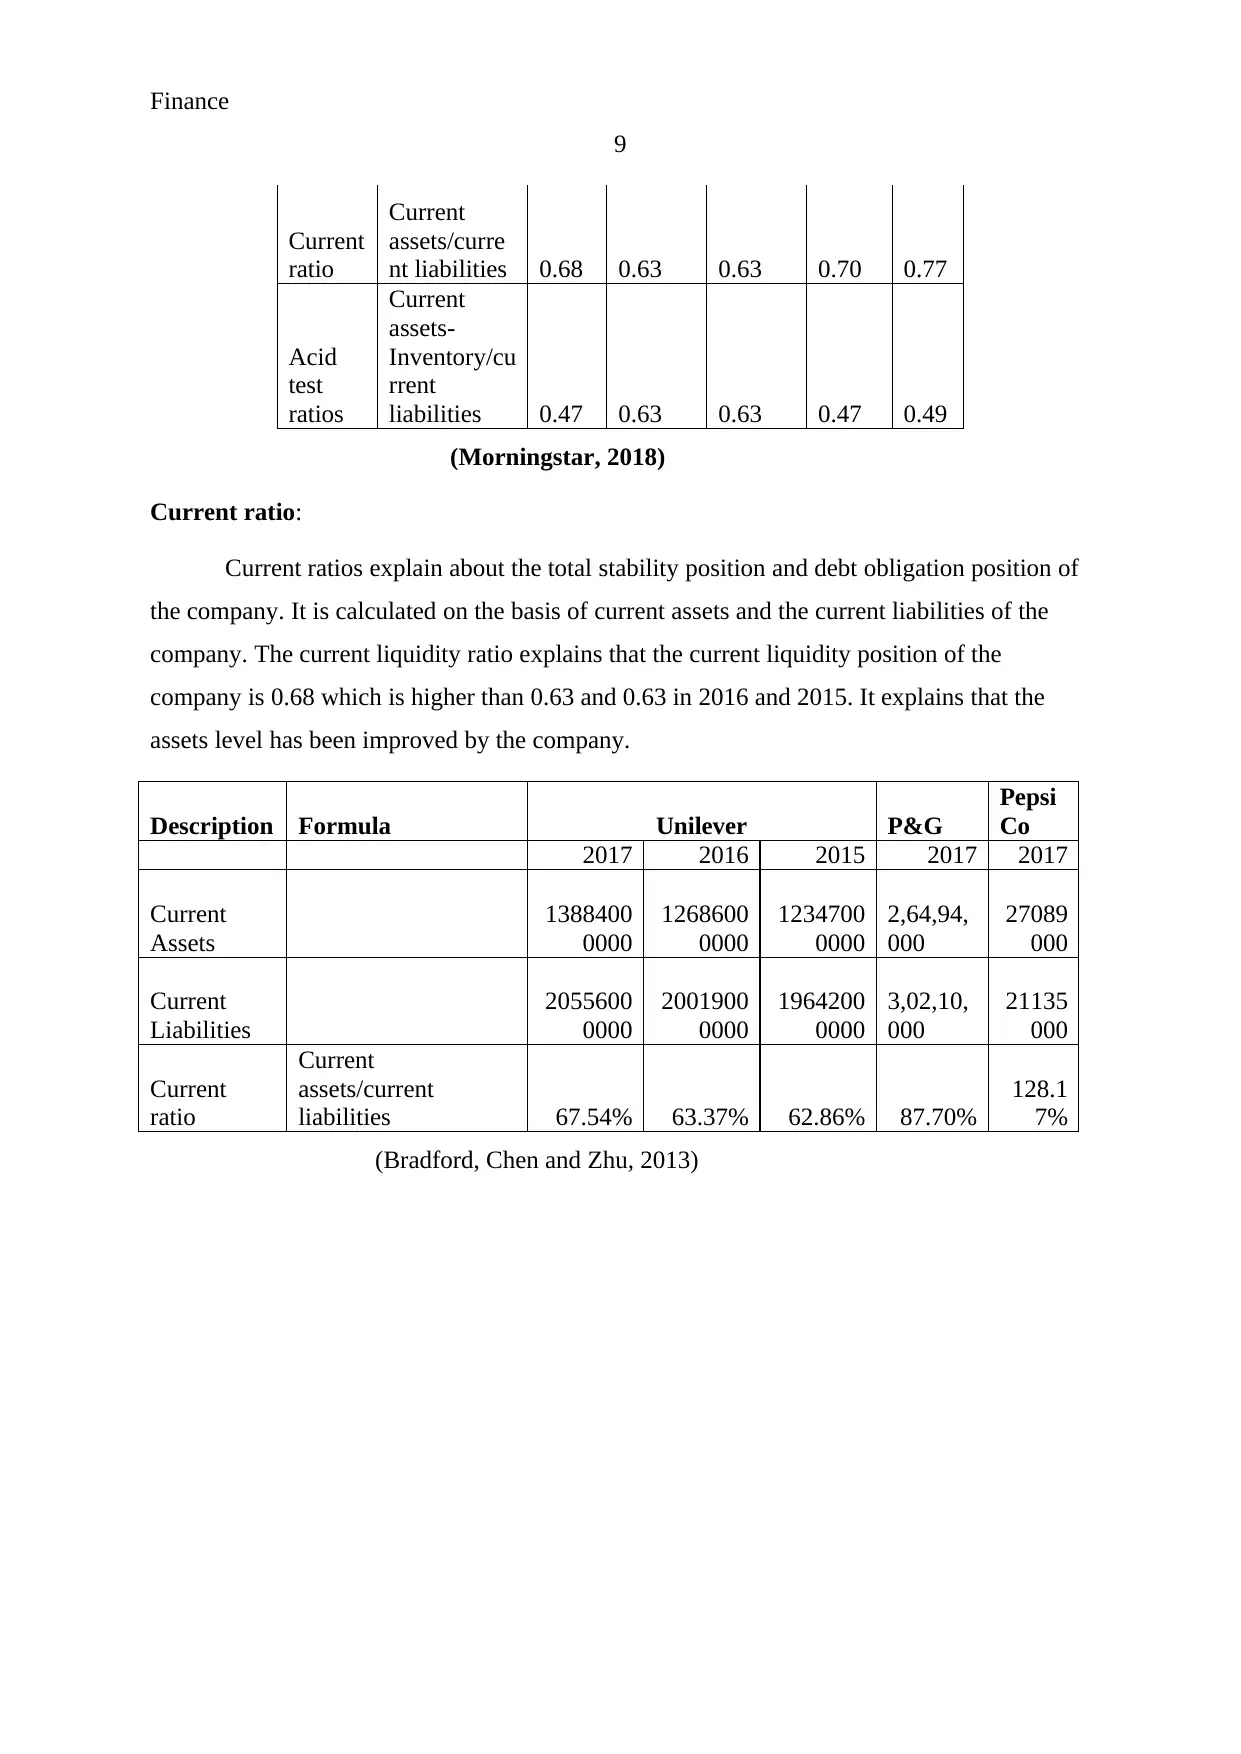
Current ratio:
Current ratios explain about the total stability position and debt obligation position of
the company. It is calculated on the basis of current assets and the current liabilities of the
company. The current liquidity ratio explains that the current liquidity position of the
company is 0.68 which is higher than 0.63 and 0.63 in 2016 and 2015. It explains that the
assets level has been improved by the company.
Description Formula Unilever P&G
Pepsi
Co
2017 2016 2015 2017 2017
Current
Assets
1388400
0000
1268600
0000
1234700
0000
2,64,94,
000
27089
000
Current
Liabilities
2055600
0000
2001900
0000
1964200
0000
3,02,10,
000
21135
000
Current
ratio
Current
assets/current
liabilities 67.54% 63.37% 62.86% 87.70%
128.1
7%
(Bradford, Chen and Zhu, 2013)
9
Current
ratio
Current
assets/curre
nt liabilities 0.68 0.63 0.63 0.70 0.77
Acid
test
ratios
Current
assets-
Inventory/cu
rrent
liabilities 0.47 0.63 0.63 0.47 0.49
(Morningstar, 2018)
Current ratio:
Current ratios explain about the total stability position and debt obligation position of
the company. It is calculated on the basis of current assets and the current liabilities of the
company. The current liquidity ratio explains that the current liquidity position of the
company is 0.68 which is higher than 0.63 and 0.63 in 2016 and 2015. It explains that the
assets level has been improved by the company.
Description Formula Unilever P&G
Pepsi
Co
2017 2016 2015 2017 2017
Current
Assets
1388400
0000
1268600
0000
1234700
0000
2,64,94,
000
27089
000
Current
Liabilities
2055600
0000
2001900
0000
1964200
0000
3,02,10,
000
21135
000
Current
ratio
Current
assets/current
liabilities 67.54% 63.37% 62.86% 87.70%
128.1
7%
(Bradford, Chen and Zhu, 2013)
⊘ This is a preview!⊘
Do you want full access?
Subscribe today to unlock all pages.
Trusted by 1+ million students worldwide
Finance
10
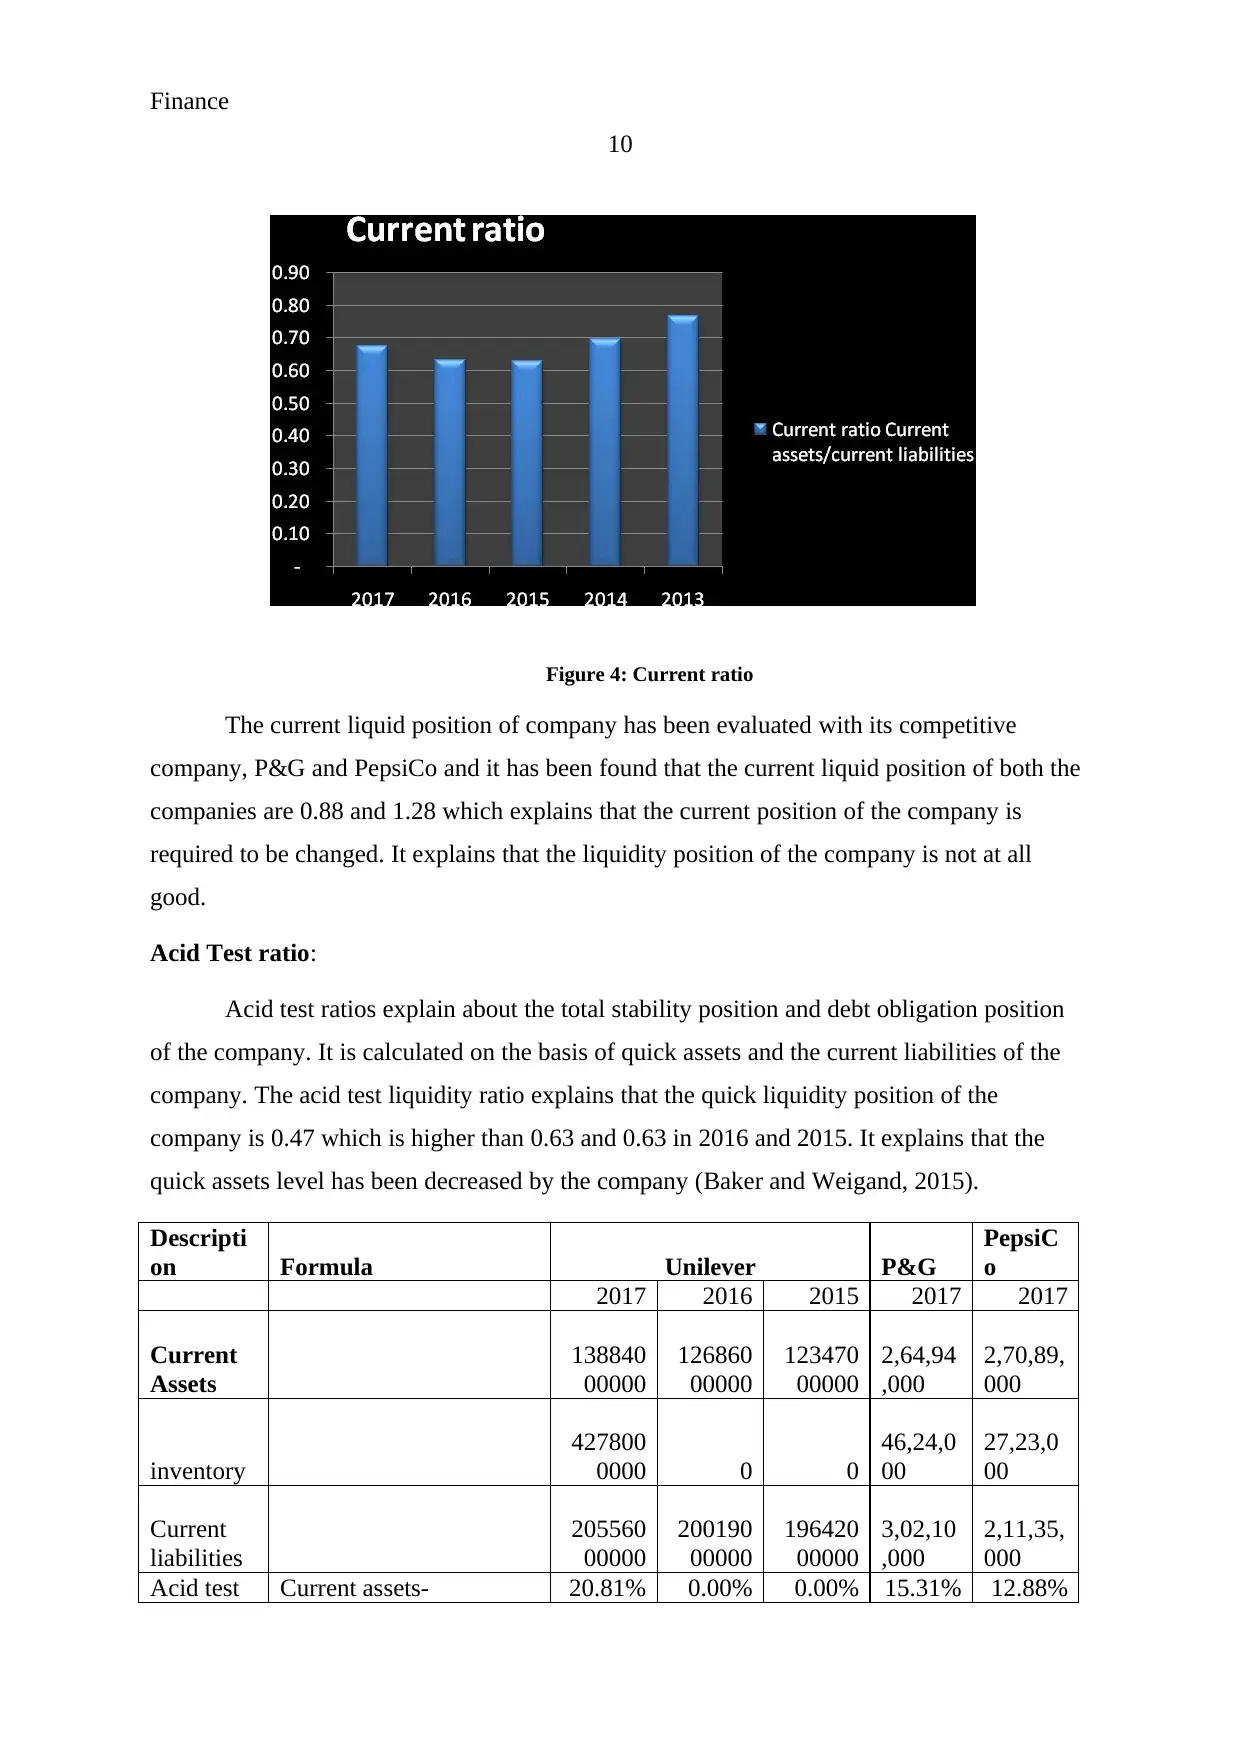
Figure 4: Current ratio
The current liquid position of company has been evaluated with its competitive
company, P&G and PepsiCo and it has been found that the current liquid position of both the
companies are 0.88 and 1.28 which explains that the current position of the company is
required to be changed. It explains that the liquidity position of the company is not at all
good.
Acid Test ratio:
Acid test ratios explain about the total stability position and debt obligation position
of the company. It is calculated on the basis of quick assets and the current liabilities of the
company. The acid test liquidity ratio explains that the quick liquidity position of the
company is 0.47 which is higher than 0.63 and 0.63 in 2016 and 2015. It explains that the
quick assets level has been decreased by the company (Baker and Weigand, 2015).
Descripti
on Formula Unilever P&G
PepsiC
o
2017 2016 2015 2017 2017
Current
Assets
138840
00000
126860
00000
123470
00000
2,64,94
,000
2,70,89,
000
inventory
427800
0000 0 0
46,24,0
00
27,23,0
00
Current
liabilities
205560
00000
200190
00000
196420
00000
3,02,10
,000
2,11,35,
000
Acid test Current assets- 20.81% 0.00% 0.00% 15.31% 12.88%
10
Figure 4: Current ratio
The current liquid position of company has been evaluated with its competitive
company, P&G and PepsiCo and it has been found that the current liquid position of both the
companies are 0.88 and 1.28 which explains that the current position of the company is
required to be changed. It explains that the liquidity position of the company is not at all
good.
Acid Test ratio:
Acid test ratios explain about the total stability position and debt obligation position
of the company. It is calculated on the basis of quick assets and the current liabilities of the
company. The acid test liquidity ratio explains that the quick liquidity position of the
company is 0.47 which is higher than 0.63 and 0.63 in 2016 and 2015. It explains that the
quick assets level has been decreased by the company (Baker and Weigand, 2015).
Descripti
on Formula Unilever P&G
PepsiC
o
2017 2016 2015 2017 2017
Current
Assets
138840
00000
126860
00000
123470
00000
2,64,94
,000
2,70,89,
000
inventory
427800
0000 0 0
46,24,0
00
27,23,0
00
Current
liabilities
205560
00000
200190
00000
196420
00000
3,02,10
,000
2,11,35,
000
Acid test Current assets- 20.81% 0.00% 0.00% 15.31% 12.88%
Paraphrase This Document
Need a fresh take? Get an instant paraphrase of this document with our AI Paraphraser
Finance
11
ratios
Inventory/current
liabilities
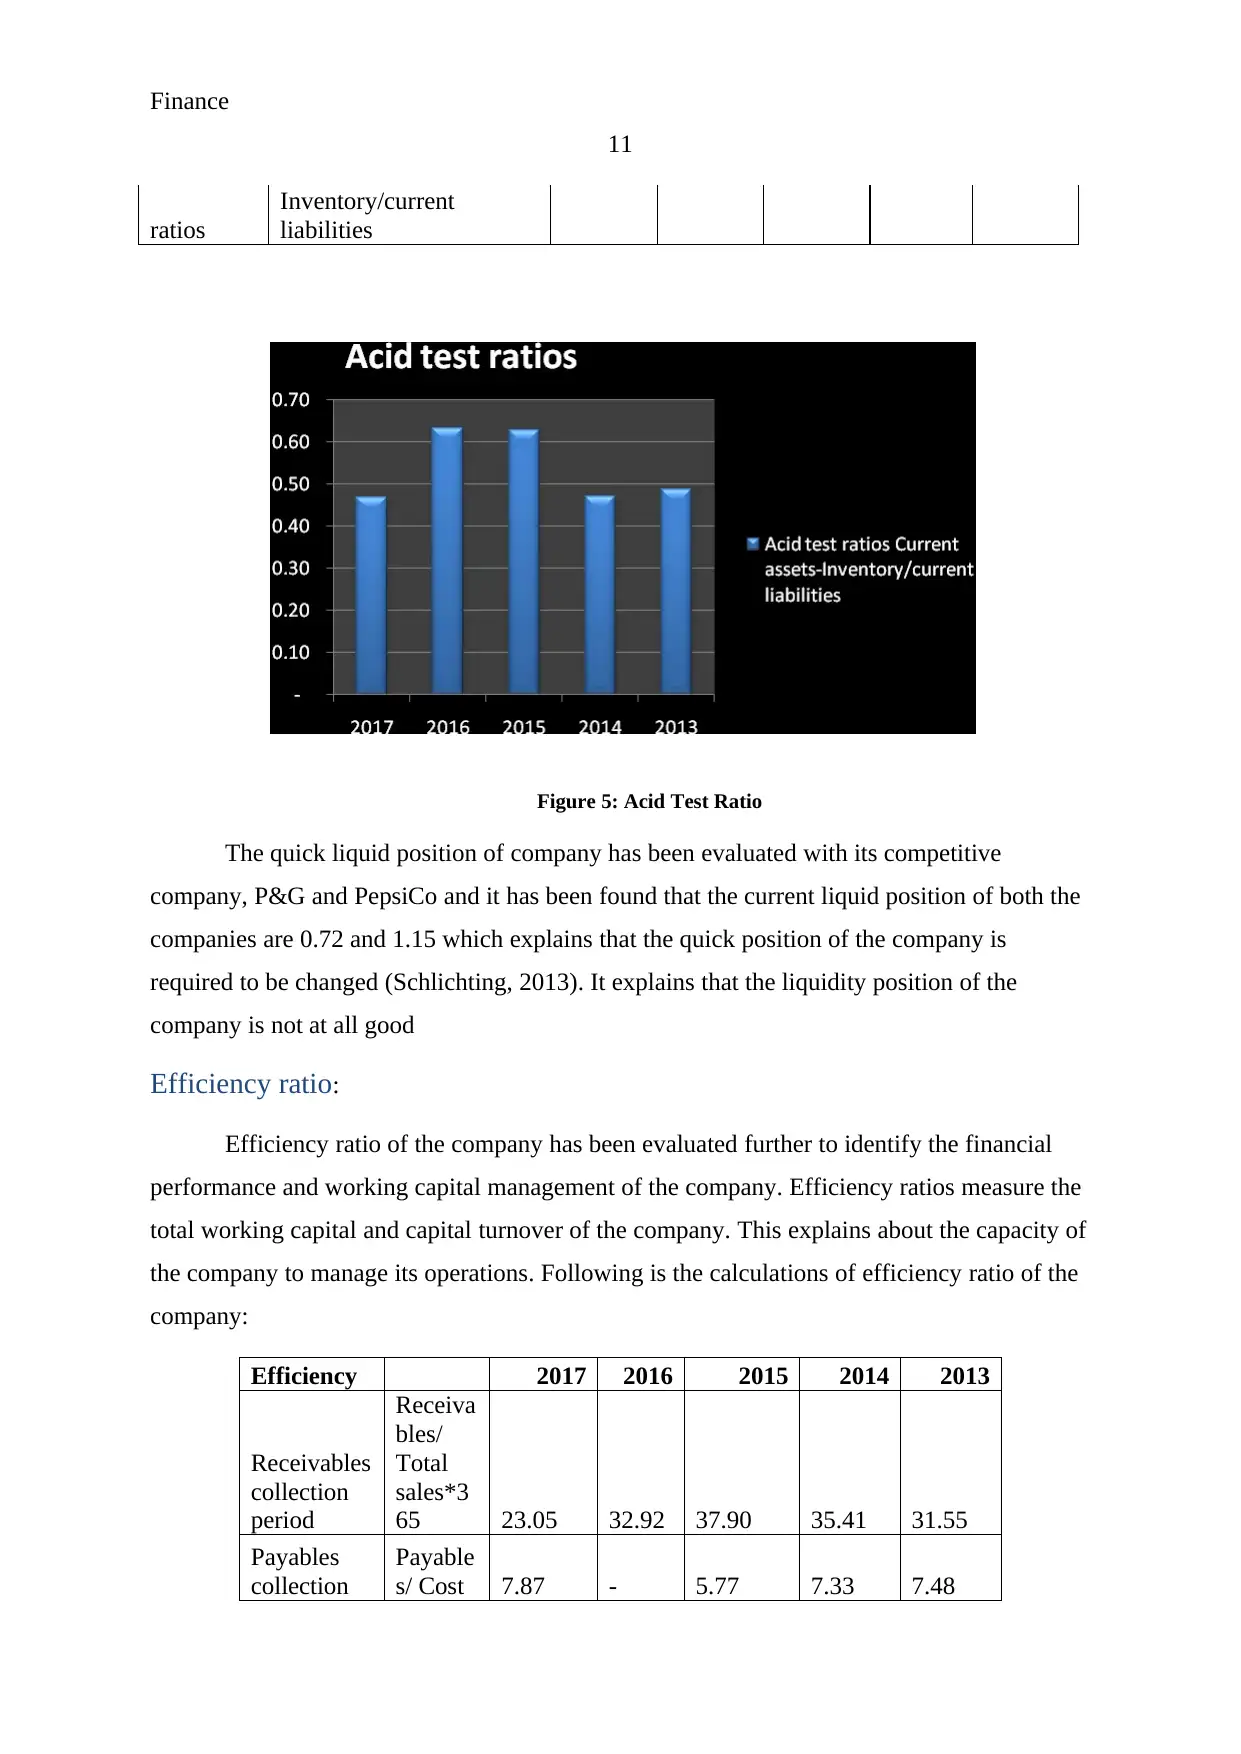
Figure 5: Acid Test Ratio
The quick liquid position of company has been evaluated with its competitive
company, P&G and PepsiCo and it has been found that the current liquid position of both the
companies are 0.72 and 1.15 which explains that the quick position of the company is
required to be changed (Schlichting, 2013). It explains that the liquidity position of the
company is not at all good
Efficiency ratio:
Efficiency ratio of the company has been evaluated further to identify the financial
performance and working capital management of the company. Efficiency ratios measure the
total working capital and capital turnover of the company. This explains about the capacity of
the company to manage its operations. Following is the calculations of efficiency ratio of the
company:
Efficiency 2017 2016 2015 2014 2013
Receivables
collection
period
Receiva
bles/
Total
sales*3
65 23.05 32.92 37.90 35.41 31.55
Payables
collection
Payable
s/ Cost 7.87 - 5.77 7.33 7.48
11
ratios
Inventory/current
liabilities
Figure 5: Acid Test Ratio
The quick liquid position of company has been evaluated with its competitive
company, P&G and PepsiCo and it has been found that the current liquid position of both the
companies are 0.72 and 1.15 which explains that the quick position of the company is
required to be changed (Schlichting, 2013). It explains that the liquidity position of the
company is not at all good
Efficiency ratio:
Efficiency ratio of the company has been evaluated further to identify the financial
performance and working capital management of the company. Efficiency ratios measure the
total working capital and capital turnover of the company. This explains about the capacity of
the company to manage its operations. Following is the calculations of efficiency ratio of the
company:
Efficiency 2017 2016 2015 2014 2013
Receivables
collection
period
Receiva
bles/
Total
sales*3
65 23.05 32.92 37.90 35.41 31.55
Payables
collection
Payable
s/ Cost 7.87 - 5.77 7.33 7.48
Finance
12
period
of
sales*3
65
Inventory
days
Invento
ry/ cost
of
goods
sold
*365 59.24 - - 57.71 63.09
.
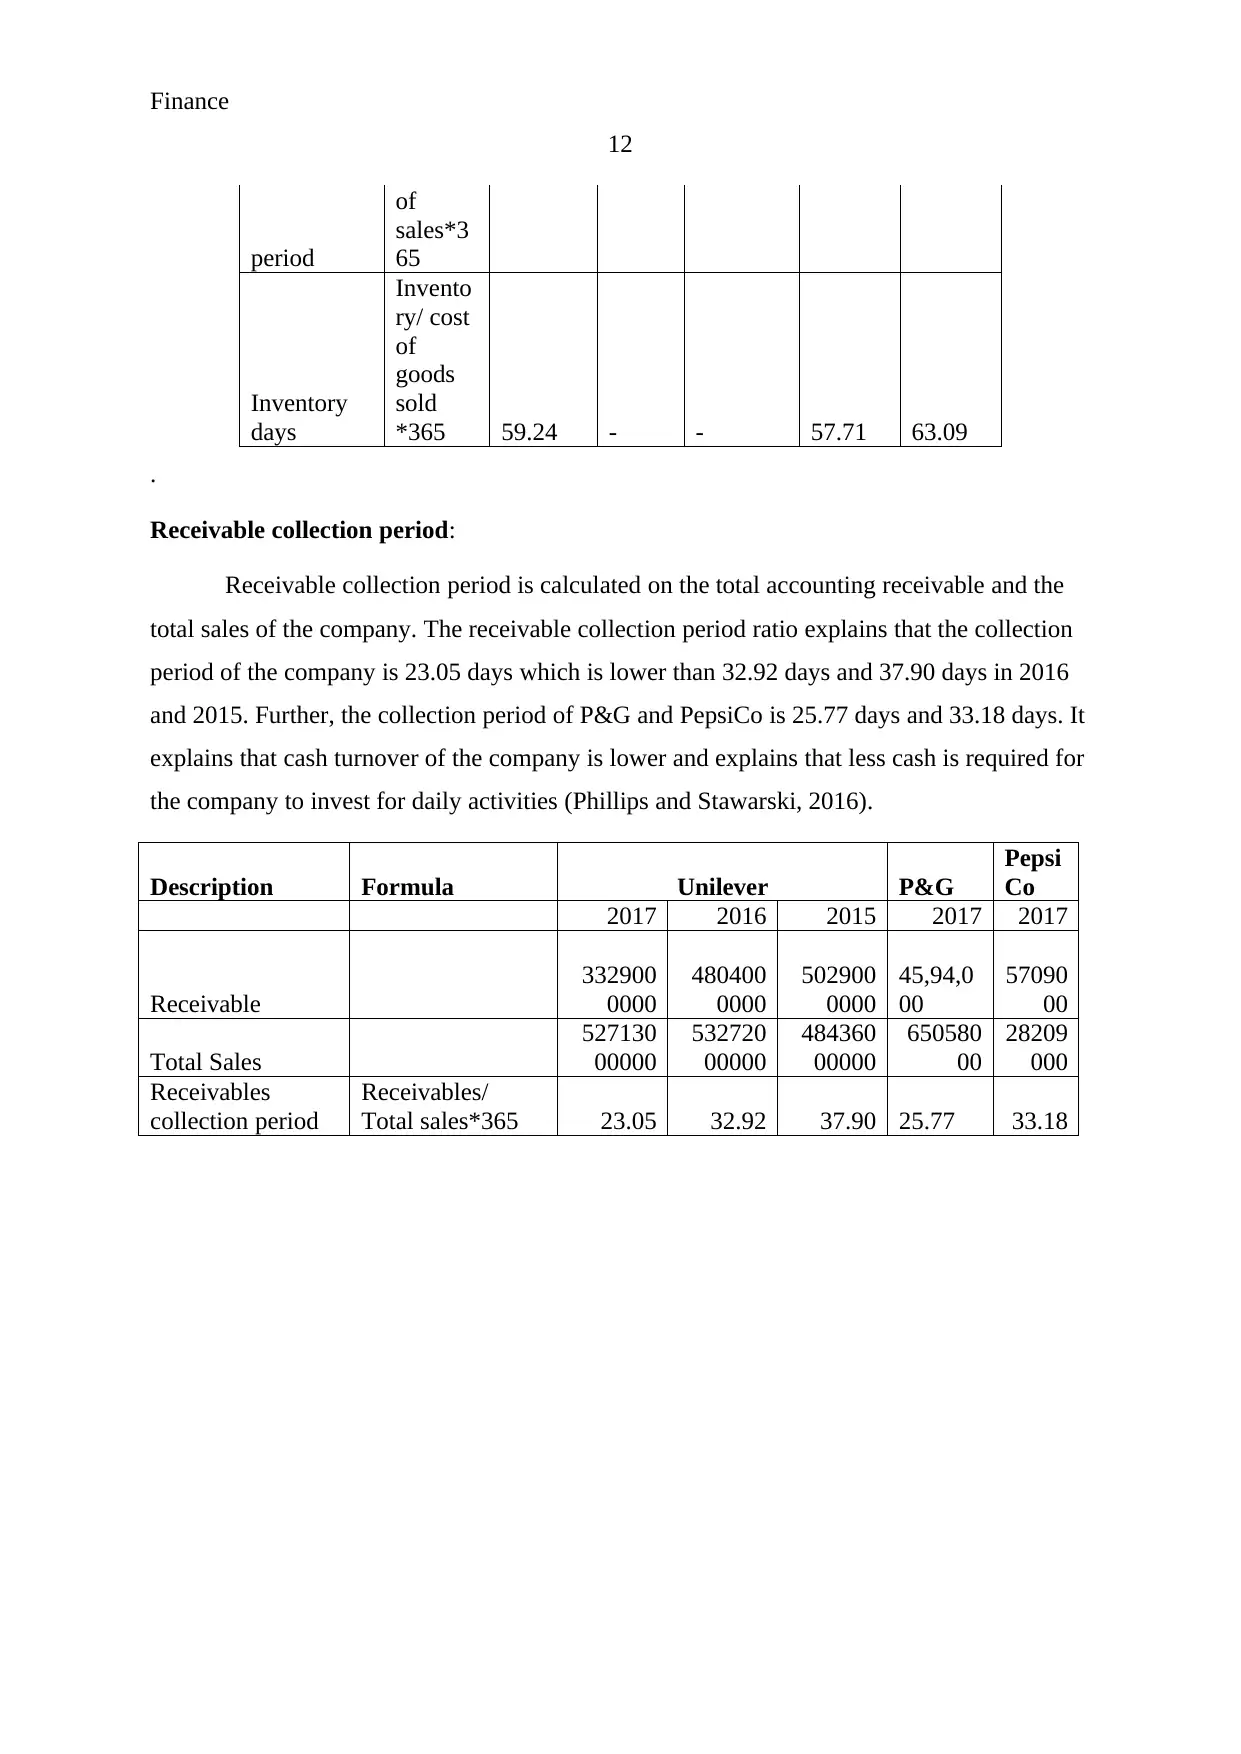
Receivable collection period:
Receivable collection period is calculated on the total accounting receivable and the
total sales of the company. The receivable collection period ratio explains that the collection
period of the company is 23.05 days which is lower than 32.92 days and 37.90 days in 2016
and 2015. Further, the collection period of P&G and PepsiCo is 25.77 days and 33.18 days. It
explains that cash turnover of the company is lower and explains that less cash is required for
the company to invest for daily activities (Phillips and Stawarski, 2016).
Description Formula Unilever P&G
Pepsi
Co
2017 2016 2015 2017 2017
Receivable
332900
0000
480400
0000
502900
0000
45,94,0
00
57090
00
Total Sales
527130
00000
532720
00000
484360
00000
650580
00
28209
000
Receivables
collection period
Receivables/
Total sales*365 23.05 32.92 37.90 25.77 33.18
12
period
of
sales*3
65
Inventory
days
Invento
ry/ cost
of
goods
sold
*365 59.24 - - 57.71 63.09
.
Receivable collection period:
Receivable collection period is calculated on the total accounting receivable and the
total sales of the company. The receivable collection period ratio explains that the collection
period of the company is 23.05 days which is lower than 32.92 days and 37.90 days in 2016
and 2015. Further, the collection period of P&G and PepsiCo is 25.77 days and 33.18 days. It
explains that cash turnover of the company is lower and explains that less cash is required for
the company to invest for daily activities (Phillips and Stawarski, 2016).
Description Formula Unilever P&G
Pepsi
Co
2017 2016 2015 2017 2017
Receivable
332900
0000
480400
0000
502900
0000
45,94,0
00
57090
00
Total Sales
527130
00000
532720
00000
484360
00000
650580
00
28209
000
Receivables
collection period
Receivables/
Total sales*365 23.05 32.92 37.90 25.77 33.18
⊘ This is a preview!⊘
Do you want full access?
Subscribe today to unlock all pages.
Trusted by 1+ million students worldwide
1 out of 29
Related Documents


Your All-in-One AI-Powered Toolkit for Academic Success.
+13062052269
info@desklib.com
Available 24*7 on WhatsApp / Email
![[object Object]](/_next/static/media/star-bottom.7253800d.svg)
Unlock your academic potential
Copyright © 2020–2026 A2Z Services. All Rights Reserved. Developed and managed by ZUCOL.