BA201 Statistics: Sampling Distribution Analysis and Calculations
VerifiedAdded on 2020/04/21
|12
|972
|234
Homework Assignment
AI Summary
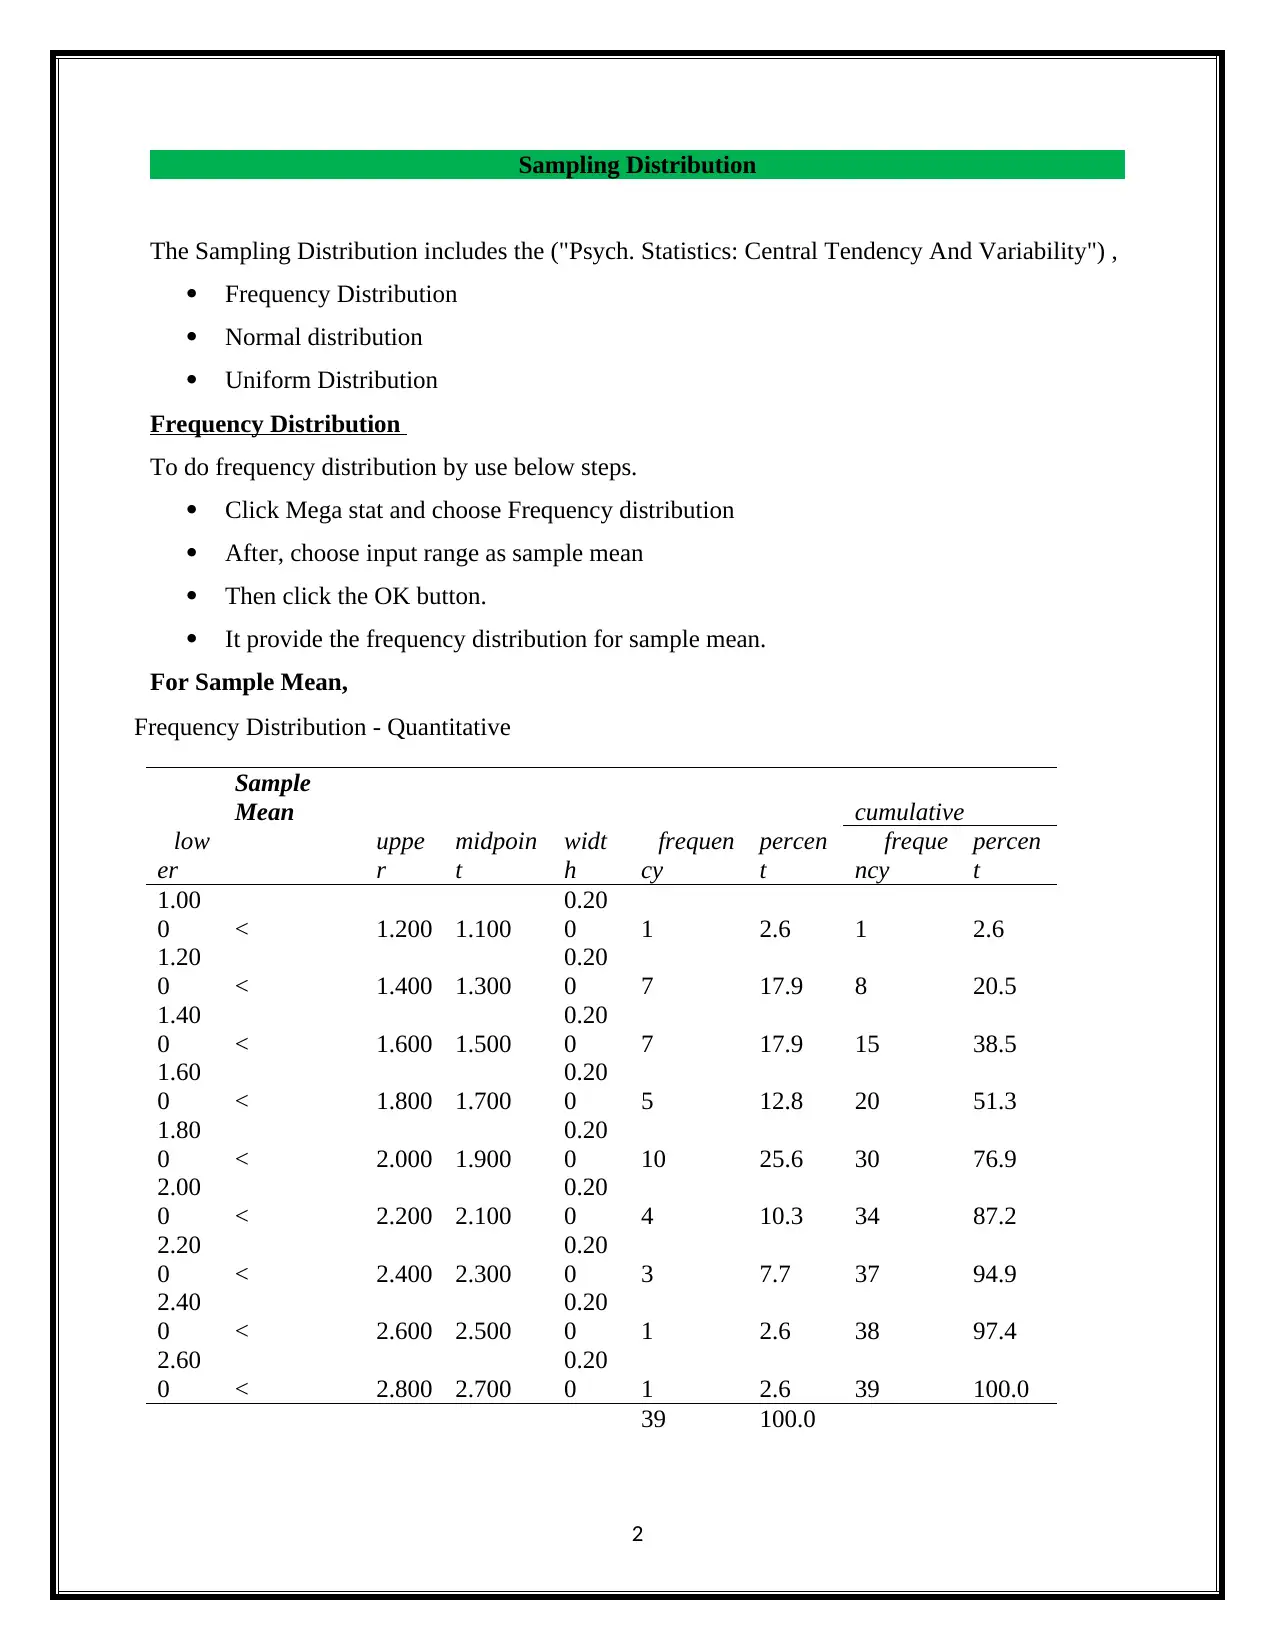
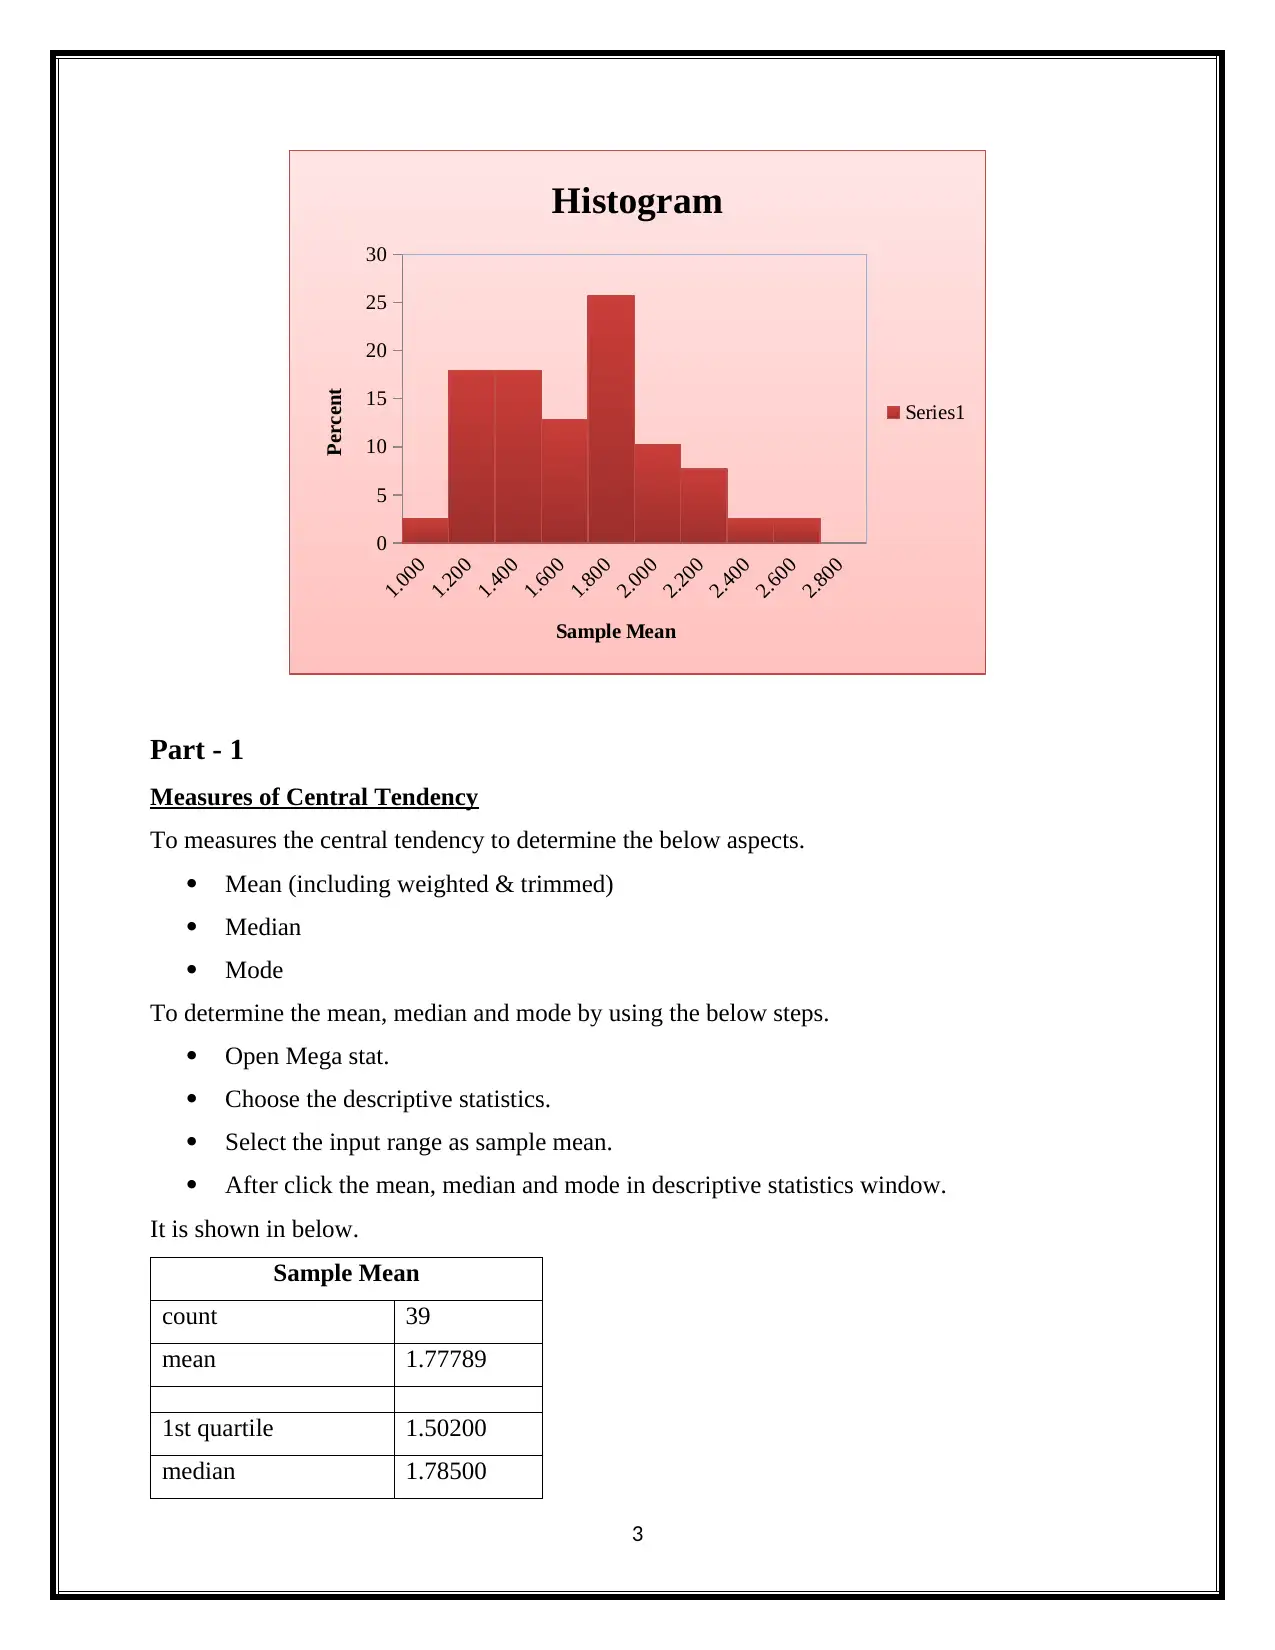
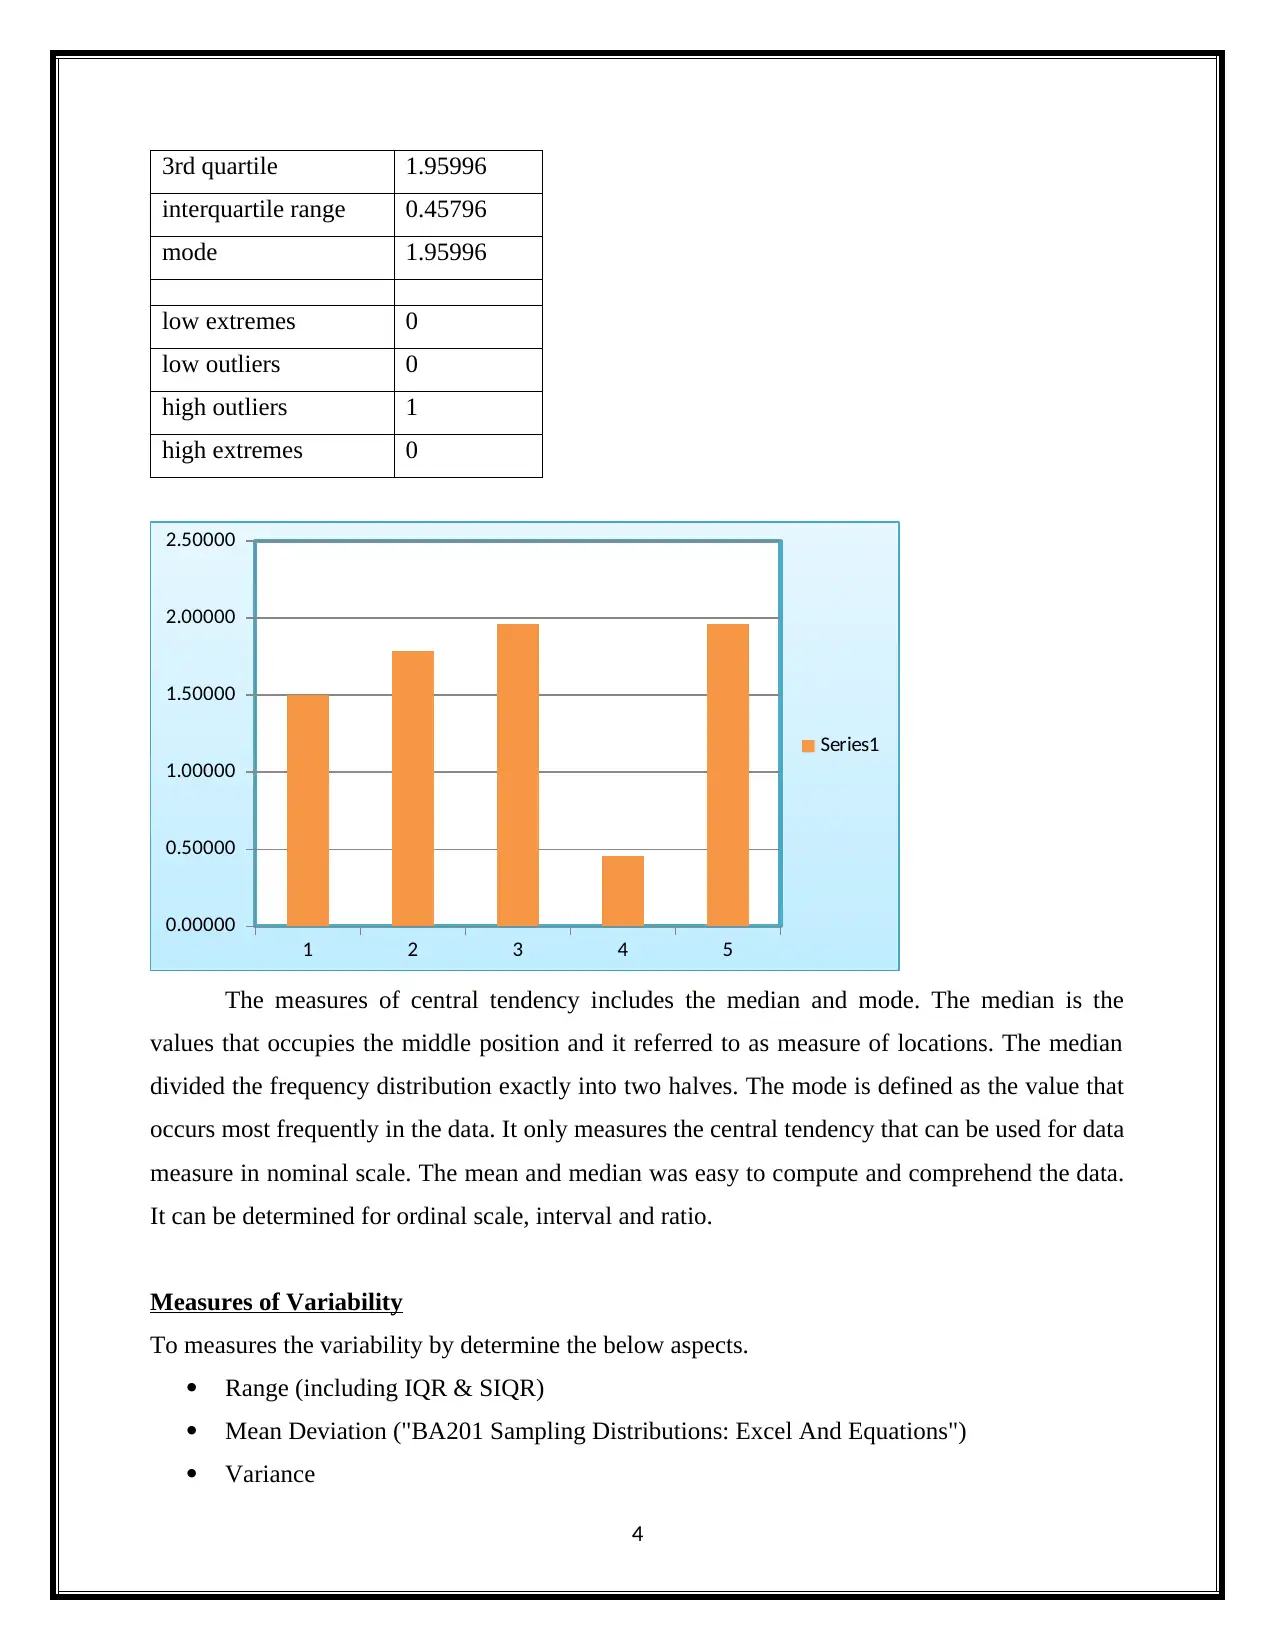
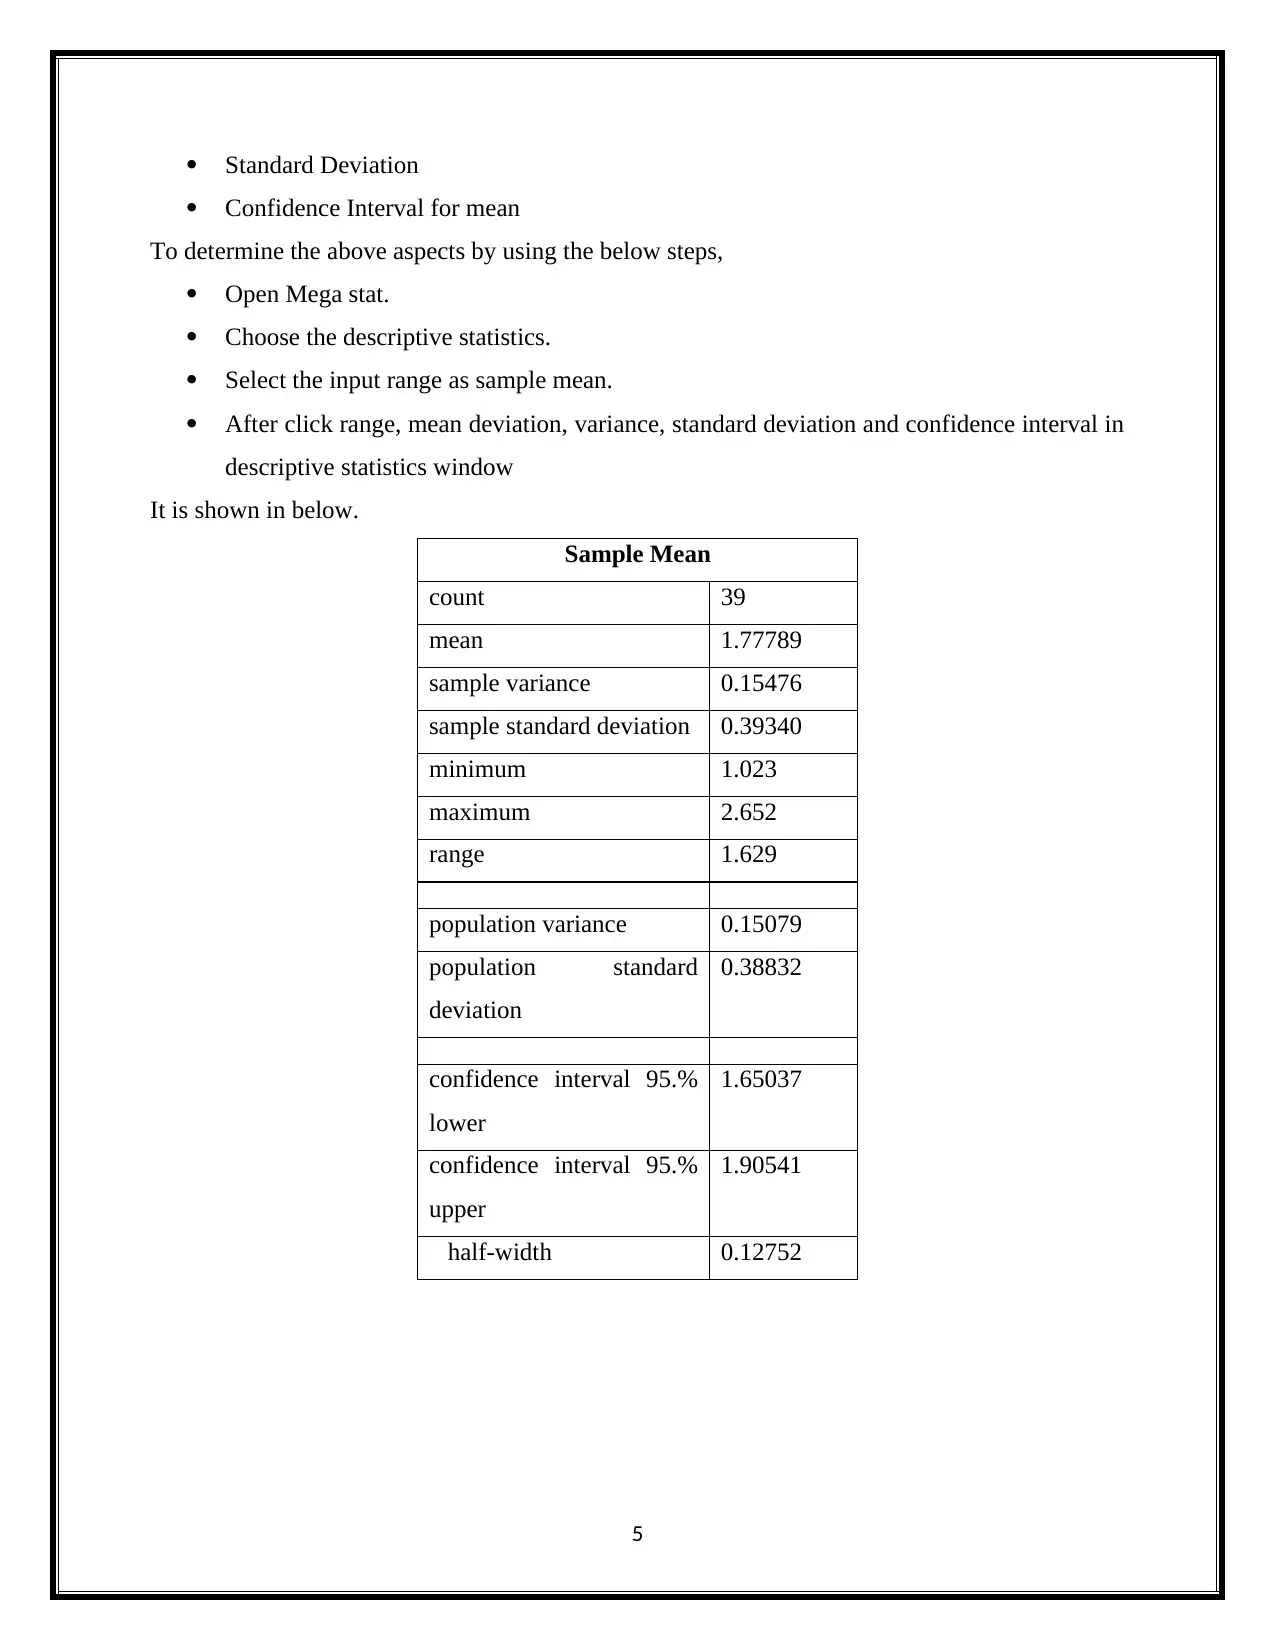
This assignment solution analyzes sampling distributions, covering key statistical concepts such as central tendency, variability, and probability. The solution demonstrates the use of MegaStat to perform frequency distribution analysis, calculate measures of central tendency (mean, median, mode) a...
Read More
Contribute Materials
Your contribution can guide someone’s learning journey. Share your
documents today.

STATISTICS
Secure Best Marks with AI Grader
Need help grading? Try our AI Grader for instant feedback on your assignments.

Sampling Distribution
The Sampling Distribution includes the ("Psych. Statistics: Central Tendency And Variability") ,
Frequency Distribution
Normal distribution
Uniform Distribution
Frequency Distribution
To do frequency distribution by use below steps.
Click Mega stat and choose Frequency distribution
After, choose input range as sample mean
Then click the OK button.
It provide the frequency distribution for sample mean.
For Sample Mean,
Frequency Distribution - Quantitative
Sample
Mean cumulative
low
er
uppe
r
midpoin
t
widt
h
frequen
cy
percen
t
freque
ncy
percen
t
1.00
0 < 1.200 1.100
0.20
0 1 2.6 1 2.6
1.20
0 < 1.400 1.300
0.20
0 7 17.9 8 20.5
1.40
0 < 1.600 1.500
0.20
0 7 17.9 15 38.5
1.60
0 < 1.800 1.700
0.20
0 5 12.8 20 51.3
1.80
0 < 2.000 1.900
0.20
0 10 25.6 30 76.9
2.00
0 < 2.200 2.100
0.20
0 4 10.3 34 87.2
2.20
0 < 2.400 2.300
0.20
0 3 7.7 37 94.9
2.40
0 < 2.600 2.500
0.20
0 1 2.6 38 97.4
2.60
0 < 2.800 2.700
0.20
0 1 2.6 39 100.0
39 100.0
2

1.000
1.200
1.400
1.600
1.800
2.000
2.200
2.400
2.600
2.800
0
5
10
15
20
25
30
Histogram
Series1
Sample Mean
Percent
Part - 1
Measures of Central Tendency
To measures the central tendency to determine the below aspects.
Mean (including weighted & trimmed)
Median
Mode
To determine the mean, median and mode by using the below steps.
Open Mega stat.
Choose the descriptive statistics.
Select the input range as sample mean.
After click the mean, median and mode in descriptive statistics window.
It is shown in below.
Sample Mean
count 39
mean 1.77789
1st quartile 1.50200
median 1.78500
3

3rd quartile 1.95996
interquartile range 0.45796
mode 1.95996
low extremes 0
low outliers 0
high outliers 1
high extremes 0
1 2 3 4 5
0.00000
0.50000
1.00000
1.50000
2.00000
2.50000
Series1
The measures of central tendency includes the median and mode. The median is the
values that occupies the middle position and it referred to as measure of locations. The median
divided the frequency distribution exactly into two halves. The mode is defined as the value that
occurs most frequently in the data. It only measures the central tendency that can be used for data
measure in nominal scale. The mean and median was easy to compute and comprehend the data.
It can be determined for ordinal scale, interval and ratio.
Measures of Variability
To measures the variability by determine the below aspects.
Range (including IQR & SIQR)
Mean Deviation ("BA201 Sampling Distributions: Excel And Equations")
Variance
4
Secure Best Marks with AI Grader
Need help grading? Try our AI Grader for instant feedback on your assignments.

Standard Deviation
Confidence Interval for mean
To determine the above aspects by using the below steps,
Open Mega stat.
Choose the descriptive statistics.
Select the input range as sample mean.
After click range, mean deviation, variance, standard deviation and confidence interval in
descriptive statistics window
It is shown in below.
Sample Mean
count 39
mean 1.77789
sample variance 0.15476
sample standard deviation 0.39340
minimum 1.023
maximum 2.652
range 1.629
population variance 0.15079
population standard
deviation
0.38832
confidence interval 95.%
lower
1.65037
confidence interval 95.%
upper
1.90541
half-width 0.12752
5

1 2 3 4 5 6
0.00000
0.50000
1.00000
1.50000
2.00000
2.50000
3.00000
Series1
The effect of variability measurement in sampling distribution is requires the successive
sampling. It increasing the sampling size. If sampling size is increased the variability of each
sampling distributions are decreases based on sample size.
Measures of distribution
Normal Distribution
To do normal distribution by use the below steps.
Open Mega stat and click the probability to choose the normal distribution.
It is shown in below.
6

The measures of distribution also requires the successive sampling. The effect of
distribution measures determine the successive sampling based on sample size and sample mean.
The distribution measures includes the frequency distributions, normal distribution. The
frequency distribution of sample means quickly approach the shape of a normal distribution. The
sampling distribution has the normal distribution with mean that is equal to the population mean.
Measure of Probability
To determine the probability by using the below steps.
First Open Mega stat and click the probability to choose the binominal distribution.
It is shown in below.
Binominal Distribution
1 n
0.5 p
cumulative
X P(X) probability
0 0.50000 0.50000
1 0.50000 1.00000
1.00000
0.500 expected value
0.250 variance
0.500 standard deviation
7
Paraphrase This Document
Need a fresh take? Get an instant paraphrase of this document with our AI Paraphraser

0 1
0.00
0.10
0.20
0.30
0.40
0.50
0.60
Binomial distribution (n = 1, p = 0.5)
Series1
X
P(X)
Basically successive sampling and increasing the sample size work for all distributions
based on the probability. The probability distribution increasing the sample sizes and sample
mean. The sampling distribution measure the probability to provide the successive sample mean
and sample size.
Part - 2
To determine the sample size by using the below steps.
Open the Mega stat.
Choose the confidence interval and sample size.
Choose the sample size
Enter the Error tolerance and standard Deviation
After, choose the confidence level is 9
Then click the OK button.
It is shown in below.
Sample size – 1
8

Sample size - mean
0.5 E, error tolerance
1 standard deviation
95% confidence level
1.960 z
15.366 sample size
16 rounded up
1 2
0
0.5
1
1.5
2
2.5
Series1
Sample Size – 2
9
0.5 E, error tolerance
1 standard deviation
95% confidence level
1.960 z
15.366 sample size
16 rounded up
1 2
0
0.5
1
1.5
2
2.5
Series1
Sample Size – 2
9

Sample size - mean
1.5 E, error tolerance
2 standard deviation
95% confidence level
1.96
0
z
6.82
9
sample size
7 rounded up
1 2
1.93
1.94
1.95
1.96
1.97
1.98
1.99
2
2.01
Series1
10
1.5 E, error tolerance
2 standard deviation
95% confidence level
1.96
0
z
6.82
9
sample size
7 rounded up
1 2
1.93
1.94
1.95
1.96
1.97
1.98
1.99
2
2.01
Series1
10
Secure Best Marks with AI Grader
Need help grading? Try our AI Grader for instant feedback on your assignments.

Sample Size – 5
Sample size - mean
2.5 E, error tolerance
5 standard deviation
95% confidence level
1.960 z
15.36
6
sample size
16 rounded up
11
Sample size - mean
2.5 E, error tolerance
5 standard deviation
95% confidence level
1.960 z
15.36
6
sample size
16 rounded up
11

1 2
0
1
2
3
4
5
6
Series1
Sample Size – 30
Sample size - mean
15 E, error tolerance
30 standard deviation
95% confidence level
1.960 z
15.366 sample size
s16 rounded up
12
0
1
2
3
4
5
6
Series1
Sample Size – 30
Sample size - mean
15 E, error tolerance
30 standard deviation
95% confidence level
1.960 z
15.366 sample size
s16 rounded up
12
1 out of 12
Related Documents

Your All-in-One AI-Powered Toolkit for Academic Success.
+13062052269
info@desklib.com
Available 24*7 on WhatsApp / Email
Unlock your academic potential
© 2024 | Zucol Services PVT LTD | All rights reserved.