BA30592E - Data Analysis of Brexit's Impact on UK Organizations

Verified

Added on  2022/11/29

|14
|1600
|68
Homework Assignment
AI Summary
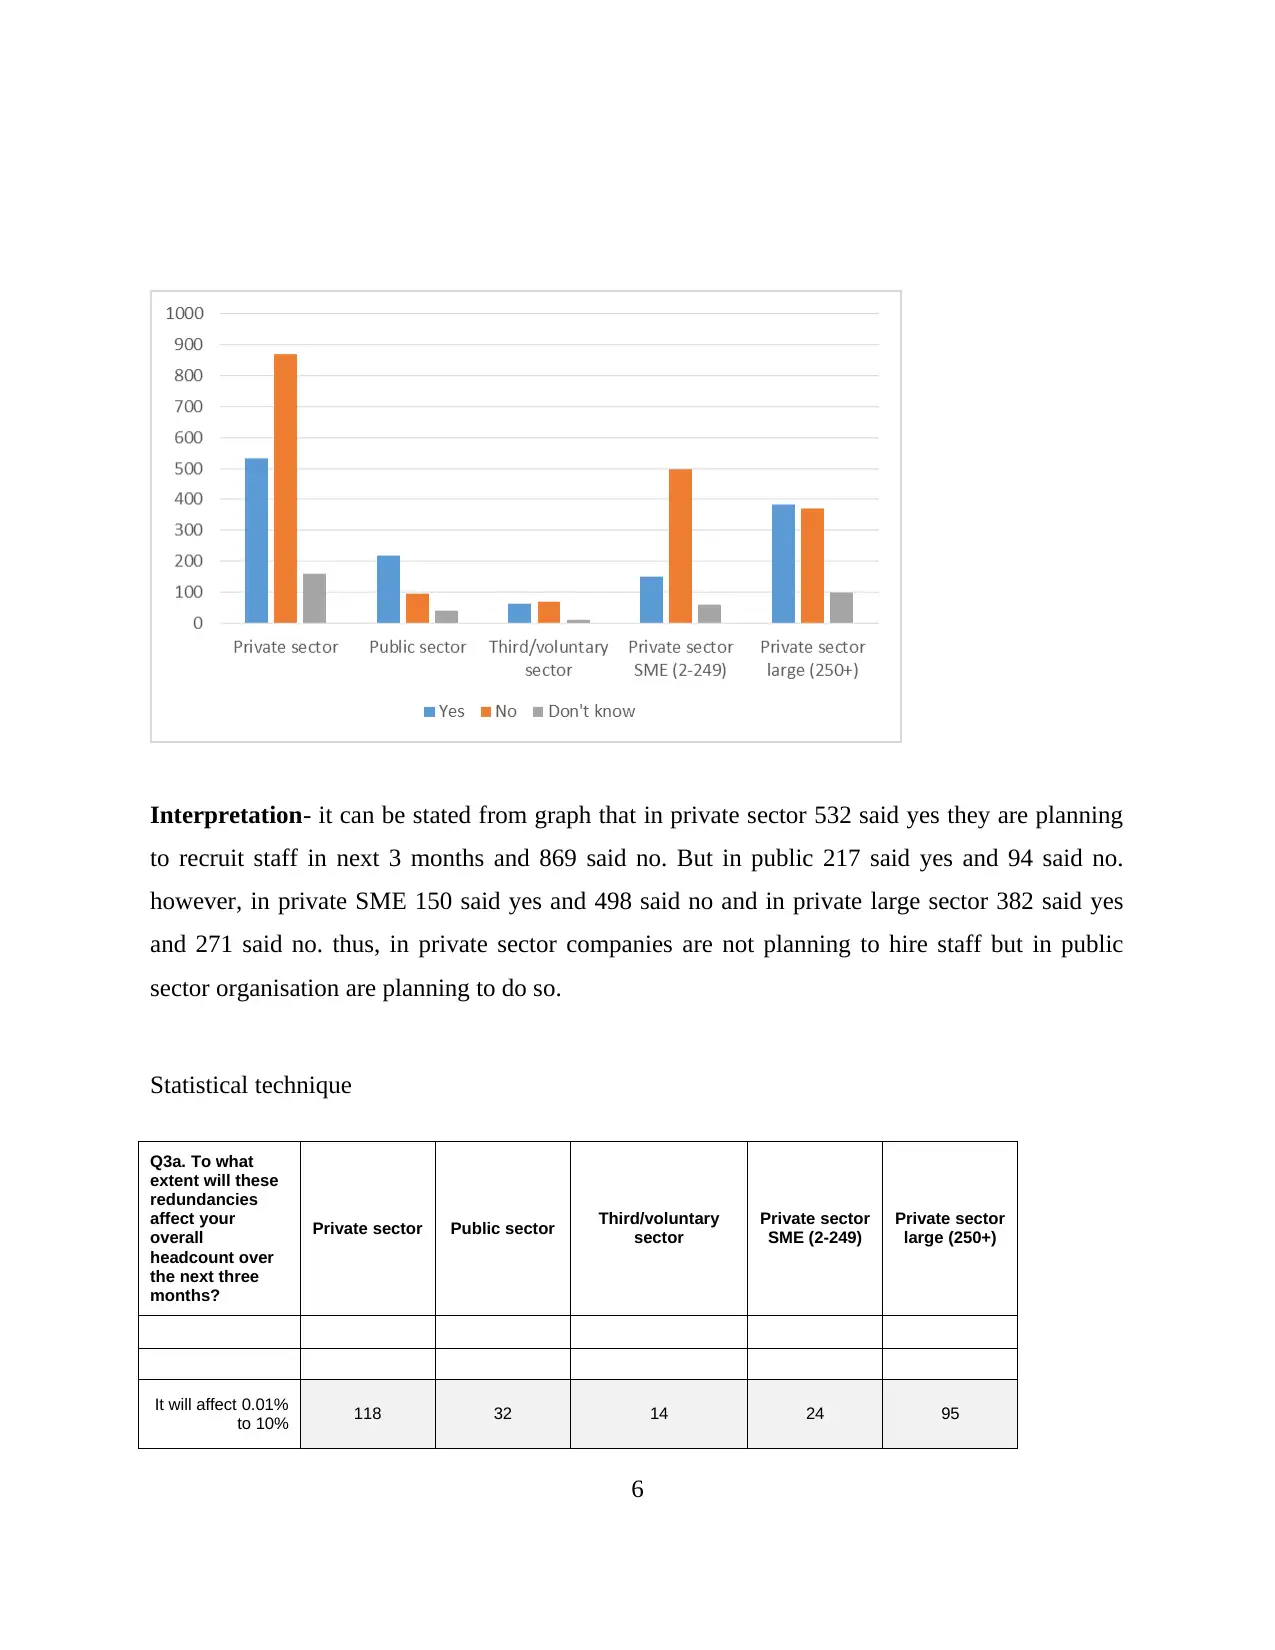
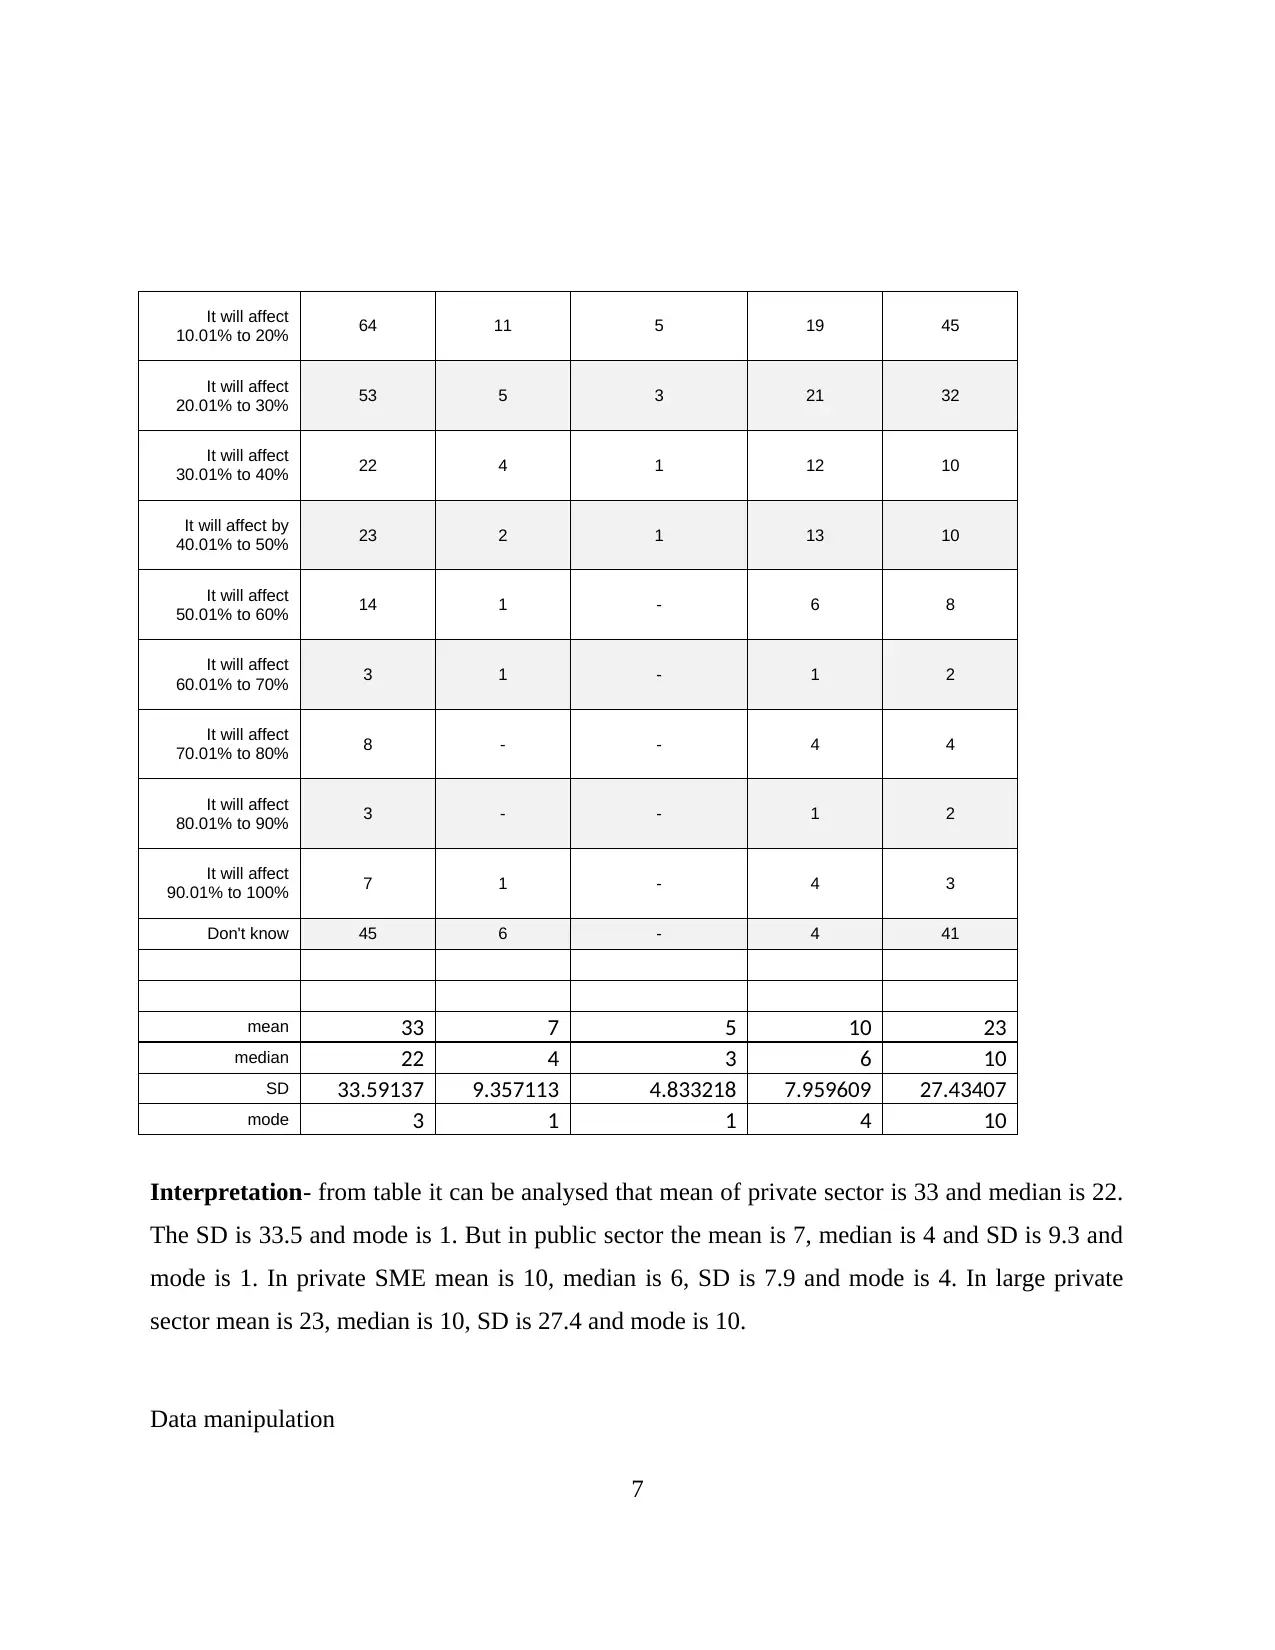
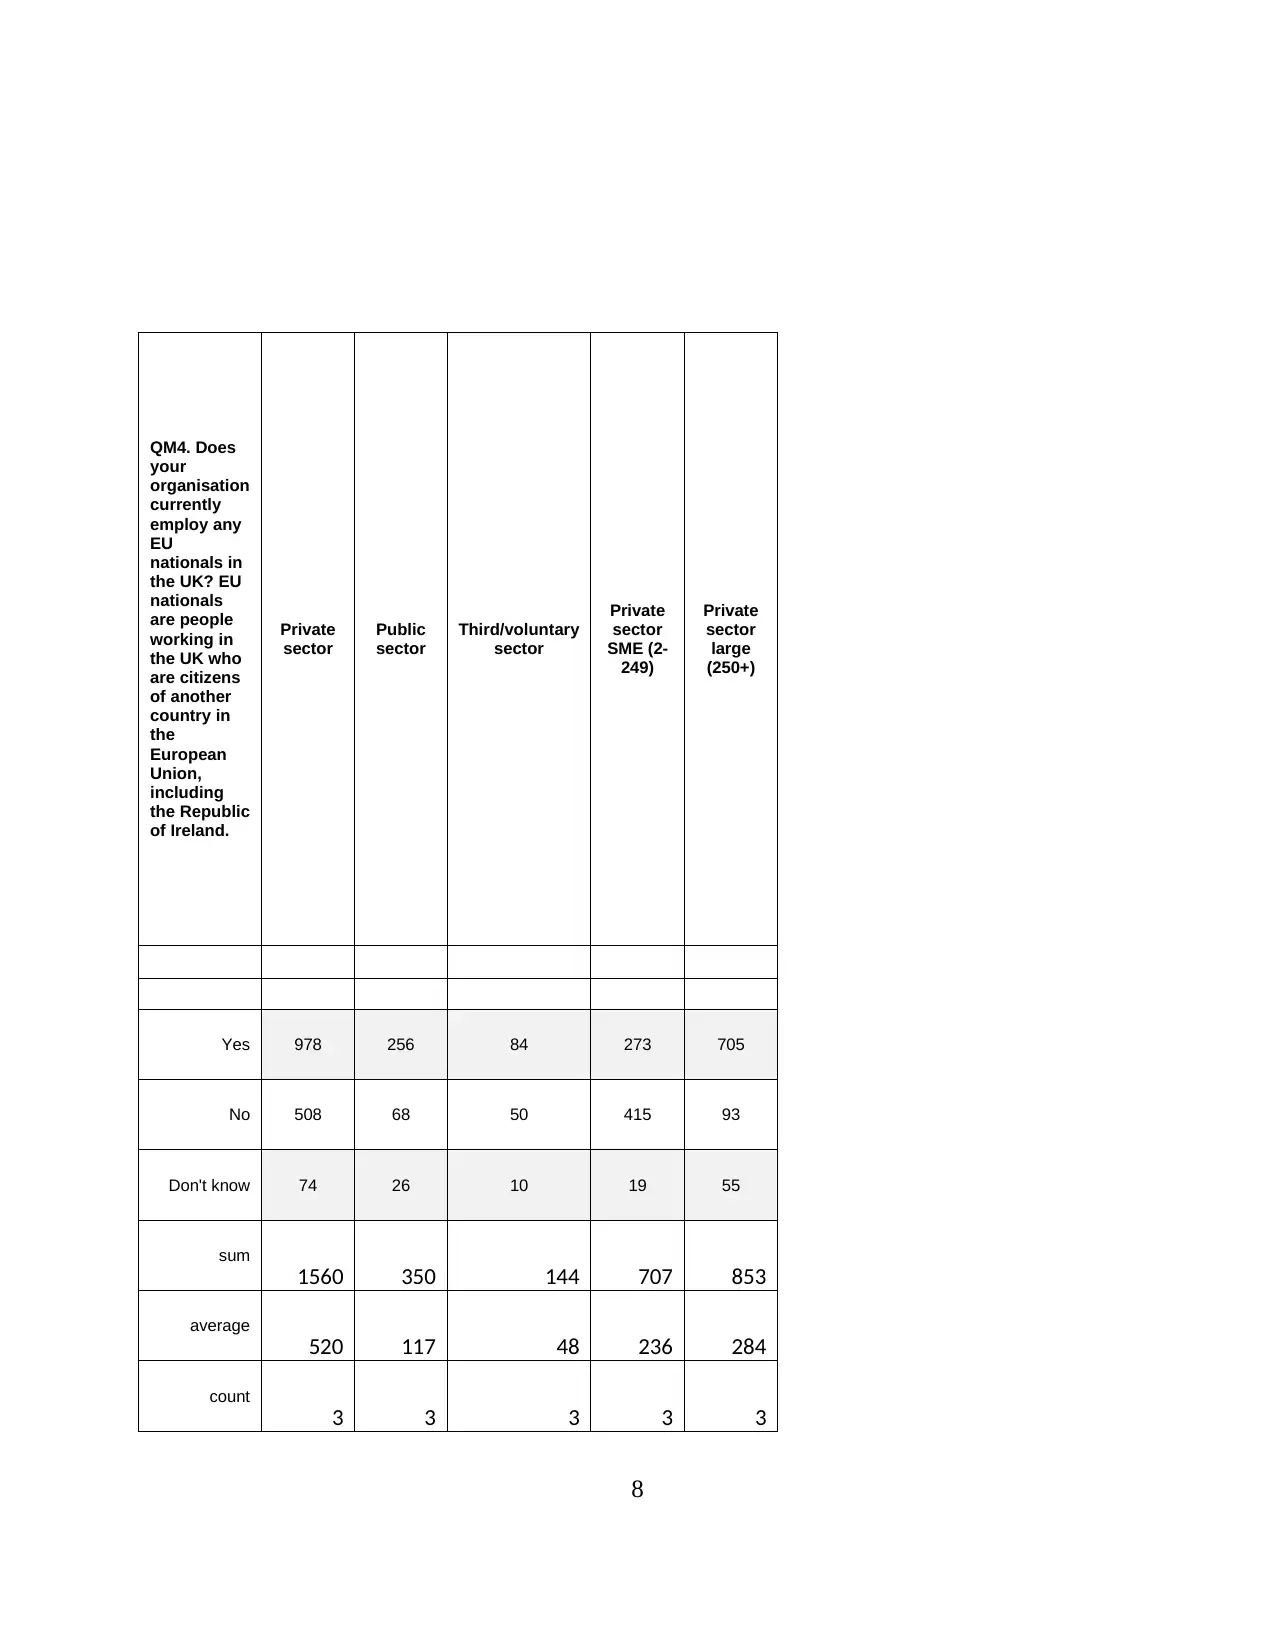
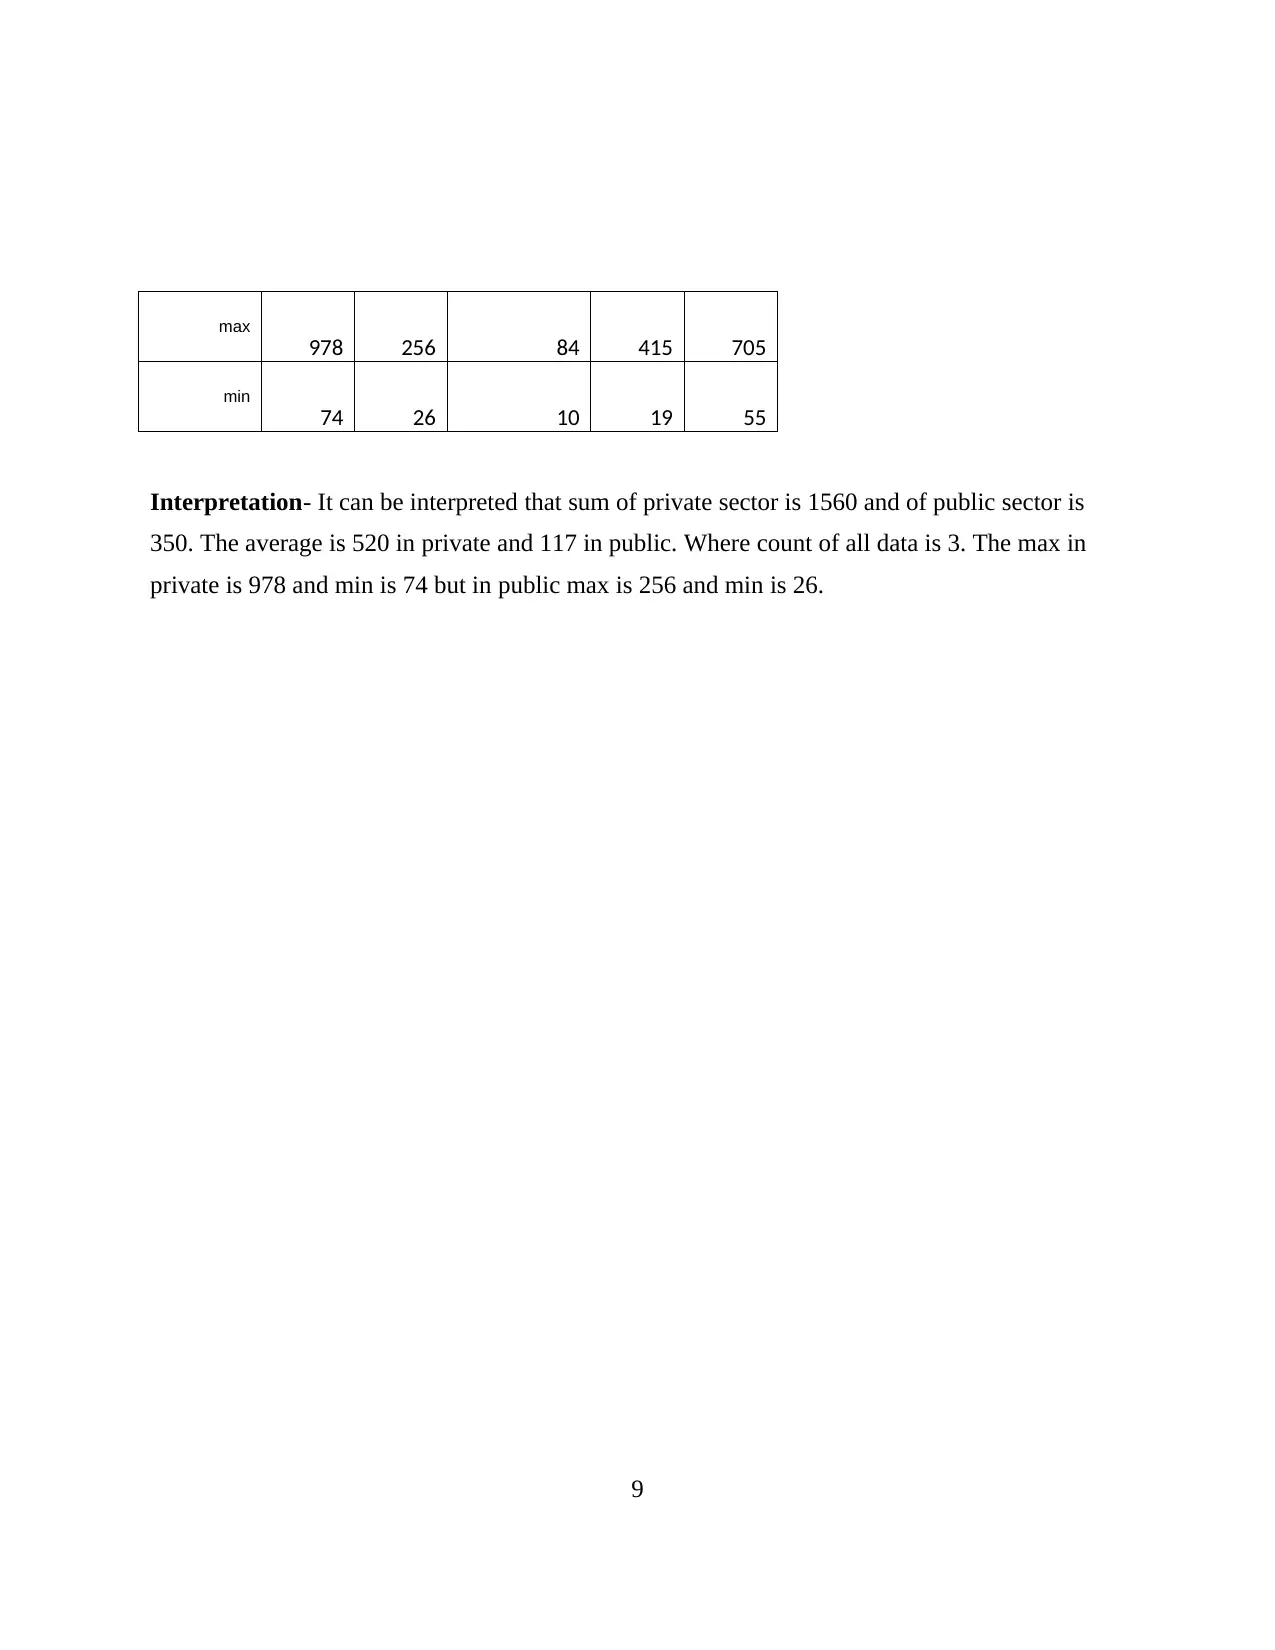
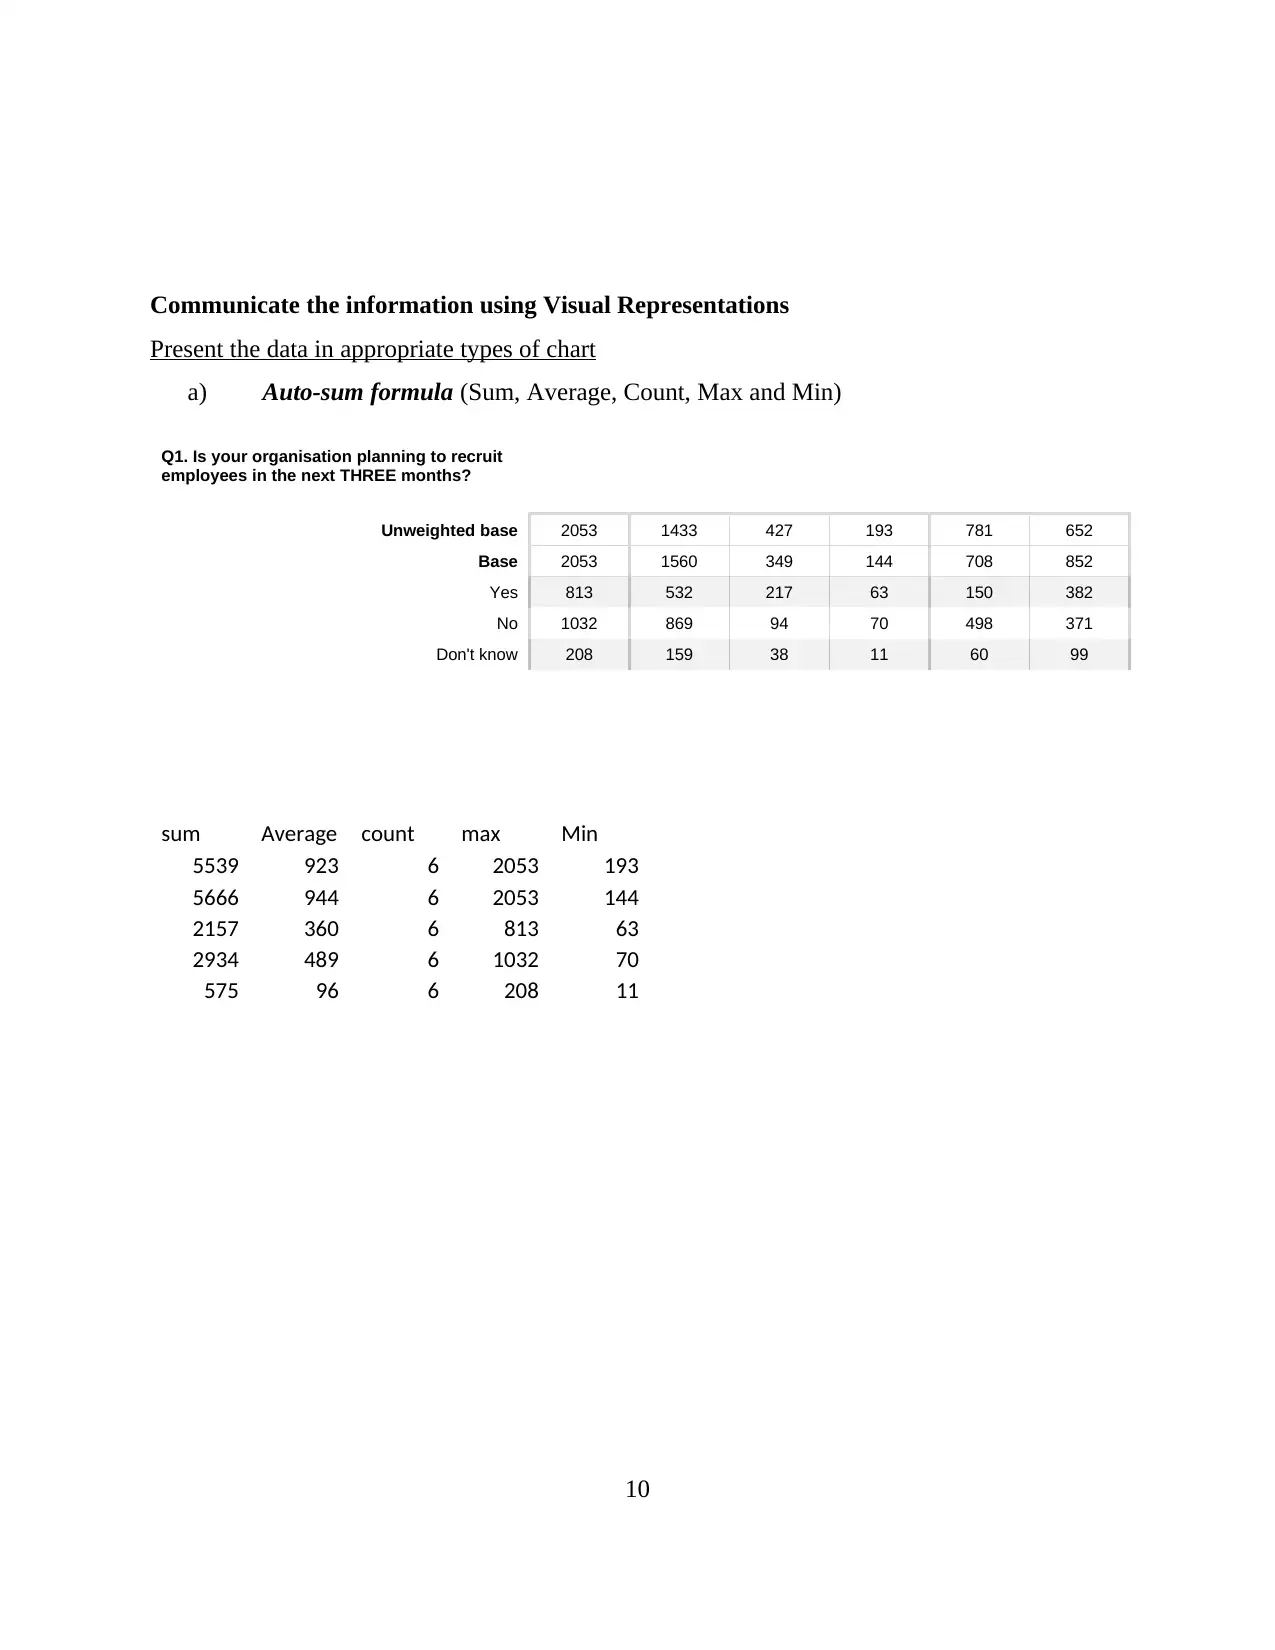
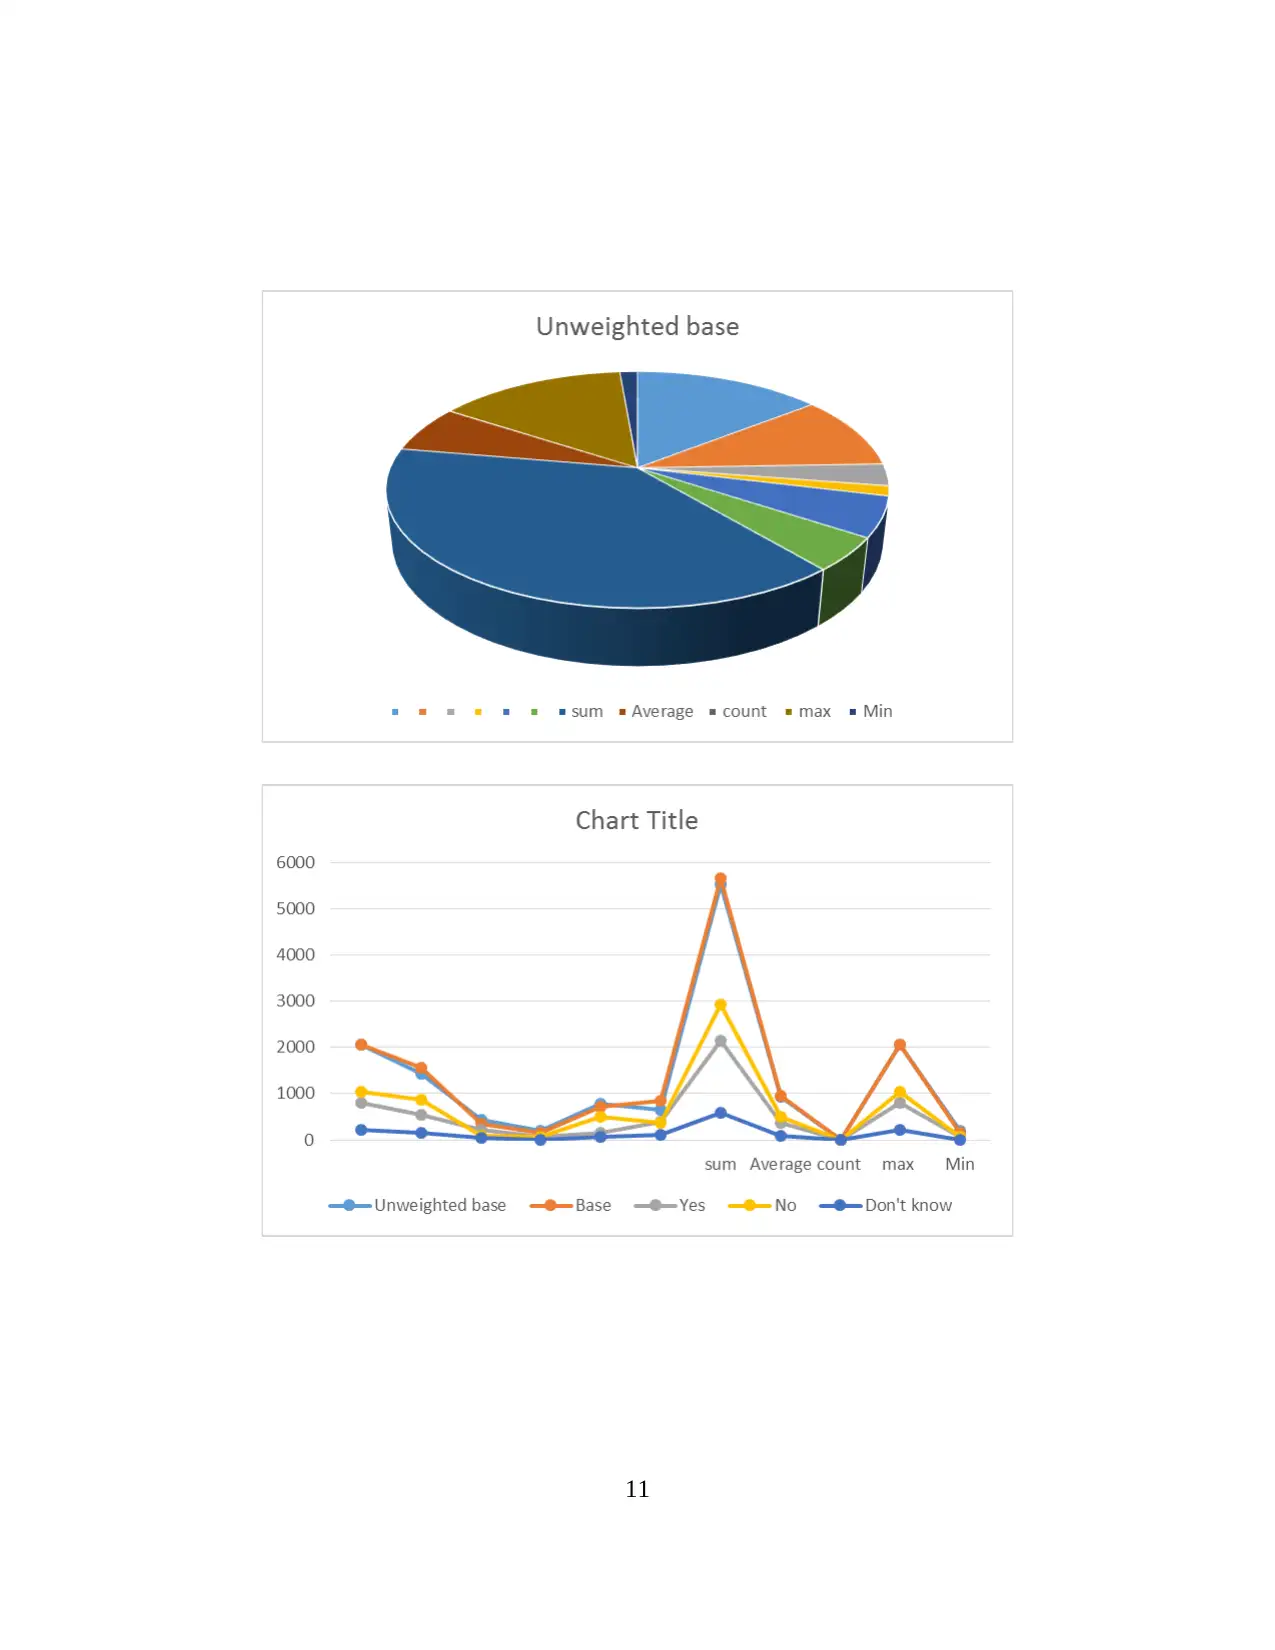
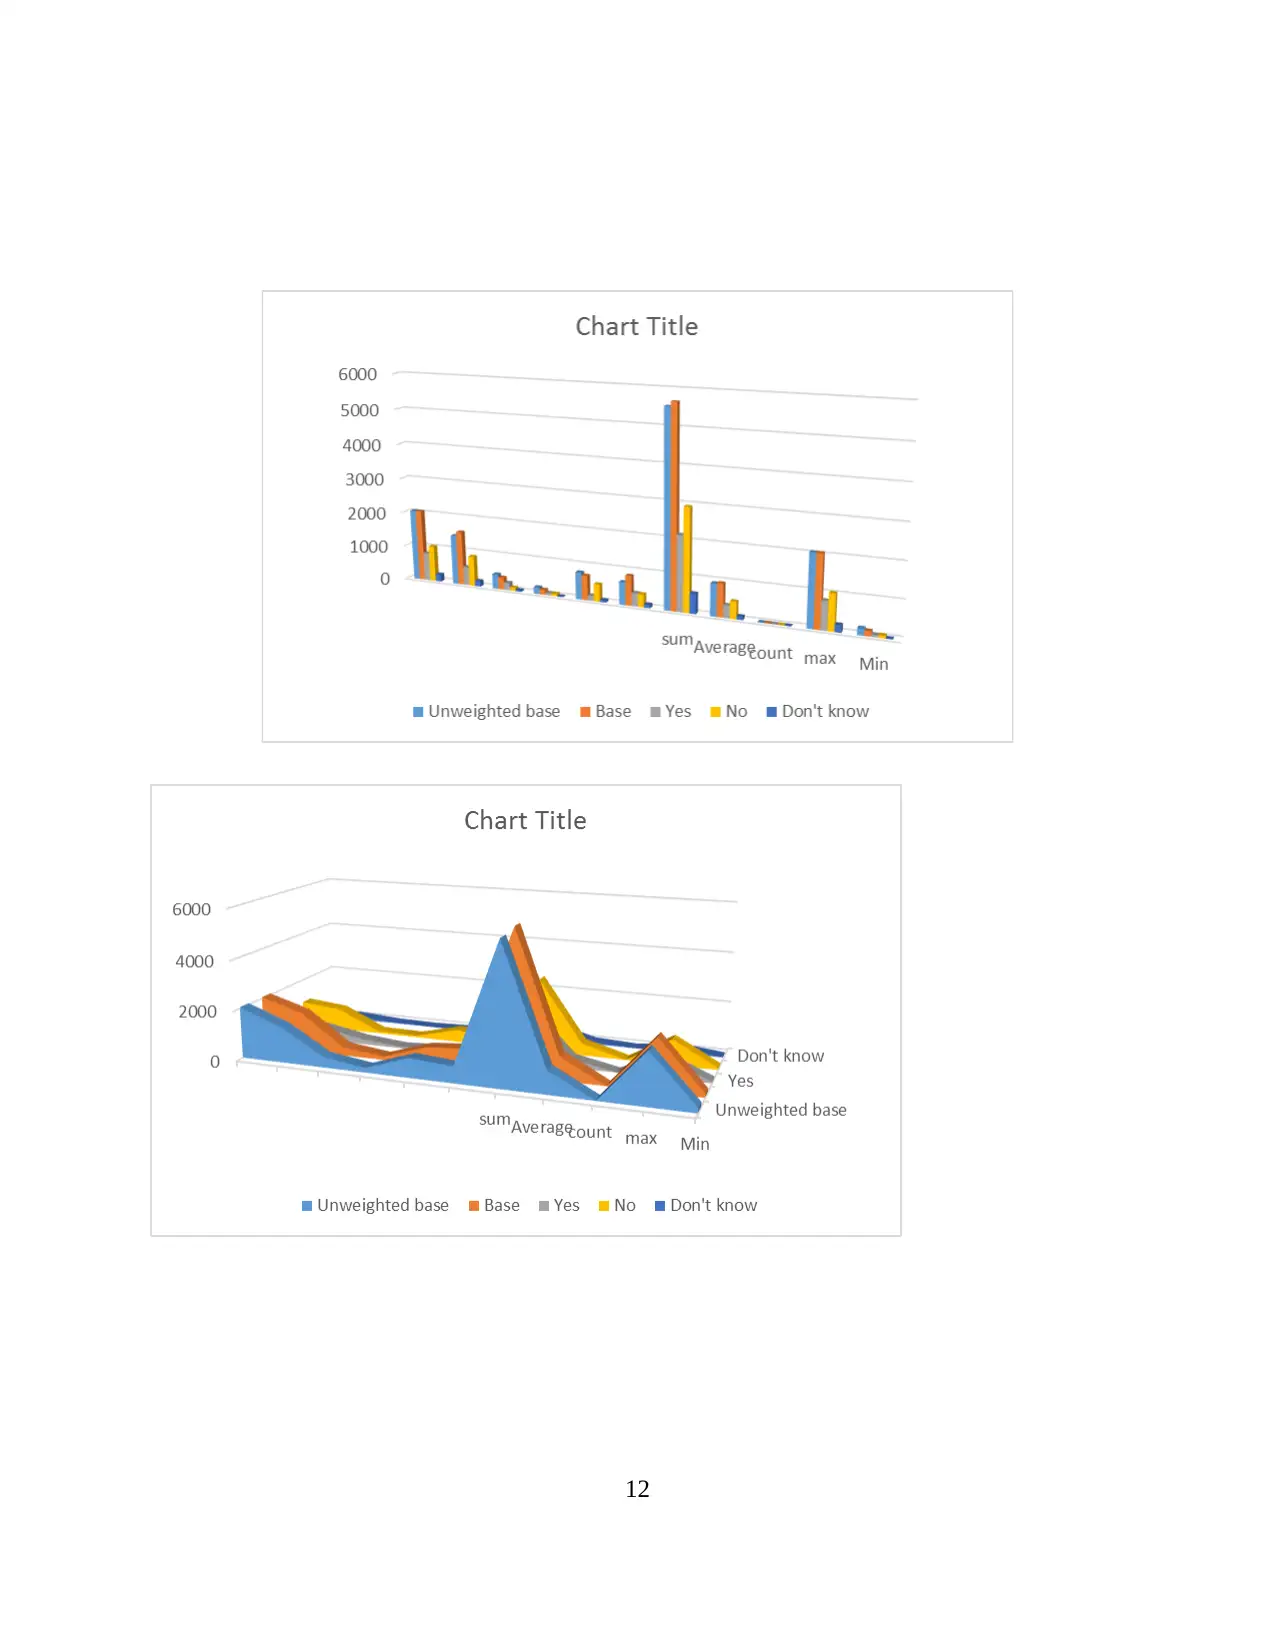
This assignment delves into the impact of Brexit on private, public, and SME organizations in the UK, employing statistical techniques to analyze the effect on recruitment and redundancies. The research utilizes mean, median, and mode to interpret data related to organizational planning. It involves data manipulation using auto-sum formulas to summarize key findings, and the communication of information is enhanced through the use of visual representations, including charts. The assignment provides a comprehensive analysis of the data set and presents the findings in an organized manner, drawing conclusions about the impact of Brexit on the UK business landscape. The assignment also covers the data manipulation using auto-sum formula (Sum, Average, Count, Max and Min) and communicates the information using visual representations.
tabler-icon-diamond-filled.svg

Contribute Materials

Your contribution can guide someone’s learning journey. Share your documents today.
Document Page
Data Handling & Using ICT
1
tabler-icon-diamond-filled.svg

Secure Best Marks with AI Grader

Need help grading? Try our AI Grader for instant feedback on your assignments.
Document Page
Contents
Topic of understanding................................................................................................................3
Statistical Techniques..................................................................................................................3
Data Manipulation.......................................................................................................................3
Present the data in appropriate types of chart............................................................................10
Conclusions....................................................................................................................................13
REFERENCES..............................................................................................................................14
2
Document Page
Topic of understanding
The research topic is related to the impact of Brexit on private and public organization
and SME of UK. As per selecting the topic in order to perform the mathematical data and
manage or control in proper manner (Vivaudou, 2019). the research topic is all about identify the
any kind of planning redundancies during next three months. These are directly affecting on the
performance of Private and public organization.
Statistical Techniques
 Mean- it is based on the concept in mathematics and statistics. The mean is that calculate
average or most common value in collection of numbers. In context of statistics, it can be
measured the central tendency of probability distribution among mode, median. For Data
set, the arithmetic means, also known as average (Dunbar, 2020).
 Median – it is basically define the middle number of group of numbers. That is half of
number have identified the values which become greater than median, half the number
have values that are less than median (Grech, 2018).
 Mode- it is another kind of technique which may consider values that appears most
frequently in a large data set (Schmidt, Church and Riley, 2020). This the best technique is
helping to measure central tendency which include mean, middle value in set.
Data Manipulation
a) Auto-sum formula (Sum, Average, Count, Max and Min)
Q1. Is your organisation planning to recruit
employees in the next THREE months?
Unweighted base 2053 1433 427 193 781 652
Base 2053 1560 349 144 708 852
Yes 813 532 217 63 150 382
No 1032 869 94 70 498 371
Don't know 208 159 38 11 60 99
3
Document Page
sum Average count max Min
5539 923 6 2053 193
5666 944 6 2053 144
2157 360 6 813 63
2934 489 6 1032 70
575 96 6 208 11
Q3a. To what extent will these redundancies
affect your overall headcount over the next
three months?
Unweighted base 431 327 75 29 127 200
Base 446 362 60 24 110 252
It will affect 0.01% to 10% 164 118 32 14 24 95
It will affect 10.01% to 20% 80 64 11 5 19 45
It will affect 20.01% to 30% 60 53 5 3 21 32
It will affect 30.01% to 40% 27 22 4 1 12 10
It will affect by 40.01% to 50% 27 23 2 1 13 10
It will affect 50.01% to 60% 14 14 1 - 6 8
It will affect 60.01% to 70% 4 3 1 - 1 2
It will affect 70.01% to 80% 8 8 - - 4 4
It will affect 80.01% to 90% 3 3 - - 1 2
It will affect 90.01% to 100% 8 7 1 - 4 3
Don't know 51 45 6 - 4 41
sum Average count max Min
1189 198 6 431 29
1254 209 6 446 24
447 75 6 164 14
4
tabler-icon-diamond-filled.svg

Secure Best Marks with AI Grader

Need help grading? Try our AI Grader for instant feedback on your assignments.
Document Page
224 37 6 80 5
174 29 6 60 3
76 13 6 27 1
76 13 6 27 1
43 9 5 14 1
11 2 5 4 1
24 6 4 8 4
9 2 4 3 1
23 5 5 8 1
147 29 5 51 4
Q1. Is your
organisation
planning to
recruit
employees in
the next THREE
months?
Private
sector
Public
sector
Third/voluntary
sector
Private
sector SME
(2-249)
Private
sector
large (250+)
Yes 532 217 63 150 382
No 869 94 70 498 371
Don't know 159 38 11 60 99
5
Document Page
Interpretation- it can be stated from graph that in private sector 532 said yes they are planning
to recruit staff in next 3 months and 869 said no. But in public 217 said yes and 94 said no.
however, in private SME 150 said yes and 498 said no and in private large sector 382 said yes
and 271 said no. thus, in private sector companies are not planning to hire staff but in public
sector organisation are planning to do so.
Statistical technique
Q3a. To what
extent will these
redundancies
affect your
overall
headcount over
the next three
months?
Private sector Public sector Third/voluntary
sector
Private sector
SME (2-249)
Private sector
large (250+)
It will affect 0.01%
to 10% 118 32 14 24 95
6
Document Page
It will affect
10.01% to 20% 64 11 5 19 45
It will affect
20.01% to 30% 53 5 3 21 32
It will affect
30.01% to 40% 22 4 1 12 10
It will affect by
40.01% to 50% 23 2 1 13 10
It will affect
50.01% to 60% 14 1 - 6 8
It will affect
60.01% to 70% 3 1 - 1 2
It will affect
70.01% to 80% 8 - - 4 4
It will affect
80.01% to 90% 3 - - 1 2
It will affect
90.01% to 100% 7 1 - 4 3
Don't know 45 6 - 4 41
mean 33 7 5 10 23
median 22 4 3 6 10
SD 33.59137 9.357113 4.833218 7.959609 27.43407
mode 3 1 1 4 10
Interpretation- from table it can be analysed that mean of private sector is 33 and median is 22.
The SD is 33.5 and mode is 1. But in public sector the mean is 7, median is 4 and SD is 9.3 and
mode is 1. In private SME mean is 10, median is 6, SD is 7.9 and mode is 4. In large private
sector mean is 23, median is 10, SD is 27.4 and mode is 10.
Data manipulation
7
tabler-icon-diamond-filled.svg

Paraphrase This Document

Need a fresh take? Get an instant paraphrase of this document with our AI Paraphraser
Document Page
QM4. Does
your
organisation
currently
employ any
EU
nationals in
the UK? EU
nationals
are people
working in
the UK who
are citizens
of another
country in
the
European
Union,
including
the Republic
of Ireland.
Private
sector
Public
sector
Third/voluntary
sector
Private
sector
SME (2-
249)
Private
sector
large
(250+)
Yes 978 256 84 273 705
No 508 68 50 415 93
Don't know 74 26 10 19 55
sum
1560 350 144 707 853
average
520 117 48 236 284
count
3 3 3 3 3
8
Document Page
max
978 256 84 415 705
min
74 26 10 19 55
Interpretation- It can be interpreted that sum of private sector is 1560 and of public sector is
350. The average is 520 in private and 117 in public. Where count of all data is 3. The max in
private is 978 and min is 74 but in public max is 256 and min is 26.
9
Document Page
Communicate the information using Visual Representations
Present the data in appropriate types of chart
a) Auto-sum formula (Sum, Average, Count, Max and Min)
Q1. Is your organisation planning to recruit
employees in the next THREE months?
Unweighted base 2053 1433 427 193 781 652
Base 2053 1560 349 144 708 852
Yes 813 532 217 63 150 382
No 1032 869 94 70 498 371
Don't know 208 159 38 11 60 99
sum Average count max Min
5539 923 6 2053 193
5666 944 6 2053 144
2157 360 6 813 63
2934 489 6 1032 70
575 96 6 208 11
10
tabler-icon-diamond-filled.svg

Secure Best Marks with AI Grader

Need help grading? Try our AI Grader for instant feedback on your assignments.
Document Page
11
Document Page
12
Document Page
Conclusions
From above discussion, it has been summarized about the concept of statistical technique
or method that help for calculating the accurate result and outcome. It has been chosen the large
data set about the Brexit where different public and private of SMEs perform significant
operations in UK. As per analysis, it has summarized that select appropriate data for sampling,
present raw data on spreadsheet and perform the excel functions such as mean, median and
mode. Furthermore, it has been described the communication of information in order to represent
into the form of different charts.
13
tabler-icon-diamond-filled.svg

Paraphrase This Document

Need a fresh take? Get an instant paraphrase of this document with our AI Paraphraser
Document Page
REFERENCES
Book and Journals
Dunbar, L., 2020. The Other Part of the Job: Rapid Data Analysis with Excel and Sheets. General Music
Today. 33(2). pp.83-86.
Grech, V., 2018. WASP (Write a Scientific Paper) using Excel—1: Data entry and validation. Early
human development. 117. pp.98-103.
Schmidt, P.J., Church, K.S. and Riley, J., 2020. Clinging to Excel as a security blanket: Investigating
accountants' resistance to emerging data analytics technology. Journal of Emerging
Technologies in Accounting. 17(1). pp.33-39.
Vivaudou, M., 2019. eeFit: a Microsoft Excel-embedded program for interactive analysis and fitting of
experimental dose–response data. BioTechniques. 66(4). pp.186-193.
14
chevron_up_icon
1 out of 14
circle_padding
hide_on_mobile
zoom_out_icon
logo.png

Your All-in-One AI-Powered Toolkit for Academic Success.

Available 24*7 on WhatsApp / Email

[object Object]