Business Research Methods Report: BA5004QA - Retail Industry Analysis
VerifiedAdded on 2023/06/08
|19
|2710
|336
Report
AI Summary
This report, prepared for the BA5004QA Business Research Methods course, delves into the analysis of self-checkout counter systems within the retail industry. It examines whether these systems enhance productivity and investigates demographic differences between users and non-users. The report is structured into two parts: Part One outlines the research methodology, including survey instruments, sampling techniques, and statistical analysis. Part Two presents two case studies. The first case study analyzes consumer shopping behavior at Amazon Fresh, applying hypothesis testing to determine the proportion of shoppers using the service and their comfort with mobile technology. The second case study examines the relationship between entrepreneurial intention and knowledge gained from an entrepreneurship module, employing statistical tests like one-way ANOVA to assess the impact of university departments on entrepreneurial intentions. The report includes descriptive statistics, hypothesis testing results, and discussions of the statistical significance of findings, providing a comprehensive overview of the research and its implications for the retail sector and entrepreneurial education.
BA5004QA Business Research
Methods
Methods
Paraphrase This Document
Need a fresh take? Get an instant paraphrase of this document with our AI Paraphraser
TABLE OF CONTENTS
PART ONE......................................................................................................................................3
1...................................................................................................................................................3
2...................................................................................................................................................3
3...................................................................................................................................................4
4...................................................................................................................................................4
5...................................................................................................................................................4
PART TWO.....................................................................................................................................4
CASE STUDY 1..............................................................................................................................5
1...................................................................................................................................................5
2...................................................................................................................................................5
3...................................................................................................................................................5
4...................................................................................................................................................6
CASE STUDY 2..............................................................................................................................7
1...................................................................................................................................................7
2...................................................................................................................................................7
3...................................................................................................................................................7
4...................................................................................................................................................8
REFERENCES................................................................................................................................9
APPENDIX....................................................................................................................................10
PART ONE
1
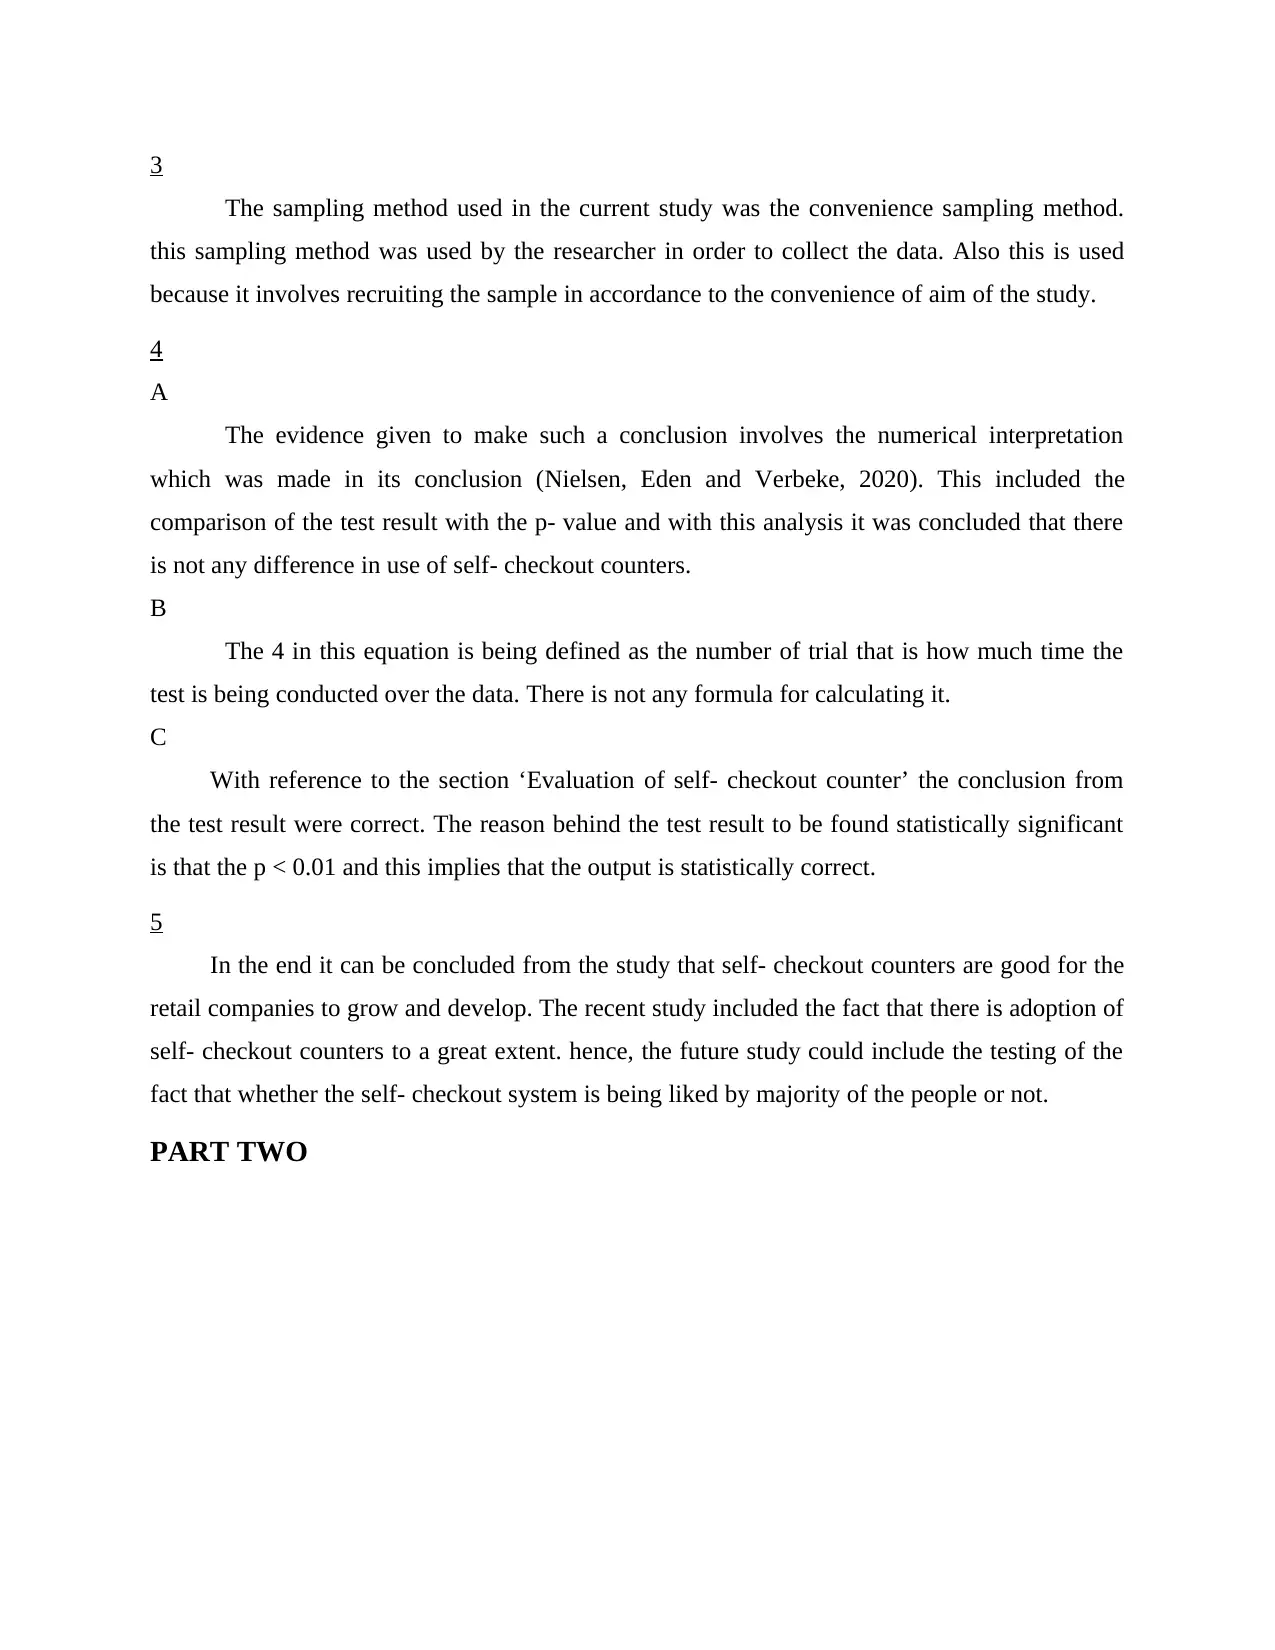
The aim of the present study is to analyse the use of self- checkout counter system within
the retail industry. Also the report aims to analyse the fact that whether this system assist the
retailers in attaining higher rates of productivity or not (Leng and Wee, 2017). The major
research question of the paper is to analyse that whether there is demographic difference being
present between the users and non- users of self- checkout system or not. Along with this another
research question is to analyse the difference between user and non- user of self- checkout
counters.
2
A
In the present research the survey instrument used included the three different sections
which are as follows-
The first section includes the analysis of the fact that whether the respondent is a user or
not for the self- checkout counters.
Another section included the five- point Likert scale question which aimed to measure
the perception of respondent relating to self- checkout counters.
In the end the third section included the seven five point Likert scale wherein respondent
were allowed to share the likelihood that whether they are interested in using the self –
checkout counters or not.
B
In the second sub- section, the concept measured is perception of the respondent relating
to self- checkout counters and there is any relative advantage or not. The variables included
different dimension that is Relative Advantage, Perceived Complexity, Reliability and Fun.
C
The Cronbach alpha is very important to be outlined within the study as it assures that the
data used is highly reliable and the study will provide for better results. It represents that
authenticity and reliability and validity of the data being collected.
1
The aim of the present study is to analyse the use of self- checkout counter system within
the retail industry. Also the report aims to analyse the fact that whether this system assist the
retailers in attaining higher rates of productivity or not (Leng and Wee, 2017). The major
research question of the paper is to analyse that whether there is demographic difference being
present between the users and non- users of self- checkout system or not. Along with this another
research question is to analyse the difference between user and non- user of self- checkout
counters.
2
A
In the present research the survey instrument used included the three different sections
which are as follows-
The first section includes the analysis of the fact that whether the respondent is a user or
not for the self- checkout counters.
Another section included the five- point Likert scale question which aimed to measure
the perception of respondent relating to self- checkout counters.
In the end the third section included the seven five point Likert scale wherein respondent
were allowed to share the likelihood that whether they are interested in using the self –
checkout counters or not.
B
In the second sub- section, the concept measured is perception of the respondent relating
to self- checkout counters and there is any relative advantage or not. The variables included
different dimension that is Relative Advantage, Perceived Complexity, Reliability and Fun.
C
The Cronbach alpha is very important to be outlined within the study as it assures that the
data used is highly reliable and the study will provide for better results. It represents that
authenticity and reliability and validity of the data being collected.
⊘ This is a preview!⊘
Do you want full access?
Subscribe today to unlock all pages.
Trusted by 1+ million students worldwide
3
The sampling method used in the current study was the convenience sampling method.
this sampling method was used by the researcher in order to collect the data. Also this is used
because it involves recruiting the sample in accordance to the convenience of aim of the study.
4
A
The evidence given to make such a conclusion involves the numerical interpretation
which was made in its conclusion (Nielsen, Eden and Verbeke, 2020). This included the
comparison of the test result with the p- value and with this analysis it was concluded that there
is not any difference in use of self- checkout counters.
B
The 4 in this equation is being defined as the number of trial that is how much time the
test is being conducted over the data. There is not any formula for calculating it.
C
With reference to the section ‘Evaluation of self- checkout counter’ the conclusion from
the test result were correct. The reason behind the test result to be found statistically significant
is that the p < 0.01 and this implies that the output is statistically correct.
5
In the end it can be concluded from the study that self- checkout counters are good for the
retail companies to grow and develop. The recent study included the fact that there is adoption of
self- checkout counters to a great extent. hence, the future study could include the testing of the
fact that whether the self- checkout system is being liked by majority of the people or not.
PART TWO
Paraphrase This Document
Need a fresh take? Get an instant paraphrase of this document with our AI Paraphraser
CASE STUDY 1
1
Consider shopping at Amazon Fresh
Frequency Percent Valid Percent
Cumulative
Percent
Valid No 32 36.8 36.8 36.8
Yes 55 63.2 63.2 100.0
Total 87 100.0 100.0
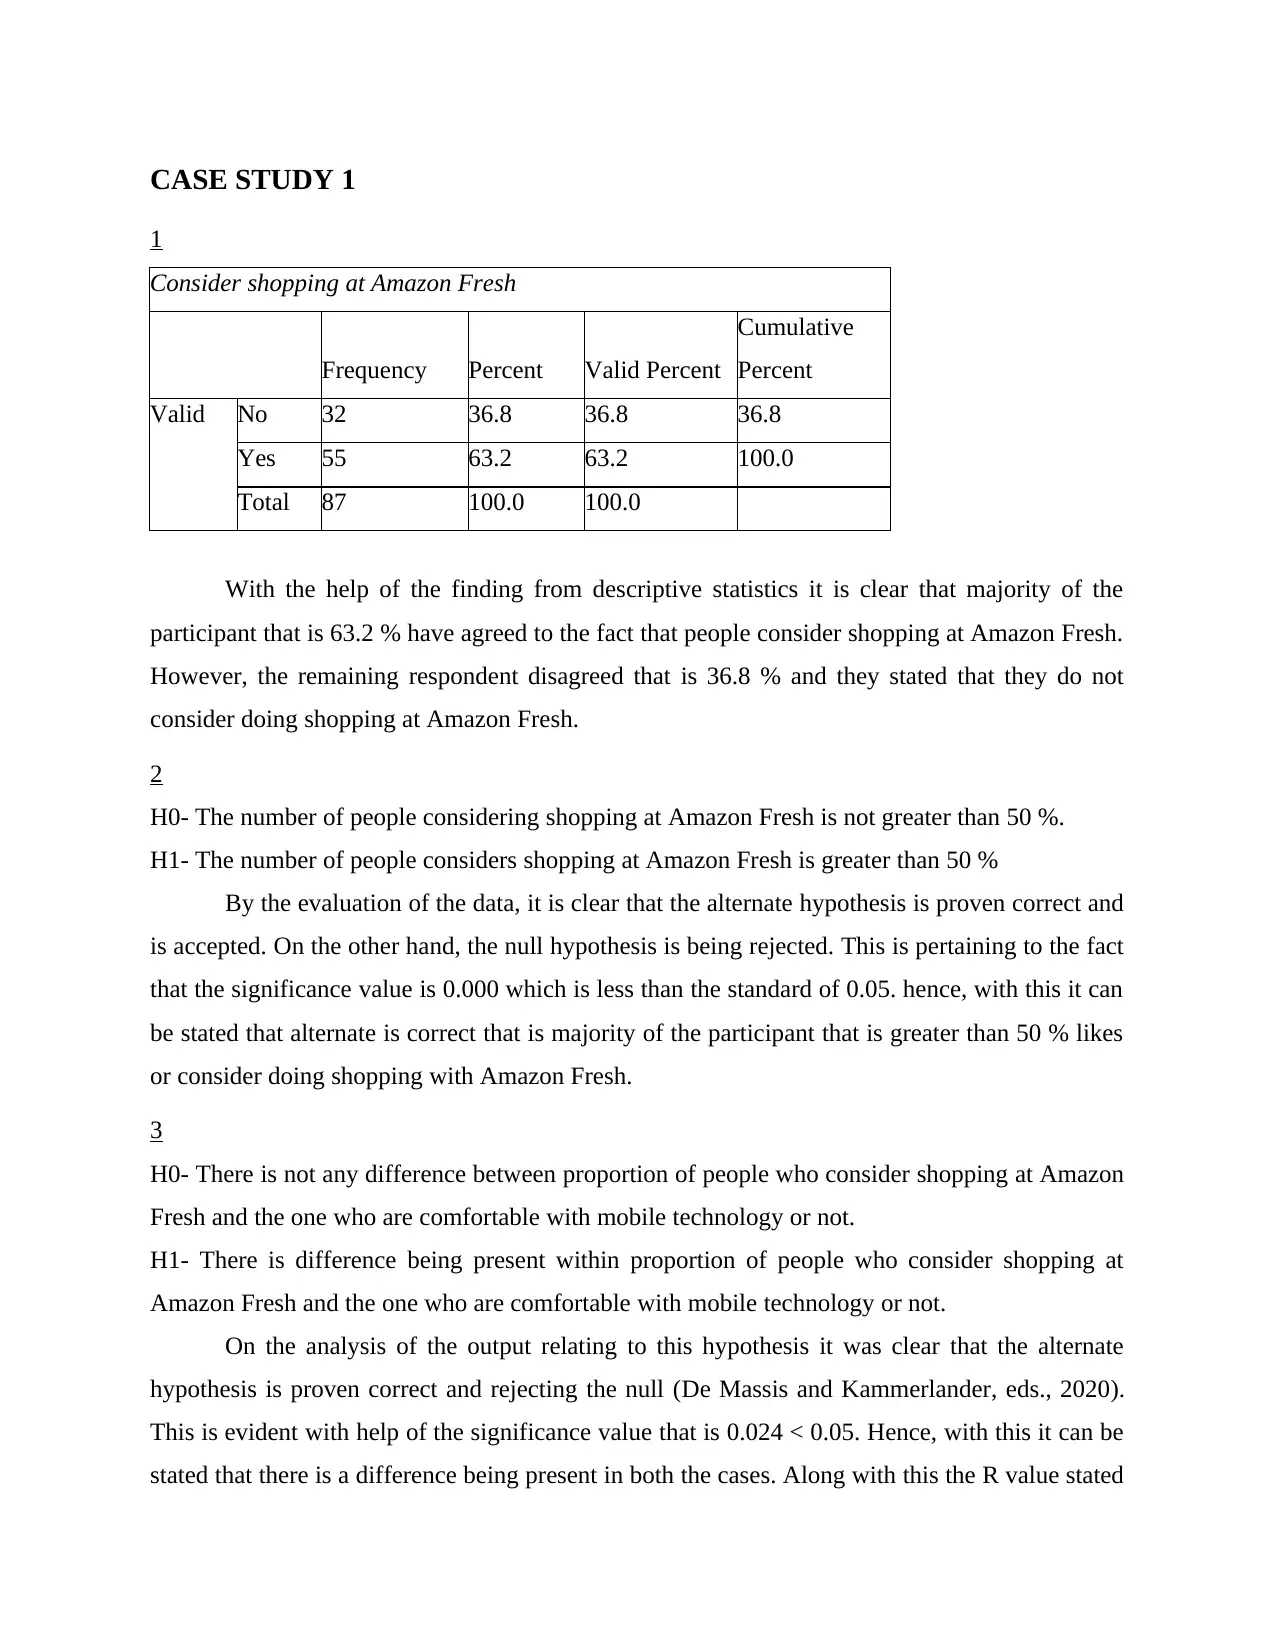
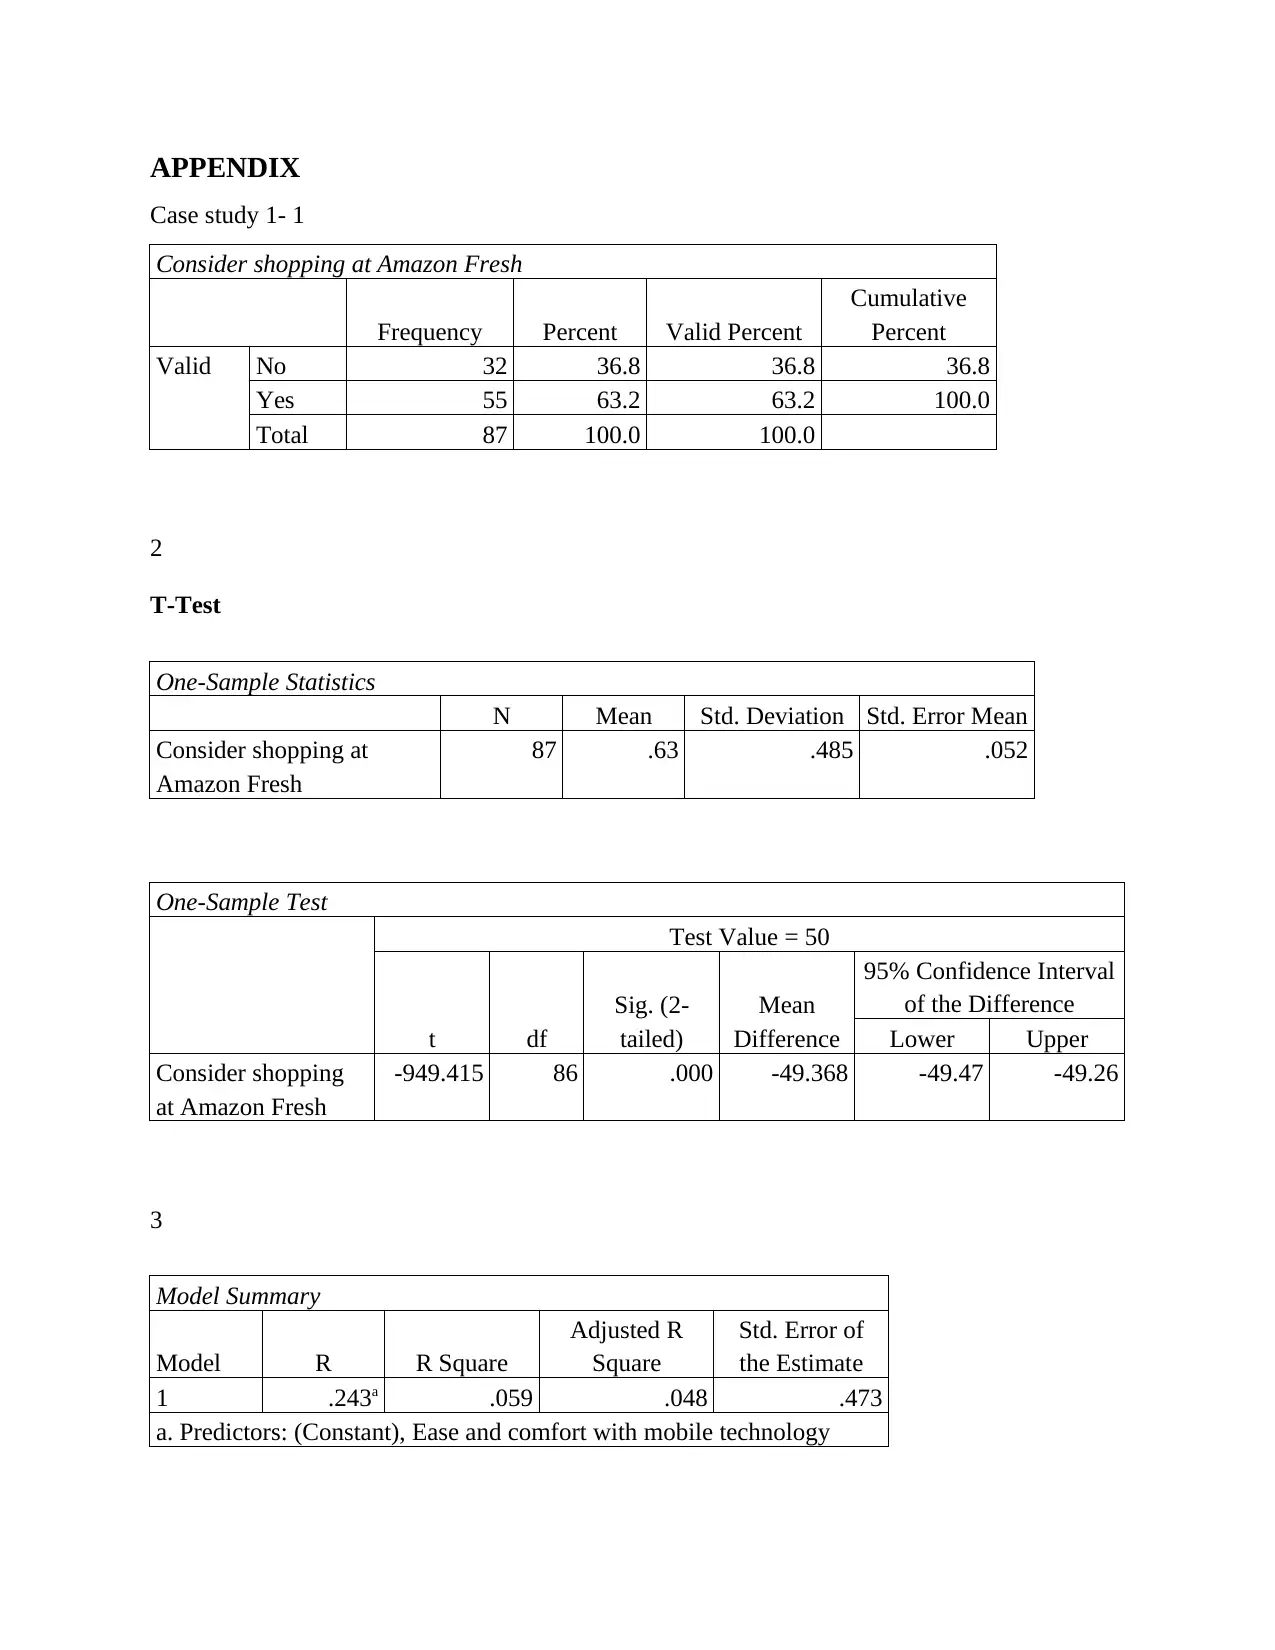
With the help of the finding from descriptive statistics it is clear that majority of the
participant that is 63.2 % have agreed to the fact that people consider shopping at Amazon Fresh.
However, the remaining respondent disagreed that is 36.8 % and they stated that they do not
consider doing shopping at Amazon Fresh.
2
H0- The number of people considering shopping at Amazon Fresh is not greater than 50 %.
H1- The number of people considers shopping at Amazon Fresh is greater than 50 %
By the evaluation of the data, it is clear that the alternate hypothesis is proven correct and
is accepted. On the other hand, the null hypothesis is being rejected. This is pertaining to the fact
that the significance value is 0.000 which is less than the standard of 0.05. hence, with this it can
be stated that alternate is correct that is majority of the participant that is greater than 50 % likes
or consider doing shopping with Amazon Fresh.
3
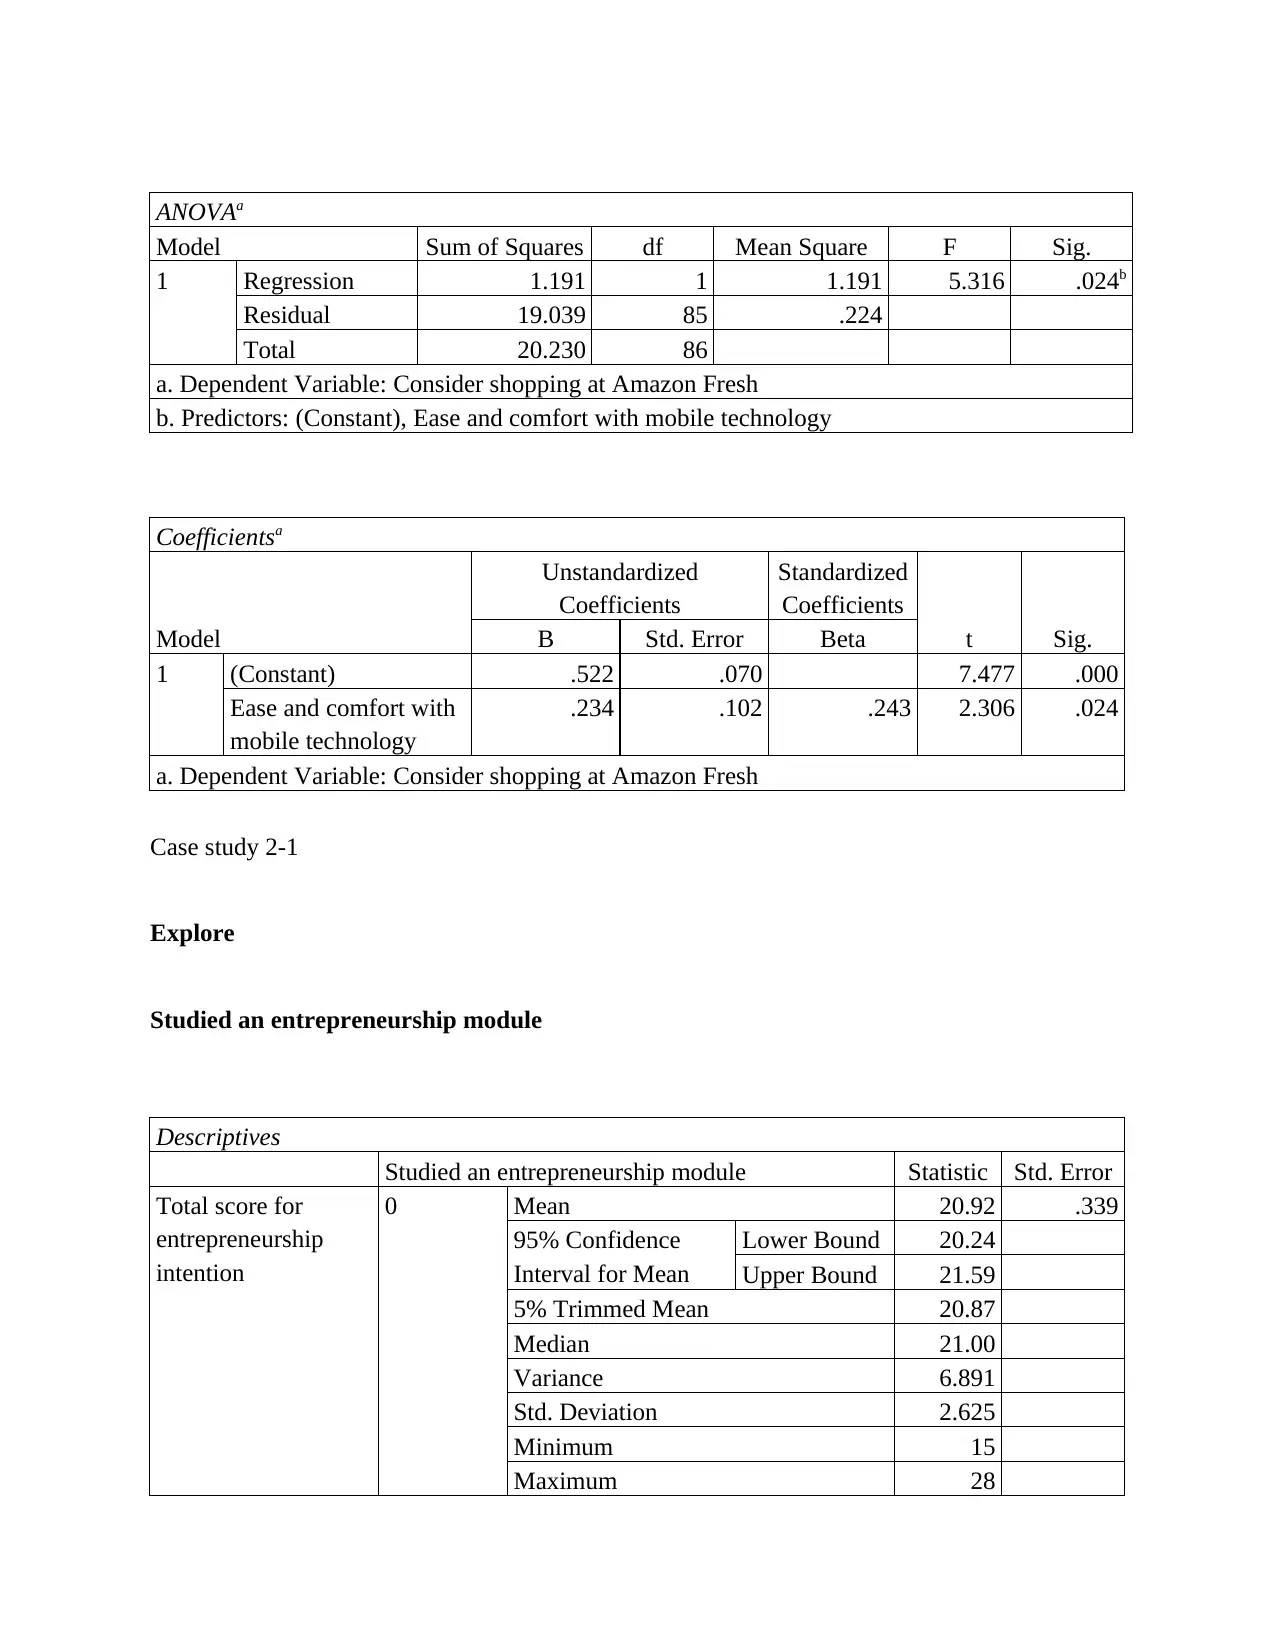
H0- There is not any difference between proportion of people who consider shopping at Amazon
Fresh and the one who are comfortable with mobile technology or not.
H1- There is difference being present within proportion of people who consider shopping at
Amazon Fresh and the one who are comfortable with mobile technology or not.
On the analysis of the output relating to this hypothesis it was clear that the alternate
hypothesis is proven correct and rejecting the null (De Massis and Kammerlander, eds., 2020).
This is evident with help of the significance value that is 0.024 < 0.05. Hence, with this it can be
stated that there is a difference being present in both the cases. Along with this the R value stated
1
Consider shopping at Amazon Fresh
Frequency Percent Valid Percent
Cumulative
Percent
Valid No 32 36.8 36.8 36.8
Yes 55 63.2 63.2 100.0
Total 87 100.0 100.0
With the help of the finding from descriptive statistics it is clear that majority of the
participant that is 63.2 % have agreed to the fact that people consider shopping at Amazon Fresh.
However, the remaining respondent disagreed that is 36.8 % and they stated that they do not
consider doing shopping at Amazon Fresh.
2
H0- The number of people considering shopping at Amazon Fresh is not greater than 50 %.
H1- The number of people considers shopping at Amazon Fresh is greater than 50 %
By the evaluation of the data, it is clear that the alternate hypothesis is proven correct and
is accepted. On the other hand, the null hypothesis is being rejected. This is pertaining to the fact
that the significance value is 0.000 which is less than the standard of 0.05. hence, with this it can
be stated that alternate is correct that is majority of the participant that is greater than 50 % likes
or consider doing shopping with Amazon Fresh.
3
H0- There is not any difference between proportion of people who consider shopping at Amazon
Fresh and the one who are comfortable with mobile technology or not.
H1- There is difference being present within proportion of people who consider shopping at
Amazon Fresh and the one who are comfortable with mobile technology or not.
On the analysis of the output relating to this hypothesis it was clear that the alternate
hypothesis is proven correct and rejecting the null (De Massis and Kammerlander, eds., 2020).
This is evident with help of the significance value that is 0.024 < 0.05. Hence, with this it can be
stated that there is a difference being present in both the cases. Along with this the R value stated
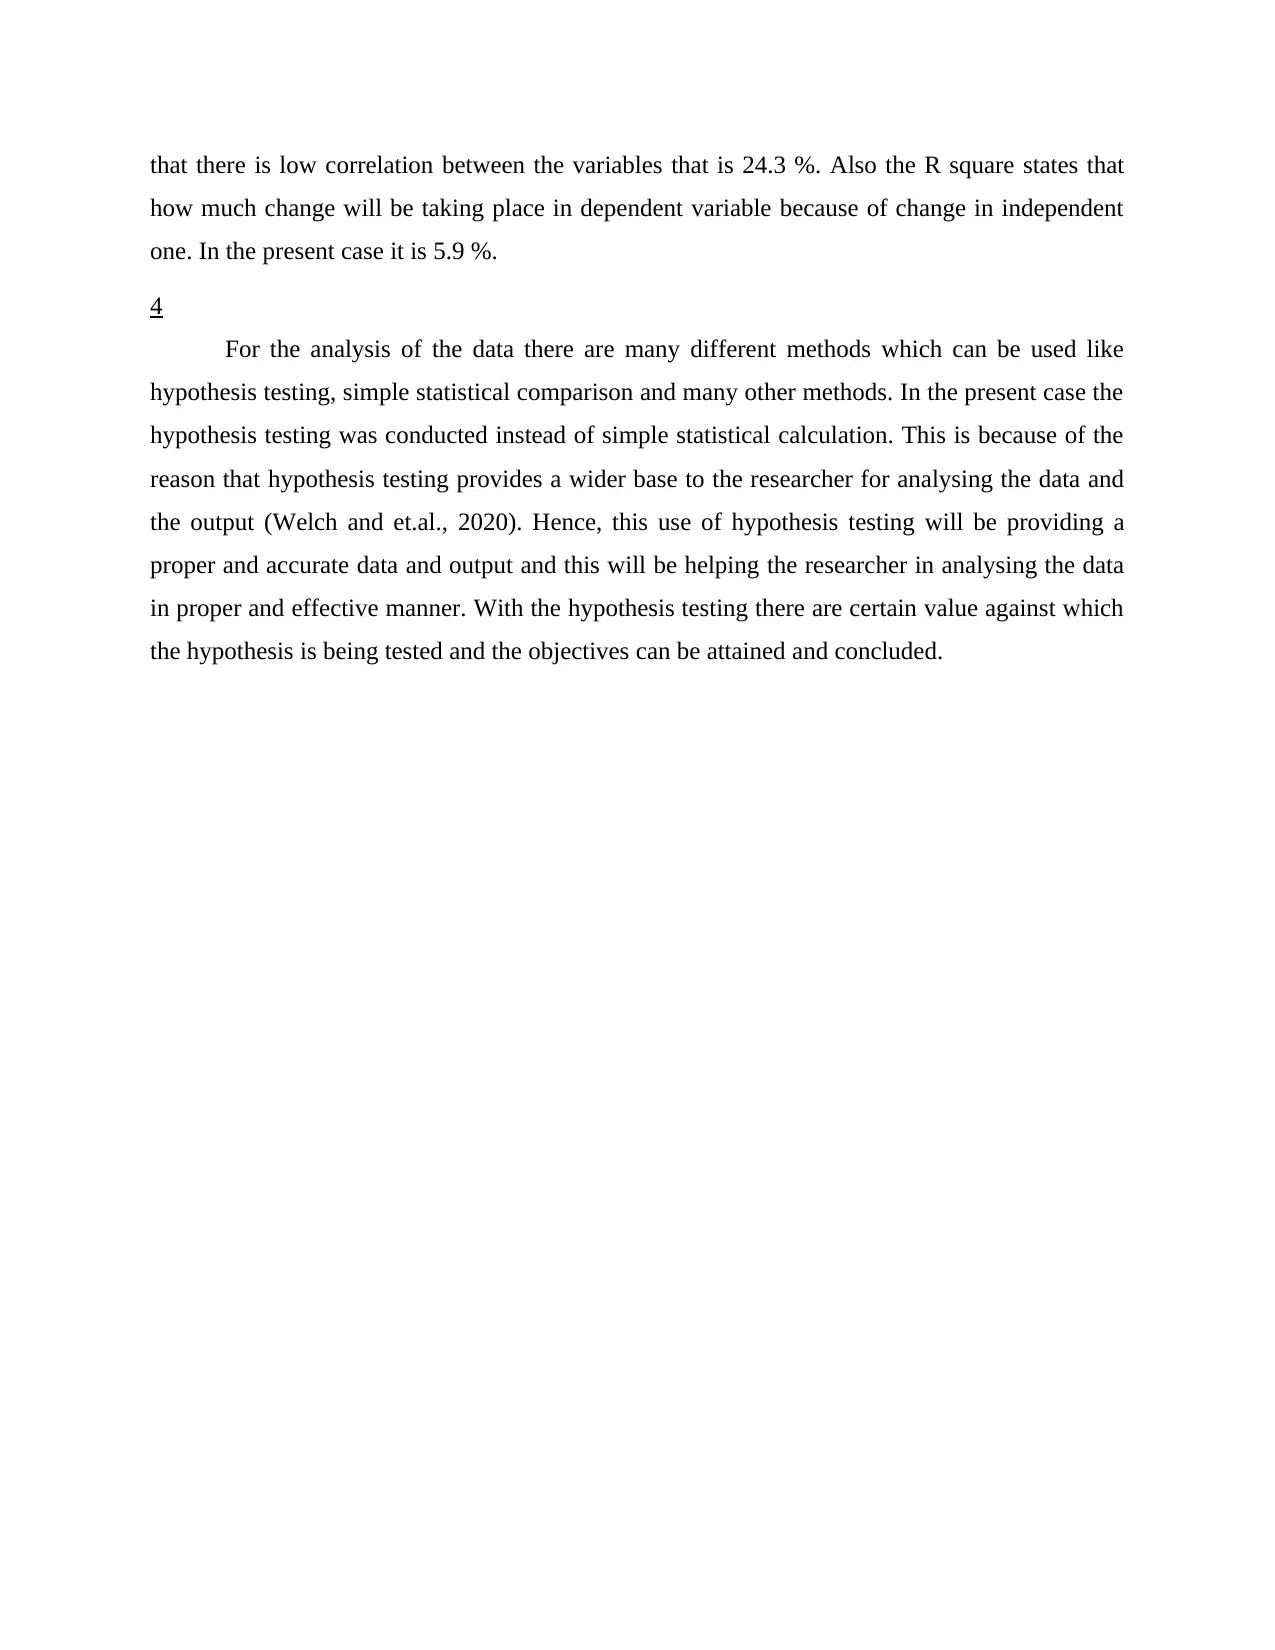
that there is low correlation between the variables that is 24.3 %. Also the R square states that
how much change will be taking place in dependent variable because of change in independent
one. In the present case it is 5.9 %.
4
For the analysis of the data there are many different methods which can be used like
hypothesis testing, simple statistical comparison and many other methods. In the present case the
hypothesis testing was conducted instead of simple statistical calculation. This is because of the
reason that hypothesis testing provides a wider base to the researcher for analysing the data and
the output (Welch and et.al., 2020). Hence, this use of hypothesis testing will be providing a
proper and accurate data and output and this will be helping the researcher in analysing the data
in proper and effective manner. With the hypothesis testing there are certain value against which
the hypothesis is being tested and the objectives can be attained and concluded.
⊘ This is a preview!⊘
Do you want full access?
Subscribe today to unlock all pages.
Trusted by 1+ million students worldwide
CASE STUDY 2
1
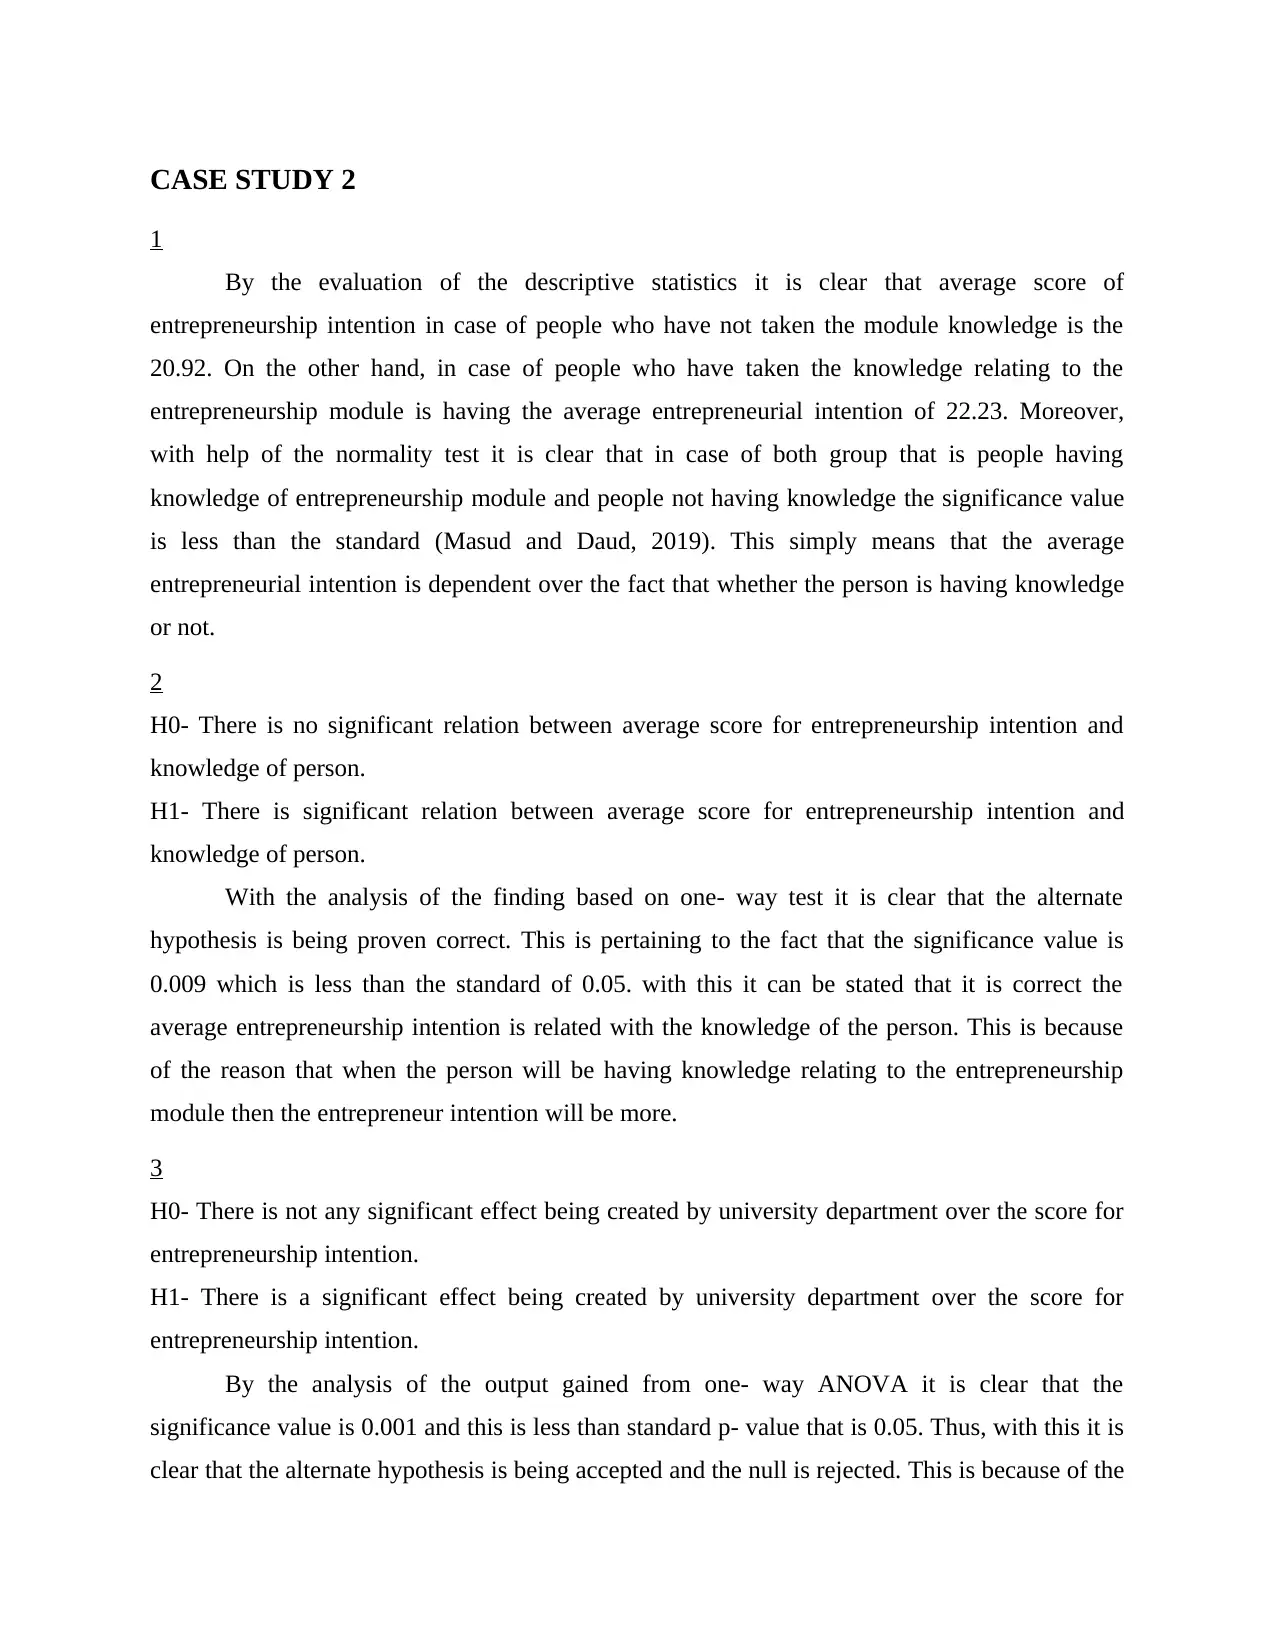
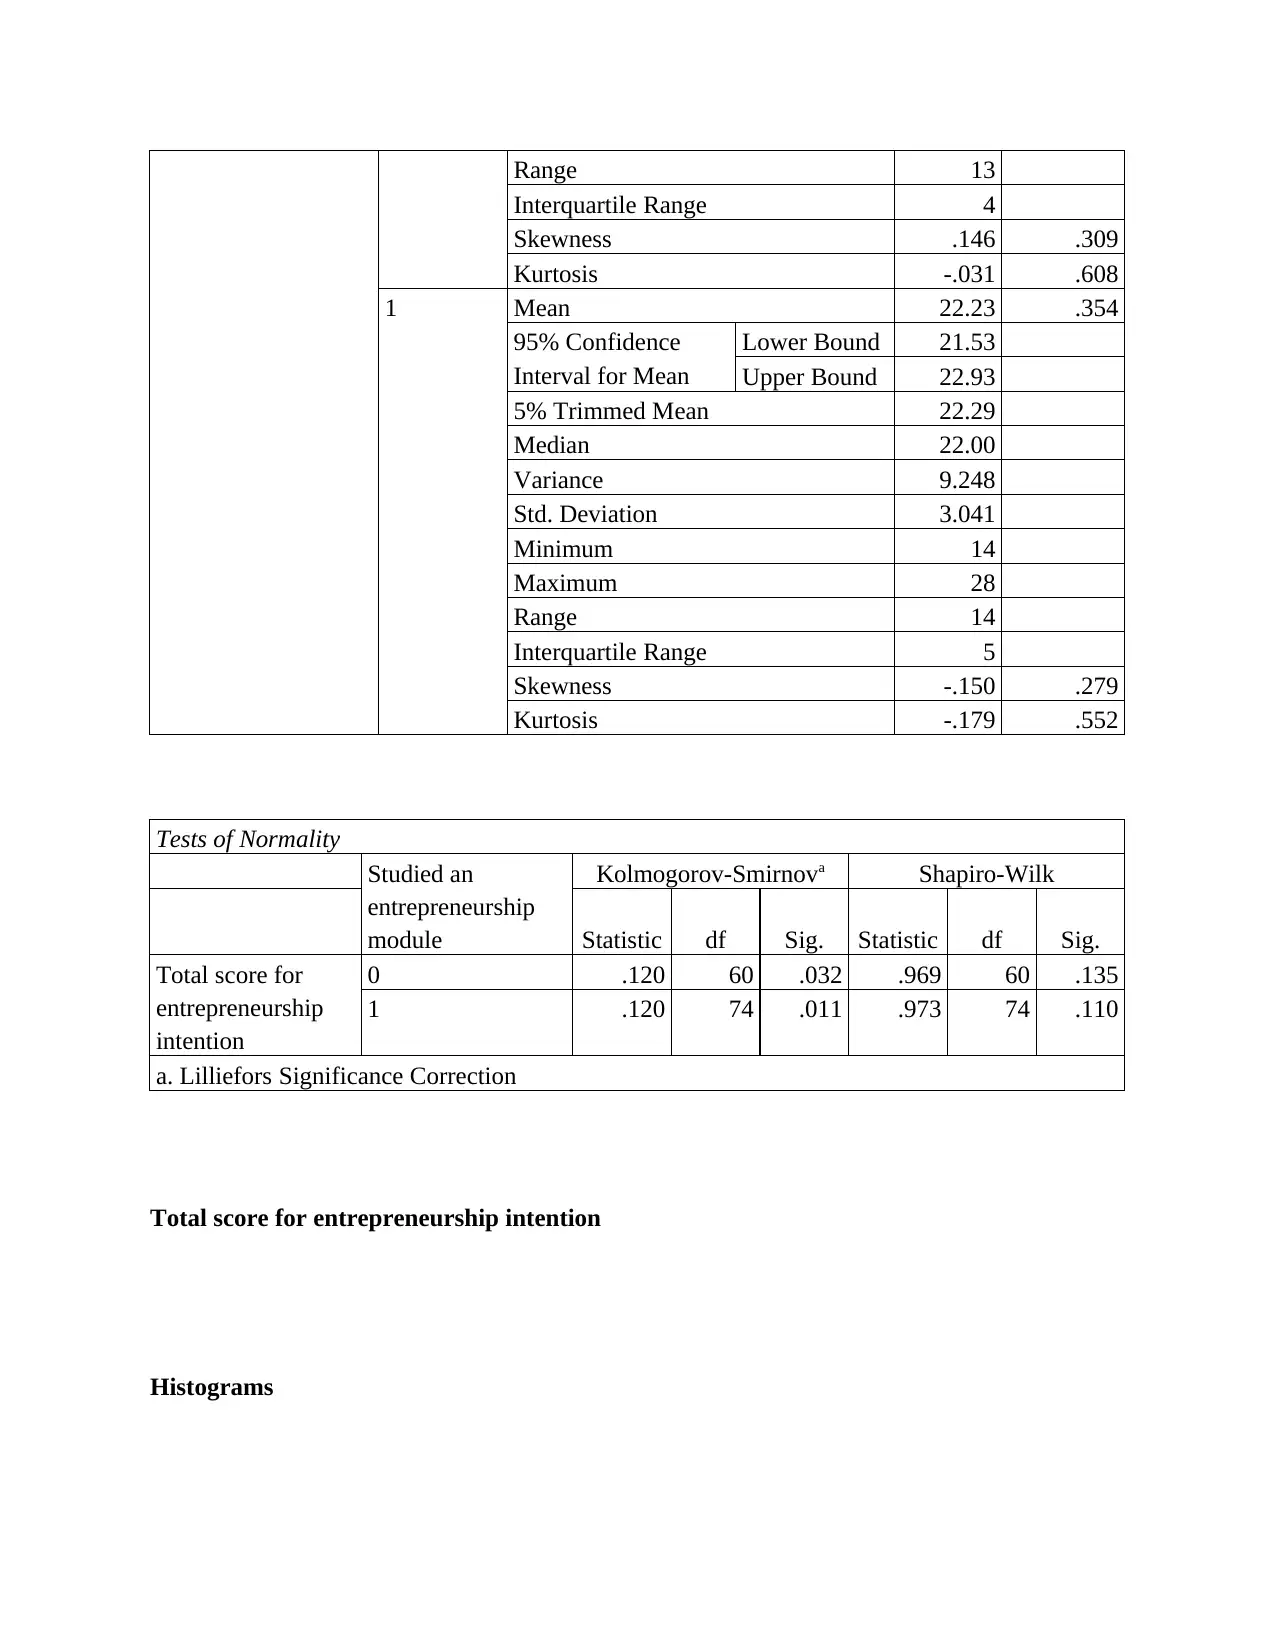
By the evaluation of the descriptive statistics it is clear that average score of
entrepreneurship intention in case of people who have not taken the module knowledge is the
20.92. On the other hand, in case of people who have taken the knowledge relating to the
entrepreneurship module is having the average entrepreneurial intention of 22.23. Moreover,
with help of the normality test it is clear that in case of both group that is people having
knowledge of entrepreneurship module and people not having knowledge the significance value
is less than the standard (Masud and Daud, 2019). This simply means that the average
entrepreneurial intention is dependent over the fact that whether the person is having knowledge
or not.
2
H0- There is no significant relation between average score for entrepreneurship intention and
knowledge of person.
H1- There is significant relation between average score for entrepreneurship intention and
knowledge of person.
With the analysis of the finding based on one- way test it is clear that the alternate
hypothesis is being proven correct. This is pertaining to the fact that the significance value is
0.009 which is less than the standard of 0.05. with this it can be stated that it is correct the
average entrepreneurship intention is related with the knowledge of the person. This is because
of the reason that when the person will be having knowledge relating to the entrepreneurship
module then the entrepreneur intention will be more.
3
H0- There is not any significant effect being created by university department over the score for
entrepreneurship intention.
H1- There is a significant effect being created by university department over the score for
entrepreneurship intention.
By the analysis of the output gained from one- way ANOVA it is clear that the
significance value is 0.001 and this is less than standard p- value that is 0.05. Thus, with this it is
clear that the alternate hypothesis is being accepted and the null is rejected. This is because of the
1
By the evaluation of the descriptive statistics it is clear that average score of
entrepreneurship intention in case of people who have not taken the module knowledge is the
20.92. On the other hand, in case of people who have taken the knowledge relating to the
entrepreneurship module is having the average entrepreneurial intention of 22.23. Moreover,
with help of the normality test it is clear that in case of both group that is people having
knowledge of entrepreneurship module and people not having knowledge the significance value
is less than the standard (Masud and Daud, 2019). This simply means that the average
entrepreneurial intention is dependent over the fact that whether the person is having knowledge
or not.
2
H0- There is no significant relation between average score for entrepreneurship intention and
knowledge of person.
H1- There is significant relation between average score for entrepreneurship intention and
knowledge of person.
With the analysis of the finding based on one- way test it is clear that the alternate
hypothesis is being proven correct. This is pertaining to the fact that the significance value is
0.009 which is less than the standard of 0.05. with this it can be stated that it is correct the
average entrepreneurship intention is related with the knowledge of the person. This is because
of the reason that when the person will be having knowledge relating to the entrepreneurship
module then the entrepreneur intention will be more.
3
H0- There is not any significant effect being created by university department over the score for
entrepreneurship intention.
H1- There is a significant effect being created by university department over the score for
entrepreneurship intention.
By the analysis of the output gained from one- way ANOVA it is clear that the
significance value is 0.001 and this is less than standard p- value that is 0.05. Thus, with this it is
clear that the alternate hypothesis is being accepted and the null is rejected. This is because of the
Paraphrase This Document
Need a fresh take? Get an instant paraphrase of this document with our AI Paraphraser
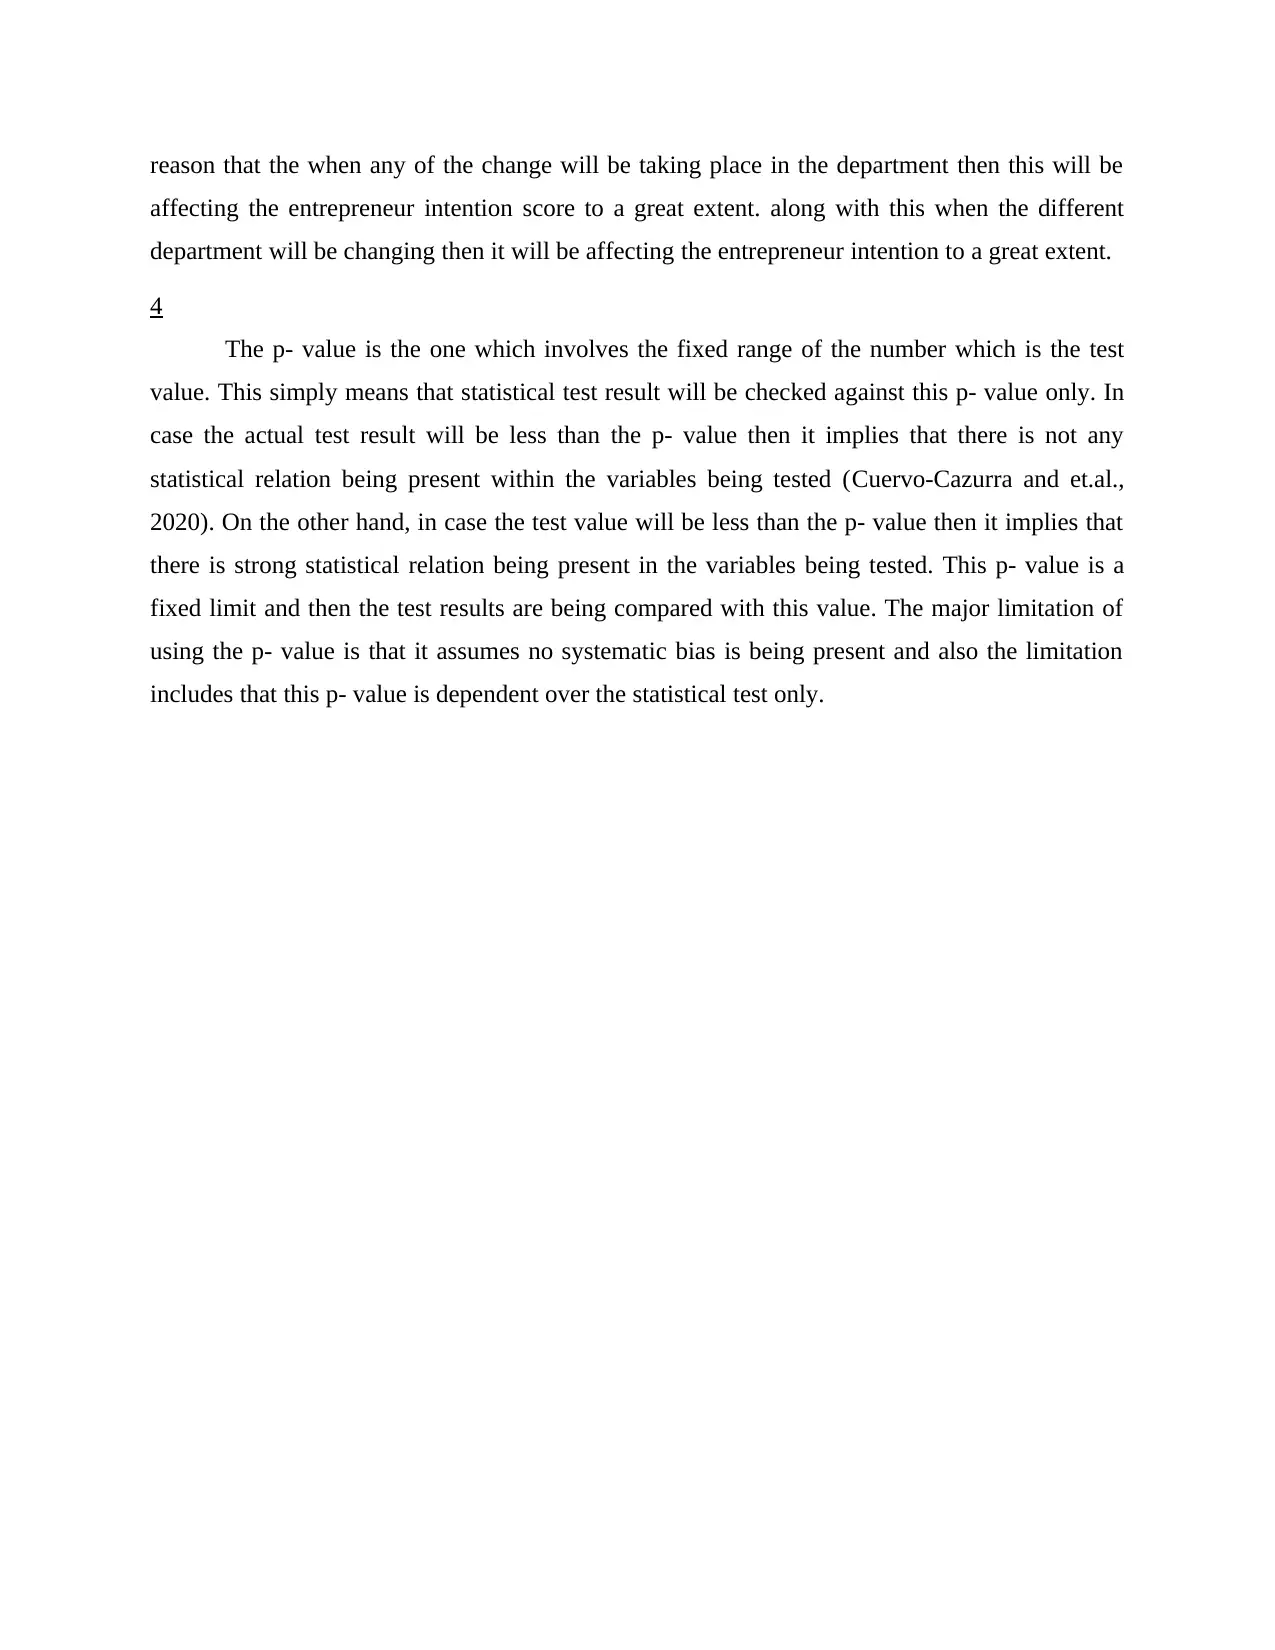
reason that the when any of the change will be taking place in the department then this will be
affecting the entrepreneur intention score to a great extent. along with this when the different
department will be changing then it will be affecting the entrepreneur intention to a great extent.
4
The p- value is the one which involves the fixed range of the number which is the test
value. This simply means that statistical test result will be checked against this p- value only. In
case the actual test result will be less than the p- value then it implies that there is not any
statistical relation being present within the variables being tested (Cuervo-Cazurra and et.al.,
2020). On the other hand, in case the test value will be less than the p- value then it implies that
there is strong statistical relation being present in the variables being tested. This p- value is a
fixed limit and then the test results are being compared with this value. The major limitation of
using the p- value is that it assumes no systematic bias is being present and also the limitation
includes that this p- value is dependent over the statistical test only.
REFERENCES
Books and Journals
Cuervo-Cazurra, A., and et.al., 2020. From the editors: Can I trust your findings? Ruling out
alternative explanations in international business research. In Research Methods in
International Business (pp. 121-157). Palgrave Macmillan, Cham.
De Massis, A. and Kammerlander, N. eds., 2020. Handbook of qualitative research methods for
family business. Edward Elgar Publishing.
Leng, H.K. and Wee, K.N.L., 2017. An examination of users and non-users of self-checkout
counters. The International Review of Retail, Distribution and Consumer Research, 27(1),
pp.94-108.
Masud, H. and Daud, W.N.W., 2019. Human resource management practices and organizational
commitment: Research methods, issues, and future directions. Review of Integrative
Business and Economics Research. 8. pp.217-226.
Nielsen, B.B., Eden, L. and Verbeke, A., 2020. Research methods in international business:
Challenges and advances. Research methods in international business, pp.3-41.
Welch, C., and et.al., 2020. Theorising from case studies: Towards a pluralist future for
international business research. In Research methods in international business (pp. 171-
220). Palgrave Macmillan, Cham.
⊘ This is a preview!⊘
Do you want full access?
Subscribe today to unlock all pages.
Trusted by 1+ million students worldwide
APPENDIX
Case study 1- 1
Consider shopping at Amazon Fresh
Frequency Percent Valid Percent
Cumulative
Percent
Valid No 32 36.8 36.8 36.8
Yes 55 63.2 63.2 100.0
Total 87 100.0 100.0
2
T-Test
One-Sample Statistics
N Mean Std. Deviation Std. Error Mean
Consider shopping at
Amazon Fresh
87 .63 .485 .052
One-Sample Test
Test Value = 50
t df
Sig. (2-
tailed)
Mean
Difference
95% Confidence Interval
of the Difference
Lower Upper
Consider shopping
at Amazon Fresh
-949.415 86 .000 -49.368 -49.47 -49.26
3
Model Summary
Model R R Square
Adjusted R
Square
Std. Error of
the Estimate
1 .243a .059 .048 .473
a. Predictors: (Constant), Ease and comfort with mobile technology
Paraphrase This Document
Need a fresh take? Get an instant paraphrase of this document with our AI Paraphraser
ANOVAa
Model Sum of Squares df Mean Square F Sig.
1 Regression 1.191 1 1.191 5.316 .024b
Residual 19.039 85 .224
Total 20.230 86
a. Dependent Variable: Consider shopping at Amazon Fresh
b. Predictors: (Constant), Ease and comfort with mobile technology
Coefficientsa
Model
Unstandardized
Coefficients
Standardized
Coefficients
t Sig.B Std. Error Beta
1 (Constant) .522 .070 7.477 .000
Ease and comfort with
mobile technology
.234 .102 .243 2.306 .024
a. Dependent Variable: Consider shopping at Amazon Fresh
Case study 2-1
Explore
Studied an entrepreneurship module
Descriptives
Studied an entrepreneurship module Statistic Std. Error
Total score for
entrepreneurship
intention
0 Mean 20.92 .339
95% Confidence
Interval for Mean
Lower Bound 20.24
Upper Bound 21.59
5% Trimmed Mean 20.87
Median 21.00
Variance 6.891
Std. Deviation 2.625
Minimum 15
Maximum 28
Range 13
Interquartile Range 4
Skewness .146 .309
Kurtosis -.031 .608
1 Mean 22.23 .354
95% Confidence
Interval for Mean
Lower Bound 21.53
Upper Bound 22.93
5% Trimmed Mean 22.29
Median 22.00
Variance 9.248
Std. Deviation 3.041
Minimum 14
Maximum 28
Range 14
Interquartile Range 5
Skewness -.150 .279
Kurtosis -.179 .552
Tests of Normality
Studied an
entrepreneurship
module
Kolmogorov-Smirnova Shapiro-Wilk
Statistic df Sig. Statistic df Sig.
Total score for
entrepreneurship
intention
0 .120 60 .032 .969 60 .135
1 .120 74 .011 .973 74 .110
a. Lilliefors Significance Correction
Total score for entrepreneurship intention
Histograms
⊘ This is a preview!⊘
Do you want full access?
Subscribe today to unlock all pages.
Trusted by 1+ million students worldwide
1 out of 19
Related Documents


Your All-in-One AI-Powered Toolkit for Academic Success.
+13062052269
info@desklib.com
Available 24*7 on WhatsApp / Email
![[object Object]](/_next/static/media/star-bottom.7253800d.svg)
Unlock your academic potential
Copyright © 2020–2026 A2Z Services. All Rights Reserved. Developed and managed by ZUCOL.